
S-1
Solutions Manual
to End-of-Chapter
Questions

The Global Economy
1. Figures 1-2 and 1-6 rely on data from 2010, and Figure 1-5 relies on data from 2005,
to map worldwide trade, migration, and FDI. Updated data for migration and FDI
were not available at the time this chapter was written, but it is available for world-
wide trade. In this question, you are asked to update the numbers for world trade
b. From this table, what is the total amount of trade within Europe? What percent-
age is this of total world trade?
S-3
Destination
North South and Middle
Origin America Central America Europe CIS* Africa East Asia World
World $2,923 $749 $6,881 $530 $538 $672 $5,133 $17,816
North America 1,103 201 382 15 37 63 476 2,282
States (CIS) 43 11 409 154 12 24 117 789
Africa 102 19 205 2 77 21 146 594
Middle East 107 10 158 6 38 110 660 1,251
Asia 906 189 922 110 152 242 2,926 5,538
Source: WTO, International Trade Statistices 2012
Intra- and Inter-regional Merchandise Trade, 2011 (Billions of U.S. Dollars)
12 The trade statistics for 2011 were obtained from Table I-4 at: http://www.wto.org/english/res_e/statis_e/its2012_e/
its12_world_trade_e.htm.
1
S-4 Solutions n Chapter 1 The Global Economy
c. What is the total amount of trade (in either direction) between Europe and
North America? Add that to the total trade within Europe, and calculate the
percentage of this to the world total.
d. What is the total amount of trade within the Americas (i.e., between North
America, Central America, South America, and within each of these regions)?
What percentage of total world trade is this?
e. What is the total value of exports from Europe and the Americas, and what per-
centage of the world total is this?
f. What is the total value of exports from Asia, and what percentage of the world
total is this?
g. What is the total value of exports from the Middle East and the Commonwealth
h. What is the total value of exports from Africa, and what percentage of the world
i. How do your answers to (b) through (h) compare with the shares of worldwide
trade shown in Table 1-1?
2. Visit the U.S. Bureau of Economic Analysis at bea.gov to find information for the
latest full calendar year (or for the last four quarters). What is the latest estimate of
the size of the annual U.S. current account deficit in billions of dollars?
3. Visit oanda.com (or another site with daily exchange rate data) and download data on
the same exchange rates (yuan per dollar and dollar per euro) for the past 12 months.
What are the rates today? What were they a year ago? By what percentage amount
did the rates change? Do you think the rates are floating or fixed? Why?
13 The Commonwealth of Independent States consists of: Azerbaijan, Armenia, Belarus, Georgia, Kazakhstan, Kyrgyzstan,
Moldova, Russia, Tajikistan, Turkmenistan, Uzbekistan, and Ukraine.
Solutions n Chapter 1 The Global Economy S-5
4. The data in Figure 1-6 end in the year 2011. Find the IMF’s World Economic
Outlook Databases. (Hint: Try searching “world economic outlook databases.”) Use
this full data set to obtain the latest data on current accounts in U.S. dollars for all
countries (actual data or IMF estimates). Which countries had the 10 largest deficits
last year? Which countries had the 10 largest surpluses last year?
S-6 Solutions n Chapter 1 The Global Economy
Political Stability
Control of Government and Absence Rule Regulatory Voice and
Zimbabwe 20.87 21.13 21.21 20.74 21.61 20.97
$20,000
18,000
2,000 North Korea
South Korea
0
1950 1960 1970 1980 1990 2000
Real GDP
per capita
$10,000
9,000
1,000
Botswana
0
1950 1960 1970 1980 1990 2000
Real GDP
per capita
$14,000
12,000
2,000
Argentina
0
1950 1960 1970 1980 1990 2000
Real GDP
per capita
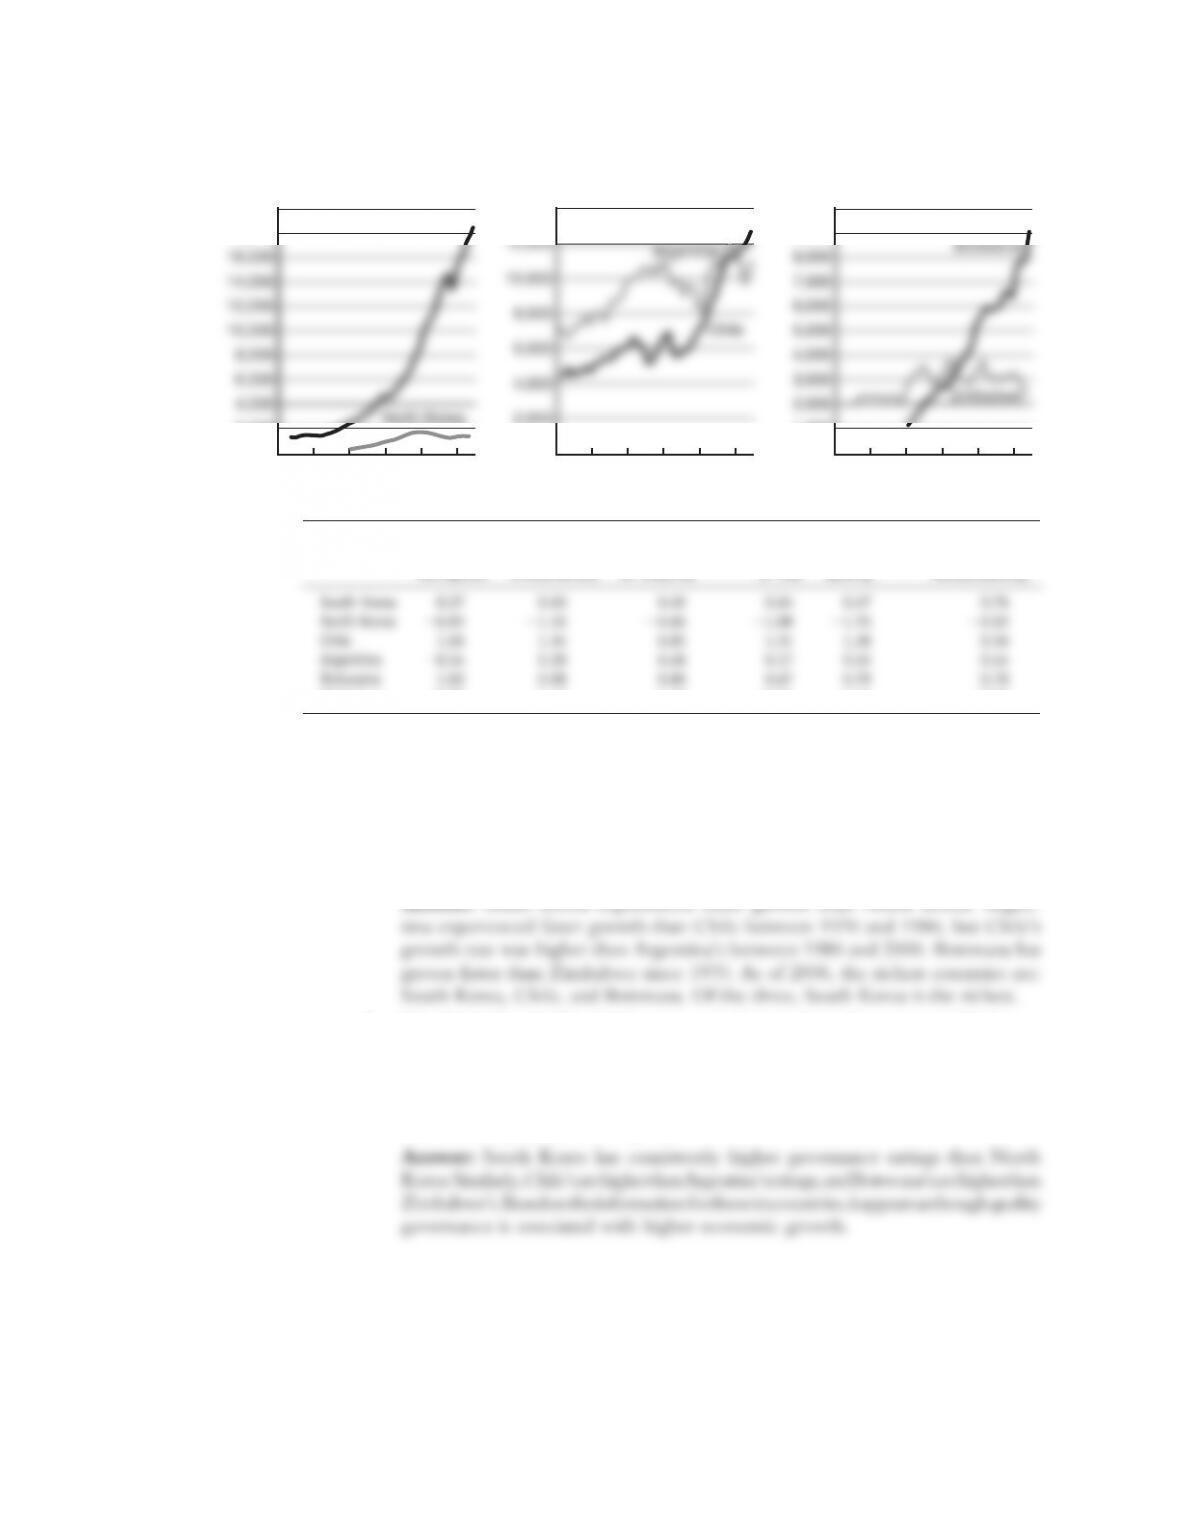
5. The charts on page 27 show the growth of real GDP per capita in three pairs of
geographically adjacent countries: North and South Korea, Argentina and Chile,
Zimbabwe and Botswana (using data from the Penn World Table).
a. Which country in each pair experienced faster growth in GDP per capita?
Which one is now richest?
b. The World Bank’s World Governance Indicators for each country in 2000 were
as shown in the table above (higher is better):
Based on these data, do you think institutions can explain the divergent out-
comes in these countries? Explain. Why do you think it helps to compare coun-
tries that are physically contiguous?