A-99
chapter
1 2 3 4 5
6 7 8 9 10
11 12 13 14 15
16 17 18
Policies for Economic
Stability
1. Suppose the neutral real interest rate is 3 percent in Country A and 1 percent in
Country B.
a. What might explain this difference? (Hint: See the Appendix at the end of Chap-
ter 12.)
ANSWER: The neutral interest rate rnis defined as the interest rate at which output
equals potential output. This interest rate is uniquely determined for a given AE curve.
Countries differ in their neutral interest rates because their potential output levels
b. If the central banks of the two countries choose the same inflation target, which
country is at greater risk of a liquidity trap? Explain.
ANSWER: A liquidity trap occurs when the nominal interest rate hits its lower bound
of zero. With the same inflation target and output at potential (neither a boom nor a
c. Should the two countries choose the same inflation target? Explain.
ANSWER: Based on the answer in part (b), Country B should consider choosing a
A-100 CHAPTER 15 Policies for Economic Stability
2. Suppose an economist has a bright idea: a central bank should lean against the
wind when output falls, but not when it rises. That is, policymakers should lower the
interest rate below the neutral level when a recession occurs but not raise it in a
boom.
a. Why might this plan appear attractive?
ANSWER: This plan appears attractive at first glance because it seems to reduce the
average rate of unemployment over time. The argument could be as follows: in times
b. Would it be wise for a central bank to adopt the plan? (Hint: Think about the
Phillips curve.)
ANSWER: The argument given in part (a) and thus the bright idea are flawed. The
economist has failed to consider that an economy in boom mode is also character-
ized by higher inflation, as shown by the Phillips curve. Once inflation increases, eco-
3. We have assumed that the coefficients in the Taylor rule, ayand aπ, are both pos-
itive. Under this assumption, the rule guides the economy back to long-run equilibrium
after a shock. The output gap Y
~eventually returns to zero and inflation returns to its
long-run level
π
T.
a. Suppose the inflation coefficient aπis positive but the output coefficient ayis still
zero. Does the economy still return to equilibrium with Y
~= 0 and
π
–
π
Tafter a
shock? Explain.
ANSWER: The Taylor rule is summarized by Equation (15.1): r= r+ ayY
~+ aπ(
π
–
π
T).
When the output coefficient is zero, then the adjusted Taylor rule reads: r= rn+ aπ
(
π
–
π
T). Assume that the economy starts out in long-run equilibrium with output at po-
What about the case of a supply shock? Assume that the economy is characterized
CHAPTER 15 Policies for Economic Stability A-101
b. How is the answer to the previous question different if ayis positive and aπis
zero? Explain.
ANSWER: When the inflation coefficient is zero, the adjusted Taylor rule reads:
r= rn+ ayY
~. Consider a positive expenditure shock that causes output to increase above
potential. This adjusted Taylor rule dictates that the central bank responds by increas-
4. Suppose the central bank measures the output gap accurately, but mismeasures
the neutral real interest rate. It believes the neutral rate is 1 percent, but the true neu-
tral rate is 3 percent. If the central bank follows a Taylor rule, how does its mistake
affect the interest rates it sets and the behavior of output and inflation? Explain.
ANSWER: When the economy is at potential output and inflation at its target level,
the central bank should set the real interest rate at its neutral level. By mismeasur-
5. In Figure 15.6, the central bank responds to an expenditure shock. Suppose poli-
cymakers know the true slope of the AE curve but mismeasure the shock: they think
the curve shifts to the right by 2Δ, twice the actual shift. How will the central bank ad-
just the interest rate if it wants to keep output at potential? What will really happen to
output? Explain.
ANSWER: Mismeasuring the magnitude of the positive expenditure shock is identi-
cal to mismeasuring the output gap. The central bank thinks that the positive output
6. Consider a variation on the Taylor rule: r= (0.25)rTAYLOR + (0.75)r(–1), where ris
the real interest rate in a quarter, rTAYLOR is the interest rate implied by the Taylor rule,
and r(–1) is the interest rate in the previous quarter. Call this rule TR-S.
a. Compare the behavior of the interest rate under TR-S to its behavior under the
basic Taylor rule. (Hint: What might “S” stand for?)
ANSWER: The addition of S may stand for either a more stable or a smoothed in-
terest rate. The interest rates rwill change by less compared to r(–1) when the cen-
b. Is TR-S a realistic description of central banks’ behavior? Why might they fol-
low such a rule rather than the basic Taylor rule?
ANSWER: Given the risk of mismeasurement of the output gap and the neutral real
interest rate, the central bank may use the basic Taylor rule to determine what it
7. Suppose the Fed had a policy of responding to asset-price bubbles. Under this
policy, it would have set higher interest rates than it actually did during the stock mar-
ket boom of the late 1990s and the housing bubble of the 2000s.
a. For the period 1990–2007, draw a graph showing roughly what interest rates
the Fed would have chosen under the antibubble policy. Compare this hypothet-
ical interest-rate path to the actual path of rates (see Figure 15.2).
ANSWER: Except for the period in 2001, when the stock market boom had ended
b. How would the antibubble policy have changed the behavior of output and in-
flation? Draw rough graphs comparing the likely paths of these variables to the
paths they actually followed. (See pp. 379–380 for a summary of the actual
paths.) In this part of the question, assume the antibubble policy was unsuc-
cessful: stock and house prices rose rapidly despite higher interest rates.
ANSWER: In general, the higher interest rates should have reduced output below
the levels that were actually observed (with the exception of the period in 2001). Even
c. Now suppose the hypothetical policy succeeded: it dampened the stock mar-
ket and housing bubbles. How does this change the answer to part (b)?
ANSWER: The higher real interest rate and the relative decline in wealth because of
A-102 CHAPTER 15 Policies for Economic Stability
ONLINE AND DATA QUESTIONS
www.worthpublishers.com/ball2
8. [Advanced] Suppose the economy is in long-run equilibrium in 2019. In 2020, a(n)
(temporary) adverse expenditure shock reduces output by 2 percent.
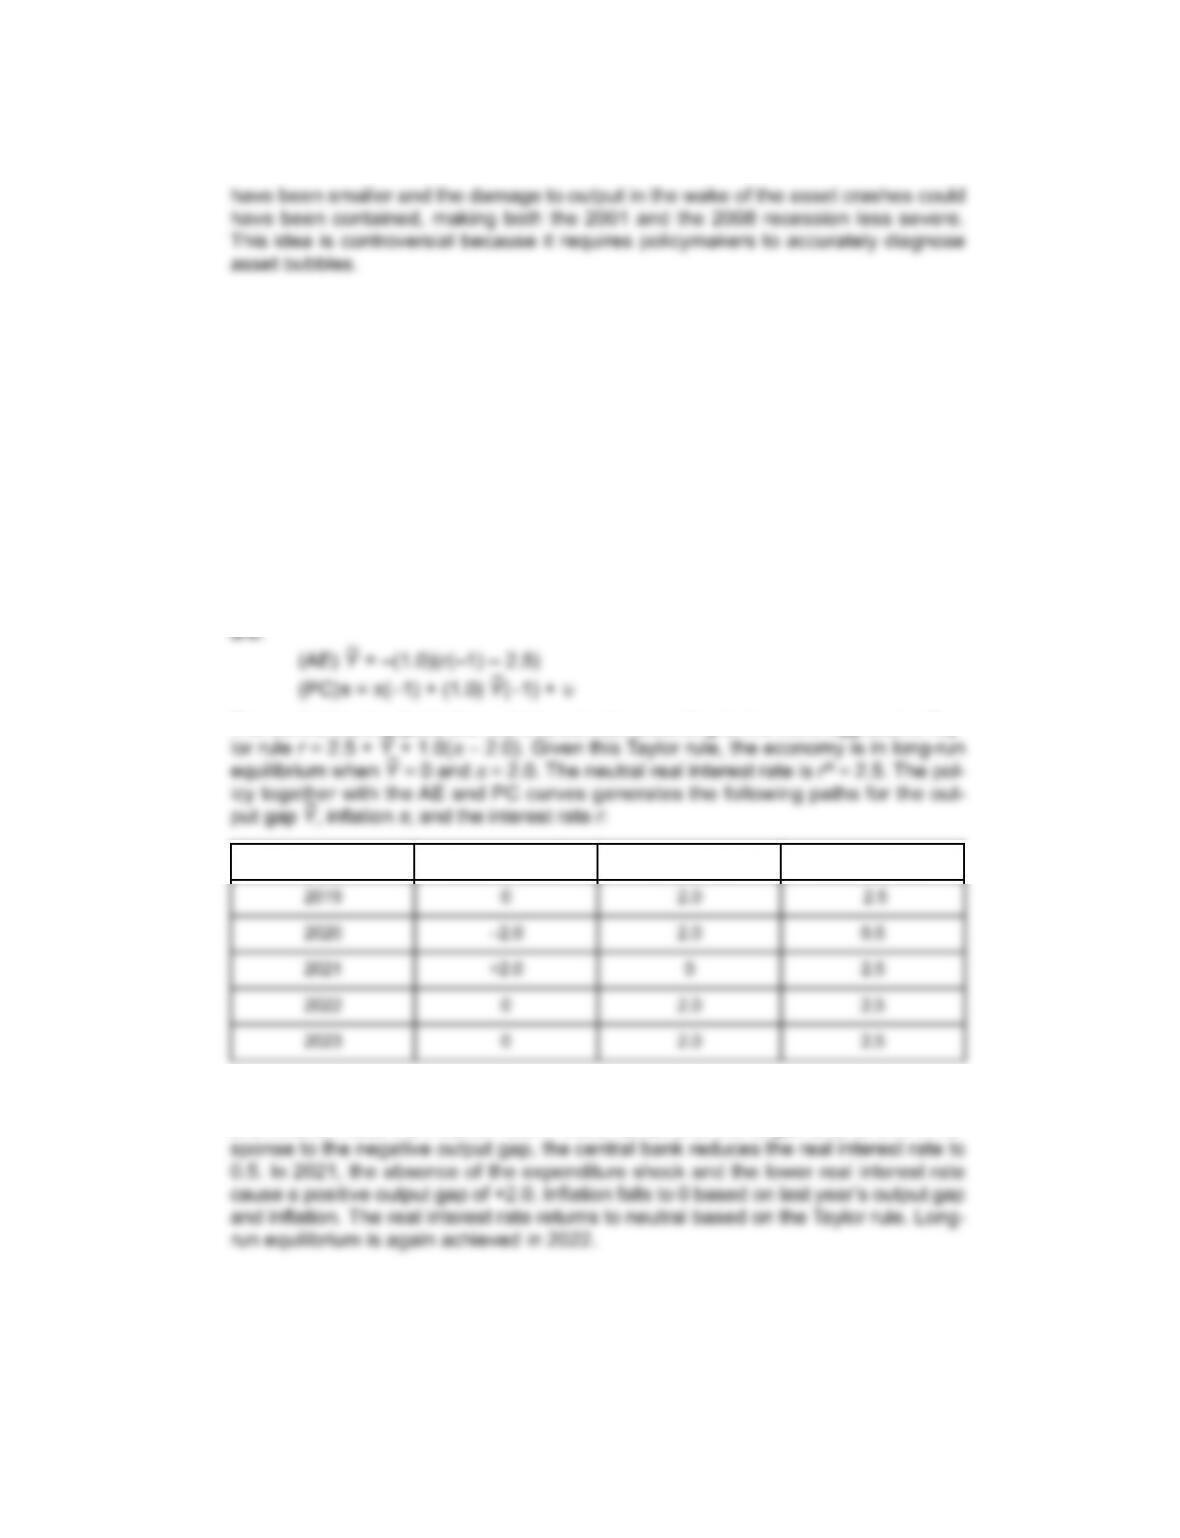
a. Assume the central bank uses TR-I in Table 15.2. Using the equations for the
AE and Phillips curves in the online appendix, derive the paths of output, inflation,
and the interest rate from 2020 until the economy is back in long-run equilibrium.
ANSWER: The equations for the AE and Phillips curves from the online appendix
are:
The central bank adjusts the real interest rate according to the more aggressive Tay-
~+ 1.0(
The temporary aggregate expenditure shock reduces output and causes the output
gap to fall to –2.0 percent in 2020. Since inflation depends on last year’s output gap
and inflation rate, the inflation rate in 2020 remains at the target level of 2.0. In re-
CHAPTER 15 Policies for Economic Stability A-103
Year Output Gap: Y
~Inflation:
π
Interest rate: r
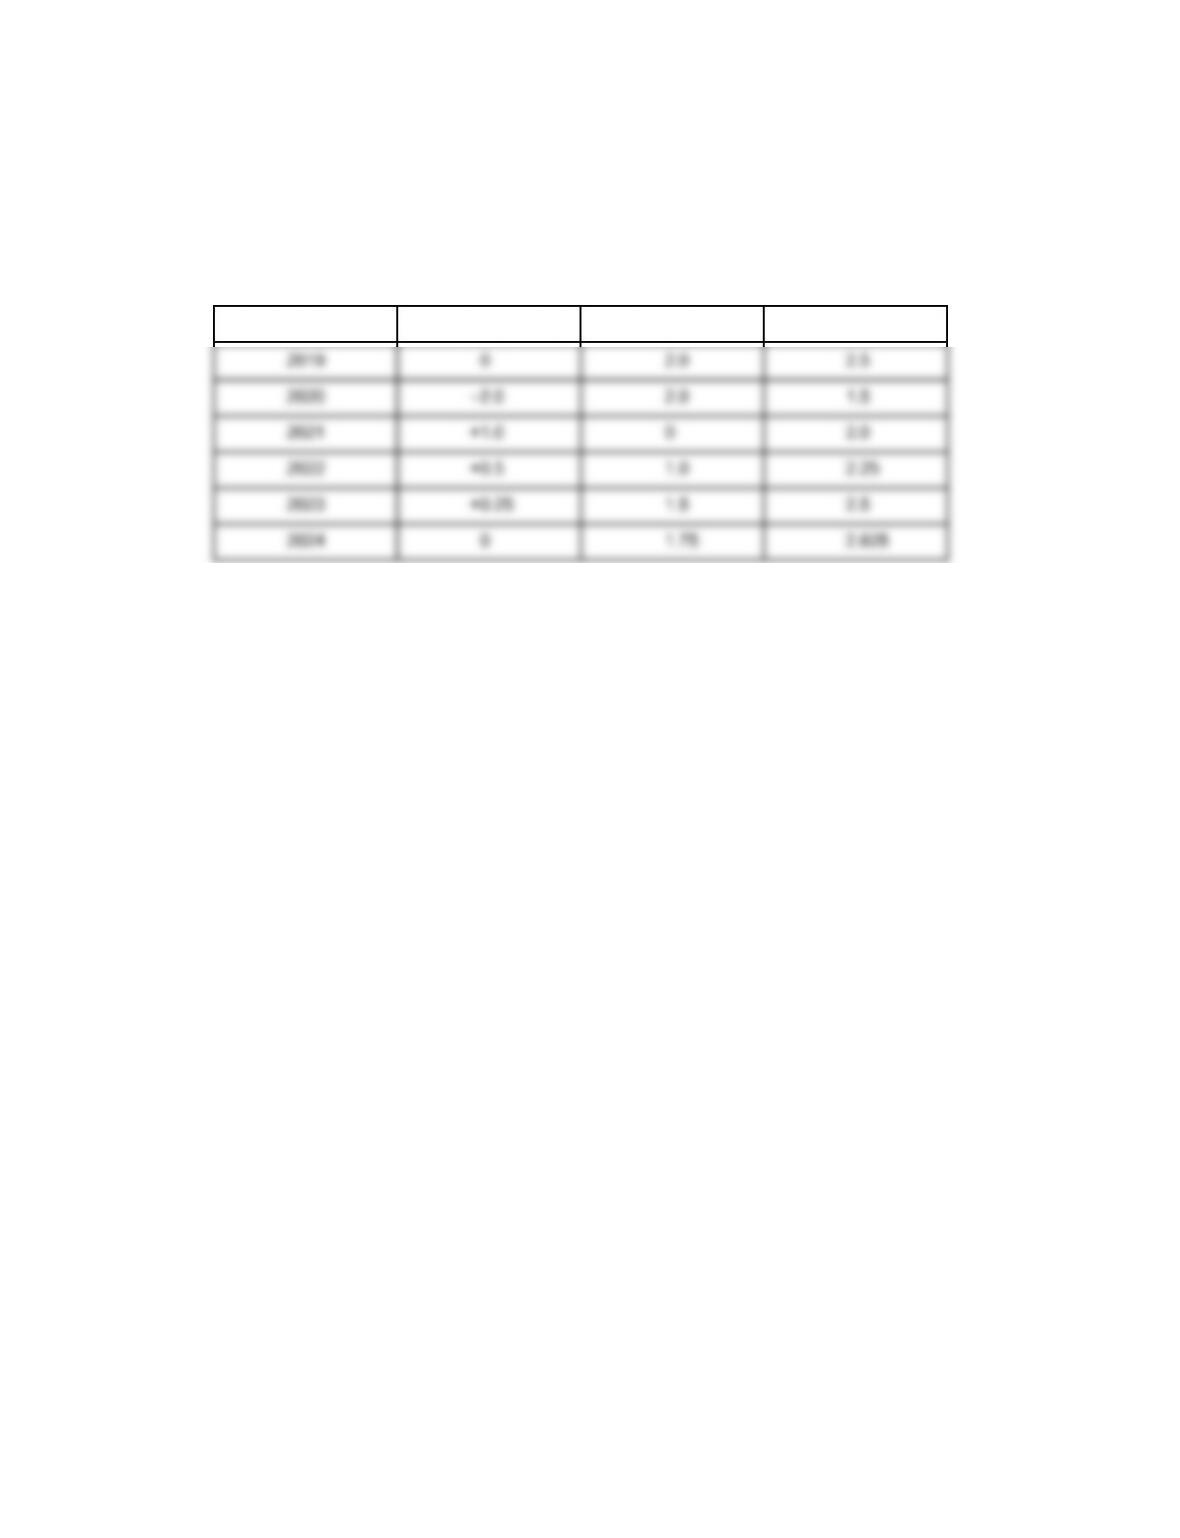
b. Redo the calculations in part (a) assuming TR-II. Which of the two rules is bet-
ter for stabilizing output? For stabilizing inflation? Explain.
ANSWER:
TR-II sets the real interest rate according to r= 2.5 + 0.5Y
~+ 0.5(π–2.0).
The less aggressive Taylor rule TR II will delay adjustment back to long-run equilib-
rium and will introduce slight fluctuations of output around potential output.
9. Link from the text Web site to the site of the Federal Reserve Board, which in-
cludes minutes from FOMC meetings. Choose any meeting at which the committee
changed its federal funds rate target.
a. Based on the minutes, briefly summarize the rationale for the target change.
b. Does the FOMC’s action appear consistent with the Taylor rule? Explain.
c. Did any members dissent from the committee’s decision? If so, why did they
dissent?
ANSWER: Answers will vary depending on the meeting selected.
A-104 CHAPTER 15 Policies for Economic Stability
Year Output Gap: Y
~Inflation: πInterest rate: r