Chapter 4
Profitability Analysis
4-16
4.24 Calculating and Interpreting Profitability Ratios (amounts in millions).
Royalty Expense/Sales:
$2,998/[0.5($200 + $207)] = 14.7
b. Hasbro’s ROA increased significantly between Year 2 and Year 3 and increased
slightly more between Year 3 and Year 4. The changes in ROA result from sim-
Chapter 4
Profitability Analysis
4-17
Cost of Goods Sold/Sales: The cost of goods sold to sales percentage increased
Advertising Expense/Sales: This expense also increased continually during the
Research and Development Expense/Sales: This expense declined sharply in
Royalty Expense/Sales: This expense declined during the three years, particu-
Other Selling and Administrative Expense/Sales: The fixed cost reduction
c. ROCE follows the same path as ROA, increasing significantly in Year 3 and in-
Chapter 4
Profitability Analysis
4-18
4.25 Calculating and Interpreting Profitability Ratios (amounts in millions).
a. Profit Margin for ROA:
[$216 + (1 – 0.35)($63)]/$2,021 = 12.7%
Assets Turnover:
Accounts Receivable Turnover:
$2,021/[0.5($7 + $26)] = 122.5
b. The ROA of Abercrombie & Fitch declined continually during the three-year
Chapter 4
Profitability Analysis
4-19
Fitch. The decreasing cost of goods sold to sales percentage coupled with the
43.1 (30,200/700) in fiscal Year 4, and 61.5 (48,500/788) in fiscal Year 5. One
explanation consistent with the change in the cost of goods sold to sales
percentage and the selling and administrative expense to sales percentage is that
the firm provides a higher service level to customers with more employees and
4.26 Analyzing the Profitability of a Service Firm. The ROA of Kelly Services
(Kelly) is very low to start with (around 2%), but it dipped to just above breakeven
in Year 3. A decline in the profit margin for ROA is the principal driver. An
Chapter 4
Profitability Analysis
4-20
profitable segment. The fixed asset turnover increased slightly between Year 2 and
4.27 Analyzing the Profitability of Two Hotels. Starwood realized either limited sales
growth or declining sales growth. In contrast, Choice realized double-digit sales
reflect a downward cycle in the travel and leisure industry. Nevertheless, both com-
panies have increased assets turnover during the three-year period. The large dis-
Chapter 4
Profitability Analysis
4-21
properties are owned by franchisees; hence, these assets do not appear on Choice’s
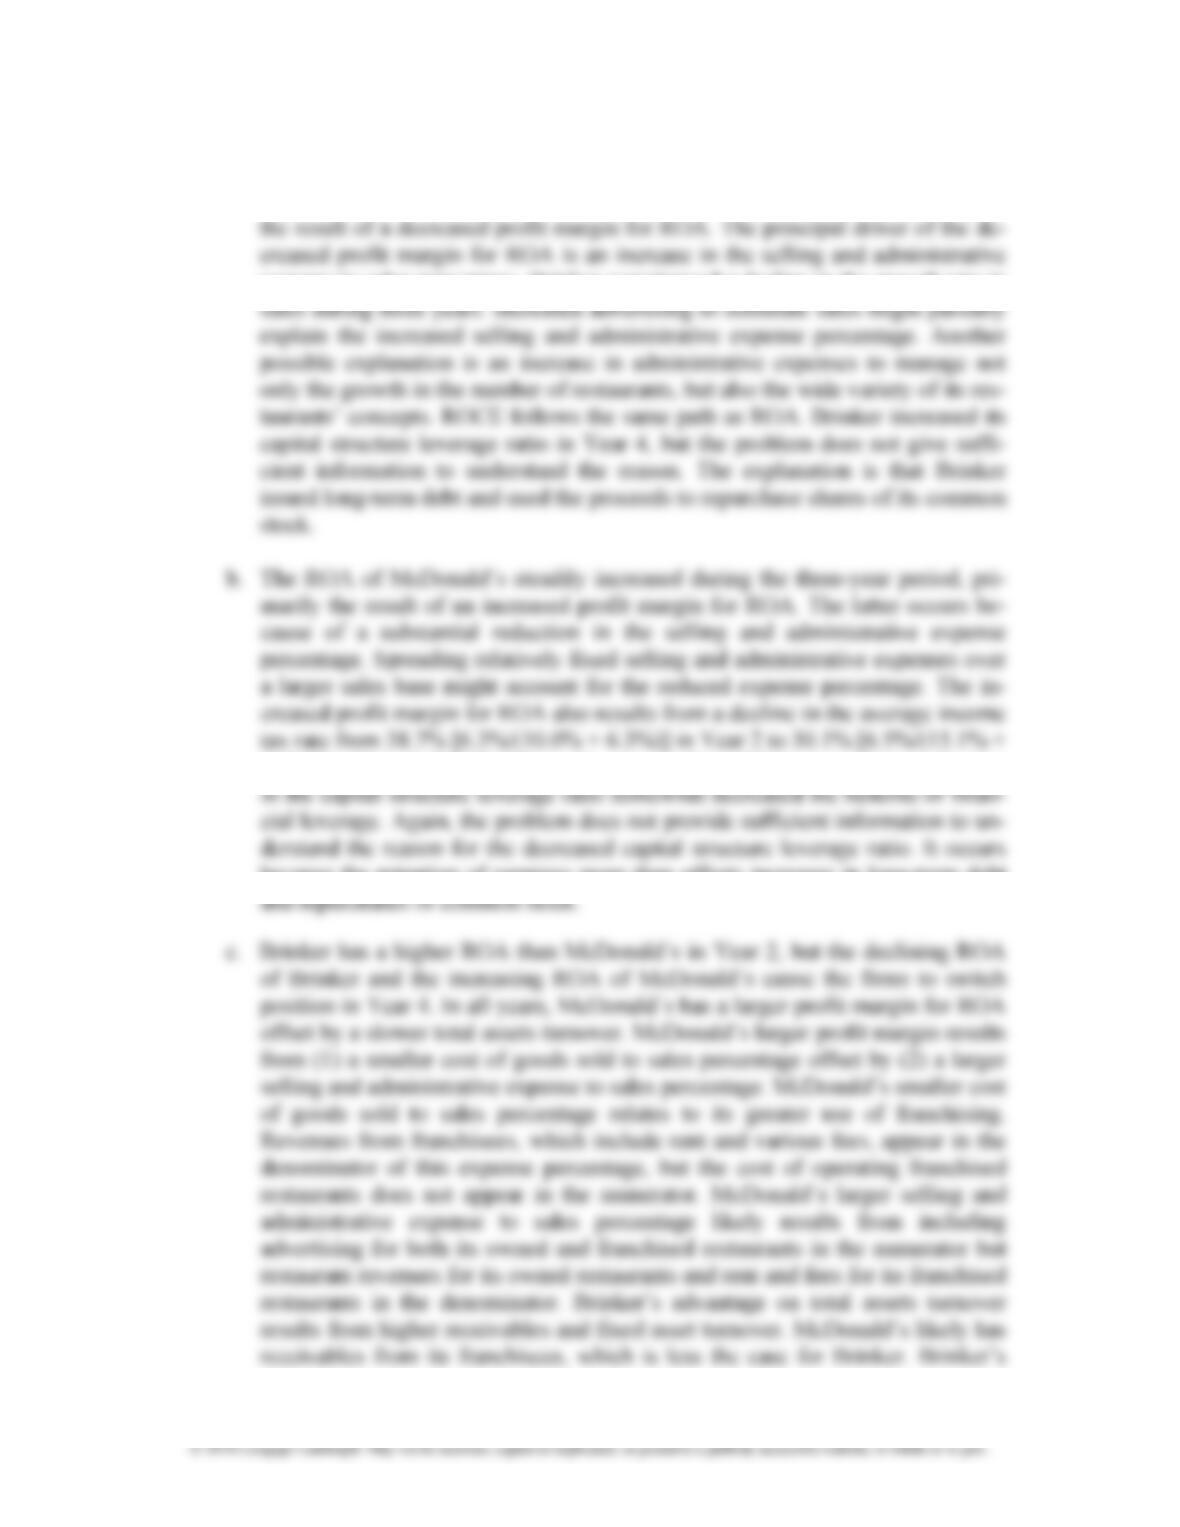
4.28 Analyzing the Profitability of Two Rental Car Companies.
Computed ratios are as follows:
Avis Budget
Group
Hertz Global
Holdings
2012 2012
The ROA of the two companies is very similar, just above 3.0%. ROA measures
the overall profitability of the company’s operations, regardless of financial
structure. Given the competitiveness of the rental car industry, it is not surpris-
Chapter 4
Profitability Analysis
4-22
4.29 Analyzing the Profitability of Two Restaurant Chains.
a. The ROA of Brinker steadily declined during the three-year period, primarily
expense to sales percentage. Brinker experienced a decline in the growth rate in
6.5%)] in Year 4. ROCE follows the same path as ROA except that a reduction
because the retention of earnings more than offsets increases in long-term debt
Chapter 4
Profitability Analysis
4-23
restaurants are larger and more costly than McDonald’s restaurants, but Brinker
Case 4.1: Profitability and Risk Analysis of Walmart Stores (Part A)
a. Return on Assets (ROA)
Studying the changes in ROA and its components, one is struck with the overall
2015 2014 2013
3.47%. Obviously, the increases in SG&A exceeded the decreases in COGS.
Cost of Goods Sold/Sales: The decreasing cost of goods sold to sales percentage
might be due to the following:
Chapter 4
Profitability Analysis
4-24
© 2018 Cengage Learning®. May not be scanned, copied or duplicated, or posted to a publicly accessible website, in whole or in part.
• The Walmart U.S. segment yields higher gross profit margins than
Walmart International or Sam’s Club segments. The largest growth in
number of stores is in the Walmart U.S. segment (as shown in Exhibit
4.43). Thus, there appears to be a shift in sales mix toward higher-margin
products through non-Sam’s Club stores. The sales mix figures in Exhibit
4.44 indicate a decrease in Walmart International sales as a percentage of
total sales.
• More favorable purchase prices are a result of Walmart’s increased size
and bargaining power with suppliers. Walmart credits worldwide sourcing
through its distribution centers as part of the reason for the decreased cost
of goods sold to sales percentage.
Operating, Selling, General, and Administrative Expense to Sales: The operat-
ing, selling, general, and administrative expense to sales percentage increased
Segment Data: Exhibit 4.44 indicates that the sales mix shifted away from Walmart
International toward Walmart Stores and Sam’s Clubs. The mix shift away from
Chapter 4
Profitability Analysis
4-25
Income Taxes: Income tax expense (excluding the tax effects of interest expense)
as a percentage of sales has dropped somewhat from 1.87% in 2013 to 1.55% in
Thus, the average income tax rate declined from 36.1% in 2013 to 34.4% in 2015.
Note, however, that this decrease is masked in common-size income statements
Total Assets Turnover: The total assets turnover increased slightly from 2.34 in
2013 to 2.38 in 2014 and 2.39 in 2015.
b. Return on Common Shareholders’ Equity (ROCE)
ROCE was stable between 2013 and 2014 at 21.00% and 20.76%, respectively, but
fell to 18.15% in 2015. This trend reflects the stable but slightly increasing total
Chapter 4
Profitability Analysis
4-26
c. Short-Term Liquidity Risk
Walmart’s short-term liquidity ratios suggest fluctuations but little change over the
d. Long-Term Solvency Risk
Walmart’s total liabilities to total assets ratio decreased slightly between 2013 and
Case 4.1: Profitability and Risk Analysis for Walmart Stores (Part B)
Target’s Higher Profit Margin for ROA: Target’s higher profit margin is con-
sistent with Target’s business model of providing higher brand-name products,
Other Revenues to Sales Percentage: Walmart receives membership fees in con-
Cost of Goods Sold to Sales Percentage: Walmart’s higher cost of goods sold as
1. Target places greater emphasis on selling trendy, brand-name products, which
Chapter 4
Profitability Analysis
4-27
© 2018 Cengage Learning®. May not be scanned, copied or duplicated, or posted to a publicly accessible website, in whole or in part.
favorable purchase terms from suppliers because of its size, it chooses to pass
along the purchase price advantage to customers by way of a lower price.
2. Target offers a more pleasant shopping experience, which should increase cus-
tomers’ willingness to pay higher prices.
3. Target has a smaller proportion of food products in the sales mix that are more
commodity-like in nature and, therefore, has a lower cost of goods sold to sales
percentage.
Selling and Administrative Expense Percentage: Target’s higher selling and
administrative expense to sales percentage likely results from three factors:
Walmart’s Higher Assets Turnover: Walmart’s higher asset turnover results
from higher asset turnovers for accounts receivable, inventories, and fixed assets.
Accounts Receivable Turnover: Walmart’s faster accounts receivable turnover
results from its business model where customers pay with cash or by credit card,
Chapter 4
Profitability Analysis
4-28
© 2018 Cengage Learning®. May not be scanned, copied or duplicated, or posted to a publicly accessible website, in whole or in part.
two companies are similar, so Walmart’s advantage on the fixed asset turnover is
in the numerator.
b. Walmart’s higher ROA over Carrefour results from higher profit margins for ROA
and a faster assets turnover. (Note: Variation in the value of the euro relative to the
Selling and Administrative Expense Percentage: Carrefour and Walmart exhibit
similar selling and administrative expense relative to sales. Additionally, both
Chapter 4
Profitability Analysis
4-29
Other Asset Turnover: Because Carrefour has lower total assets turnover com-
c. One would expect Walmart, with its higher ROA, to have a greater capacity to take
advantage of financial leverage. The higher ROA would likely provide it with a
d. Carrefour has the most short-term liquidity risk. Its current ratio is considerably
less than 1.0, and its cash flow from operations is much less than the 40% found

Chapter 4
Profitability Analysis