4-1
CHAPTER 4
PROFITABILITY ANALYSIS
Solutions to Questions, Exercises, Problems, and Teaching Notes to Cases
4.1 Common-Size Analysis. Restating income statement line items as a percentage of
sales and balance sheets as a percentage of total assets enables the analyst to com-
4.2 Earnings per Share. Firms can be identical in all respects but report different earn-
ings per share due simply to different decisions regarding the number of shares out-
4.3 Pro Forma Earnings. Twitter redefined earnings to exclude stock-based compensa-
tion expense ($25.7 million), depreciation and amortization expense ($72.5 million),
Chapter 4
Profitability Analysis
4-2
4.4 Profit Margin for ROA versus ROCE. The profit margin for ROA excludes
subtractions for the cost of debt and equity financing, whereas the profit margin for
4.5 Concept and Measurement of Financial Leverage. Financial leverage involves
using assets financed with debt and preferred equity and earning a higher return on
those assets (that is, ROA) than the cost of these sources of capital. The excess of
4.6 Advantages of Financial Leverage. For financial leverage to work effectively,
ROA must exceed the after-tax cost of debt and preferred stock financing. One in-
4.7 Disadvantages of Financial Leverage. The cost of borrowing increases as a firm
becomes more levered. Thus, although a firm’s ROA may exceed its cost of
Chapter 4
Profitability Analysis
4-3
© 2018 Cengage Learning®. May not be scanned, copied or duplicated, or posted to a publicly accessible website, in whole or in part.
with current levels. First, there are typically lags between securing financing,
deploying assets, getting operations up and running, and realizing returns from
investments. In the meantime, firms are saddled with costs of borrowing. Second,
there are diminishing returns to scale. Many growth firms that generate high ROA
tend to overinvest, only to realize that there are limits to their ability to scale up
operations. For example, a restaurant may find that additional restaurants merely
cannibalize sales from nearby restaurants rather than satisfy unlimited demand.
4.8 Concept of Residual Income. Residual income can be viewed as income after
inserting an additional line item on the income statement for the cost of equity capi-
4.9 Return on Common Shareholders’ Equity versus Basic Earnings per Common
Share. The statement is correct that both ROCE and basic earnings per share use
Chapter 4
Profitability Analysis
4-4
4.10 Calculating ROA and Its Components (amounts in millions).
4.11 Calculating ROCE and Its Components (amounts in thousands).
Return on Common Shareholders’ Equity:
4.12 Calculating Basic and Diluted EPS (amounts in thousands).
4.13 Relating ROA and ROCE (amounts in millions).
a. Return on Assets: [$1,062 + (1 – 0.35)($64)]/$6,934.5 = 15.9%
4-5
4.14 Relating ROA and ROCE (amounts in millions).
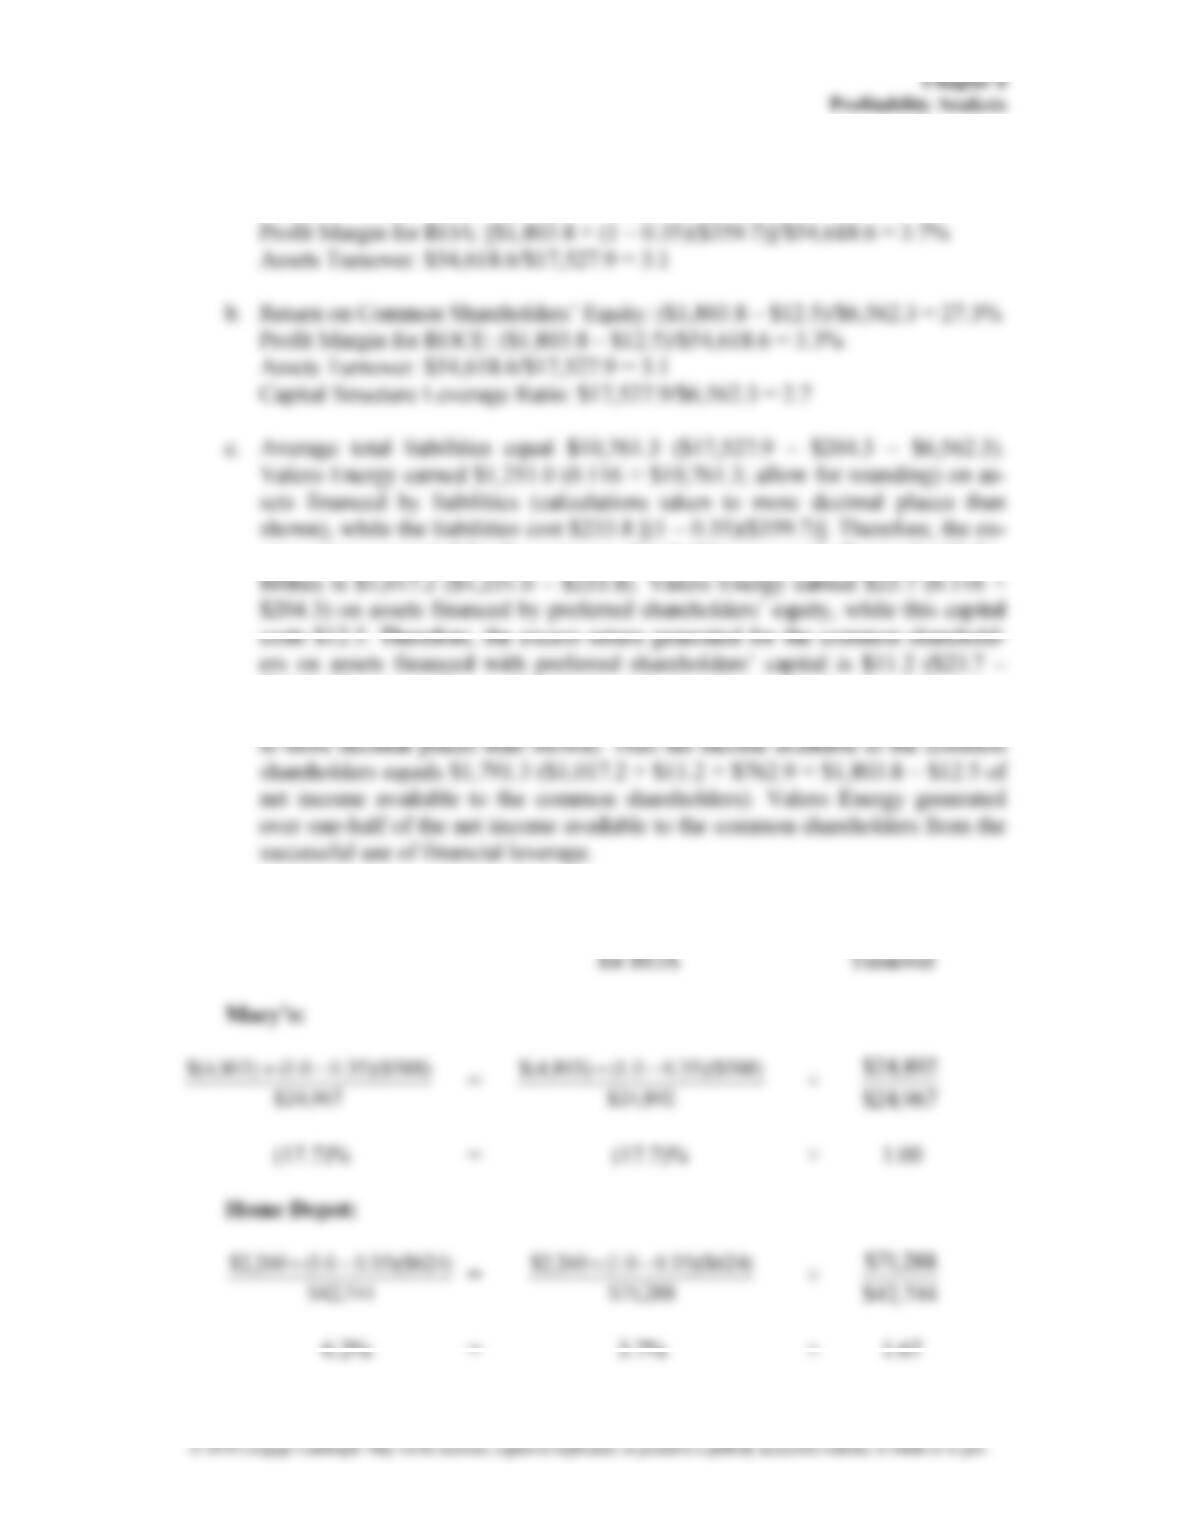
a. Return on Assets: [$1,803.8 + (1 – 0.35)($359.7)]/$17,527.9 = 11.6%
cess return generated for the common shareholders on assets financed with lia-
$12.5). The assets financed by common shareholders’ capital generated a return
for the common shareholders of $762.9 (0.116 × $6,562.3) (calculations taken
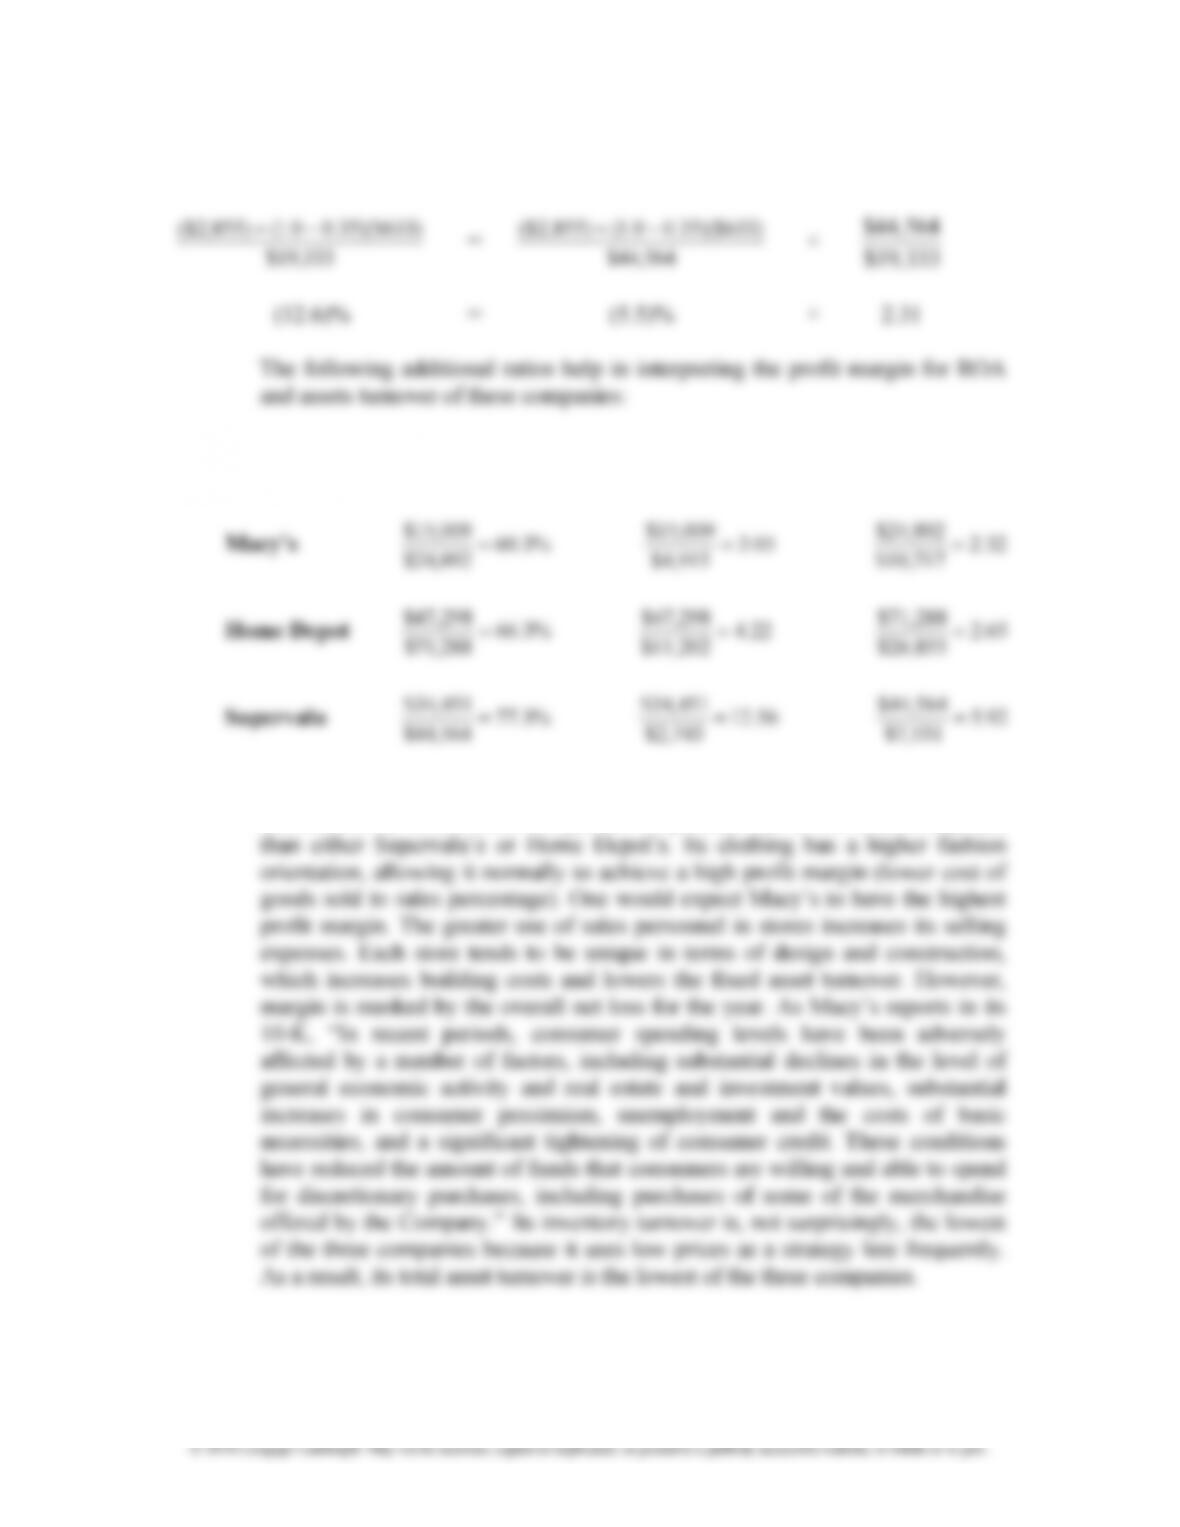
4.15 Analyzing Operating Profitability (amounts in millions).
a. Return on Assets = Profit Margin × Assets
Chapter 4
Profitability Analysis
4-6
Supervalu:
Cost of Goods Sold Inventory Fixed Asset
÷ Sales Turnover Turnover
Supervalu 92.5
$7,531
56.12
$2,743
%3.77
564,44$
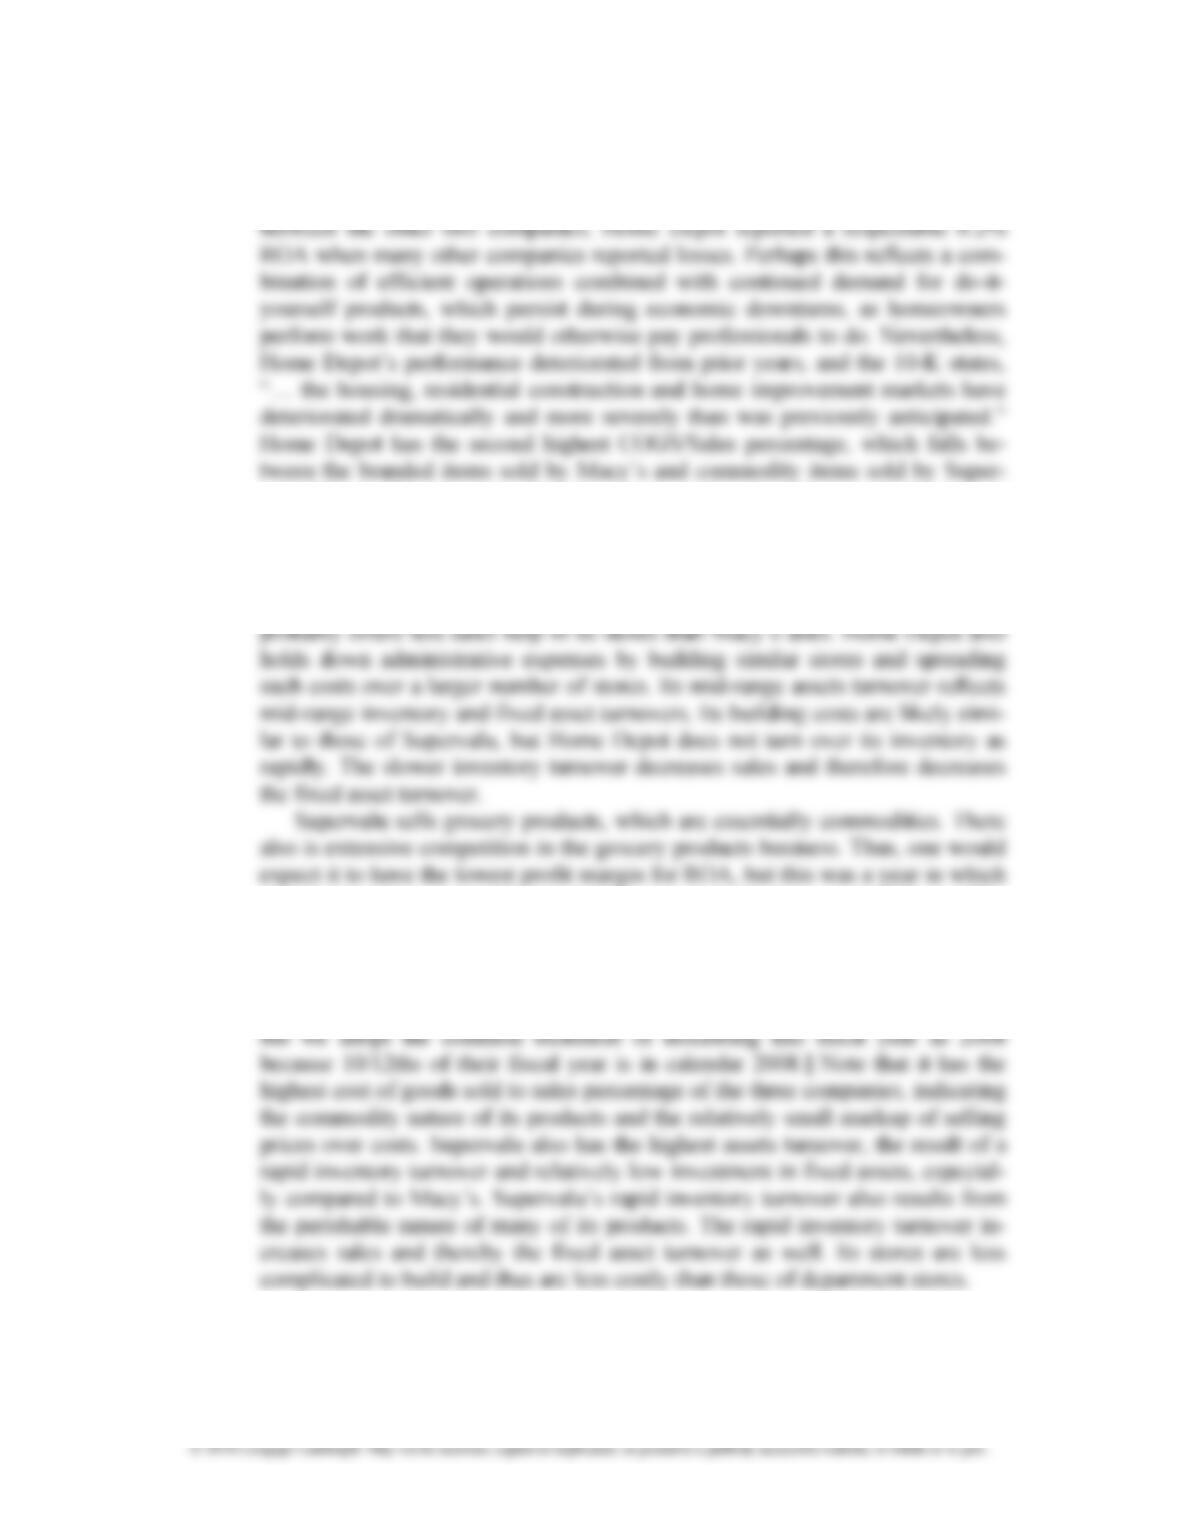
b. Macy’s performed poorly, reporting a large net loss. It also has the slowest
assets turnover of the three companies. Its product line is less commodity-like
Chapter 4
Profitability Analysis
4-7
Home Depot was the only profitable company, so it is the only company
showing a positive profit margin for ROA. Combined with total assets turnover
valu. Home Depot’s overall asset turnover also lies between Macy’s and
Supervalu, but individual asset turnover ratios lie closer to Macy’s than to
Supervalu, which is not surprising given Home Depot’s inventory of non-
perishable products. Overall, Home Depot’s profitability likely resulted from
lower selling and administrative expenses as a percentage of sales. Home Depot
many companies reported losses, and the grocery industry was no different. The
10-K reports, “The unprecedented decline in the economy and credit market
turmoil during fiscal 2009 combined with high food inflation and energy costs
negatively impacted consumer confidence and spending.” [Supervalu’s fiscal
year ended February 28, 2009, which management refers to as their 2009 year,
Chapter 4
Profitability Analysis
4-8
4.16 Calculating and Interpreting Accounts Receivable Turnover Ratios (amounts
in millions).
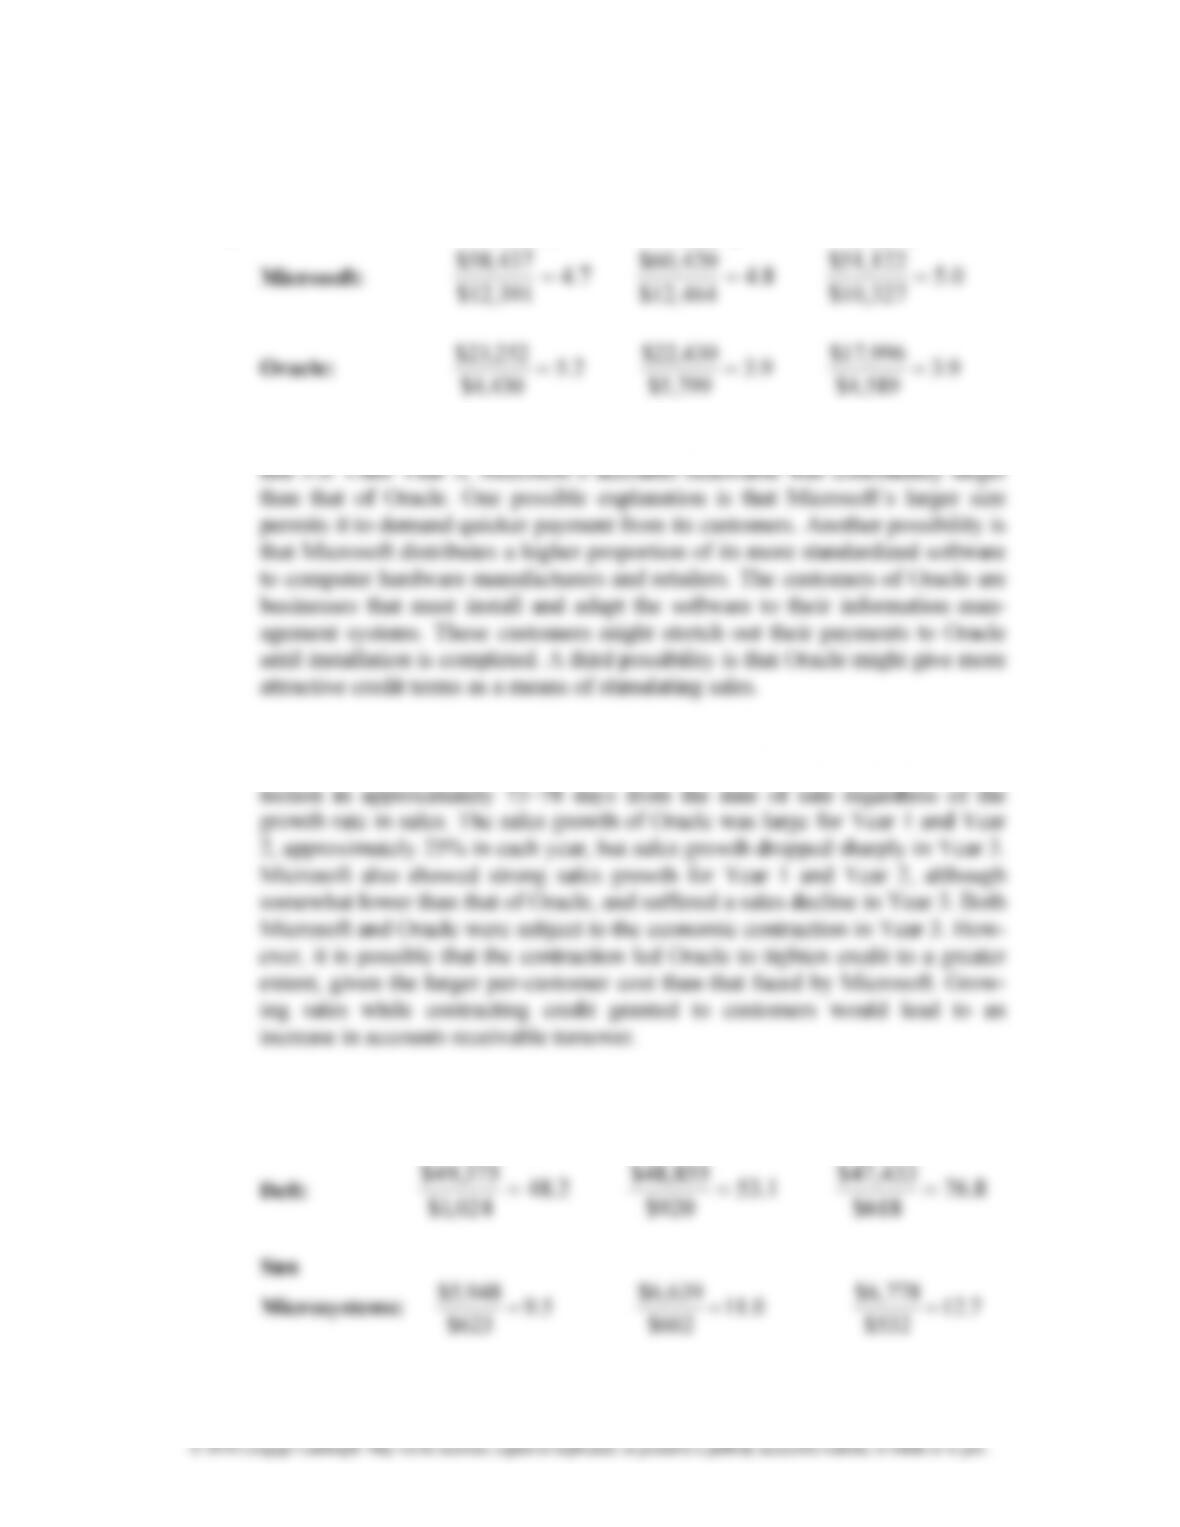
a. Year 3 Year 2 Year 1
$51,122
$60,420
437,58$ ===
Oracle: 9.3
$4,589
9.3
$5,799
2.5
430,4$
b. The accounts receivable turnover of Microsoft is steady, ranging between 4.8
c. The accounts receivable turnover of Microsoft was relatively steady during the
three years. Microsoft appears to manage its accounts receivable well, with col-
4.17 Calculating and Interpreting Inventory Turnover Ratios (amounts in millions).
a. Year 3 Year 2 Year 1
$47,433
$48,855
375,49$ ===
$623
$602
$532
Chapter 4
Profitability Analysis
4-9
b. The faster inventory turnover ratio for Dell reflects its made-to-order business
c. In contrast to rapid growth experienced in the past, sales growth at Dell has
been in the low single digits over the last three years and has been slowing. Sun
provider).
4.18 Calculating and Interpreting Accounts Receivable and Inventory Turnover
Ratios (amounts in millions).
a. Year 2 Year 1
$16,593
$23,663 ==
AK Steel: 10.2
$686
13.4
$572
b. The faster accounts receivable turnover for Nucor reflects its sales to steel ser-
c. The accounts receivable turnover of both Nucor and AK Steel increased across
Chapter 4
Profitability Analysis
4-10
d. Year 1 Year 2
$13,035
$19,612 ==
e. Nucor had higher inventory turnover than AK Steel in Year 1, but lower inven-
tive inventory turnovers.
f. The inventory turnover of AK Steel increased significantly between Year 1 and
Year 2 as a result of a moderate increase in sales coupled with a decline in in-
4.19 Calculating and Interpreting Fixed Assets Turnover Ratios (amounts in millions).
a. Year 3 Year 2 Year 1
$14,255
$13,835
501,12$ ===
Hewlett-Packard: 2.14
$7,331
7.12
$9,318
4.10
050,11$
Chapter 4
Profitability Analysis
4-11
b. The fixed asset turnovers of HP exceed those of TI for each year. One reason is
c. The fixed asset turnover of TI remained relatively stable between Year 1 and
4.20 Calculating and Interpreting the Return on Common Shareholders’ Equity
and Its Components.
a. Return on Assets
Year 3: [$405 + (0.65)($245)]/[0.5($18,048 + $17,787)] = 3.1%
Chapter 4
Profitability Analysis
4-12
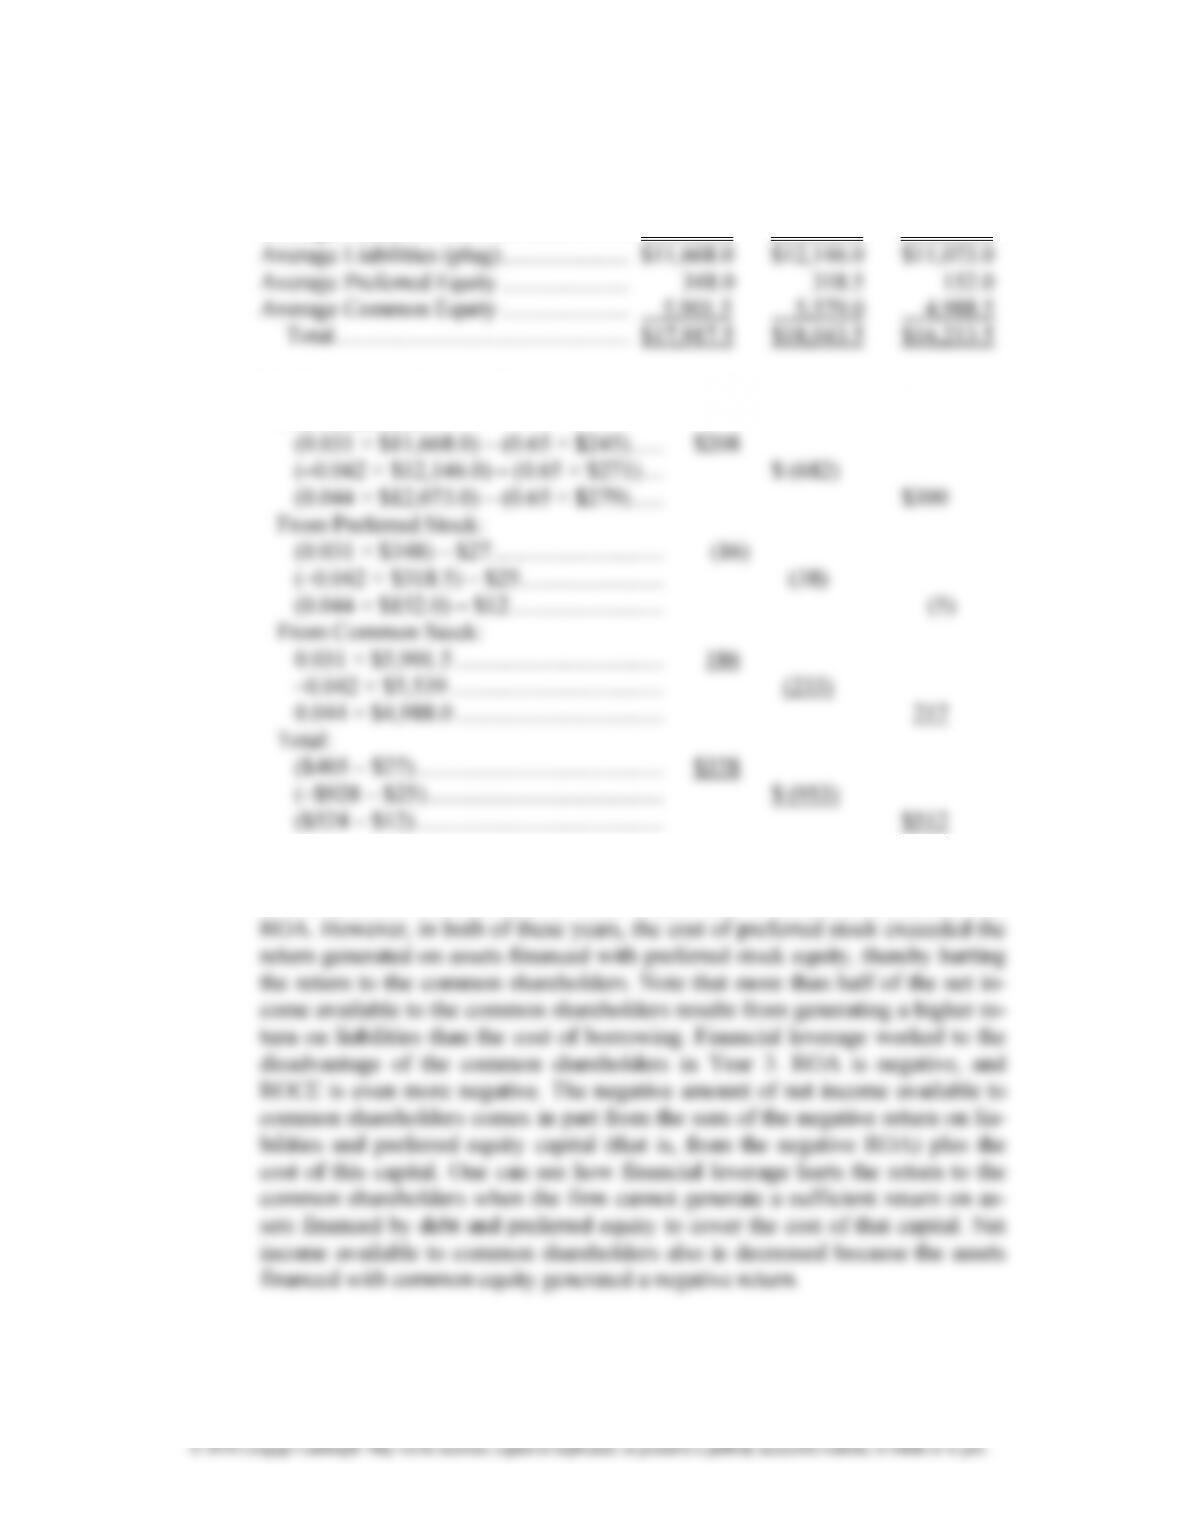
b. Return on Common Shareholders’ Equity
Year 3: ($405 – $27)/[0.5($5,766 + $6,037)] = 6.4%
Capital Structure Leverage
c. JCPenney (Penney) operated at a net loss in Year 4. The problem does not
net loss, which reduces retained earnings and shareholders’ equity. The increase
between Year 4 and Year 5 likely resulted from the net effect of a reduction in
debt from selling Eckerd Drugs and the stock buyback with the proceeds of the
sale.
d. Ratio of ROCE/ROA
Chapter 4
Profitability Analysis
4-13
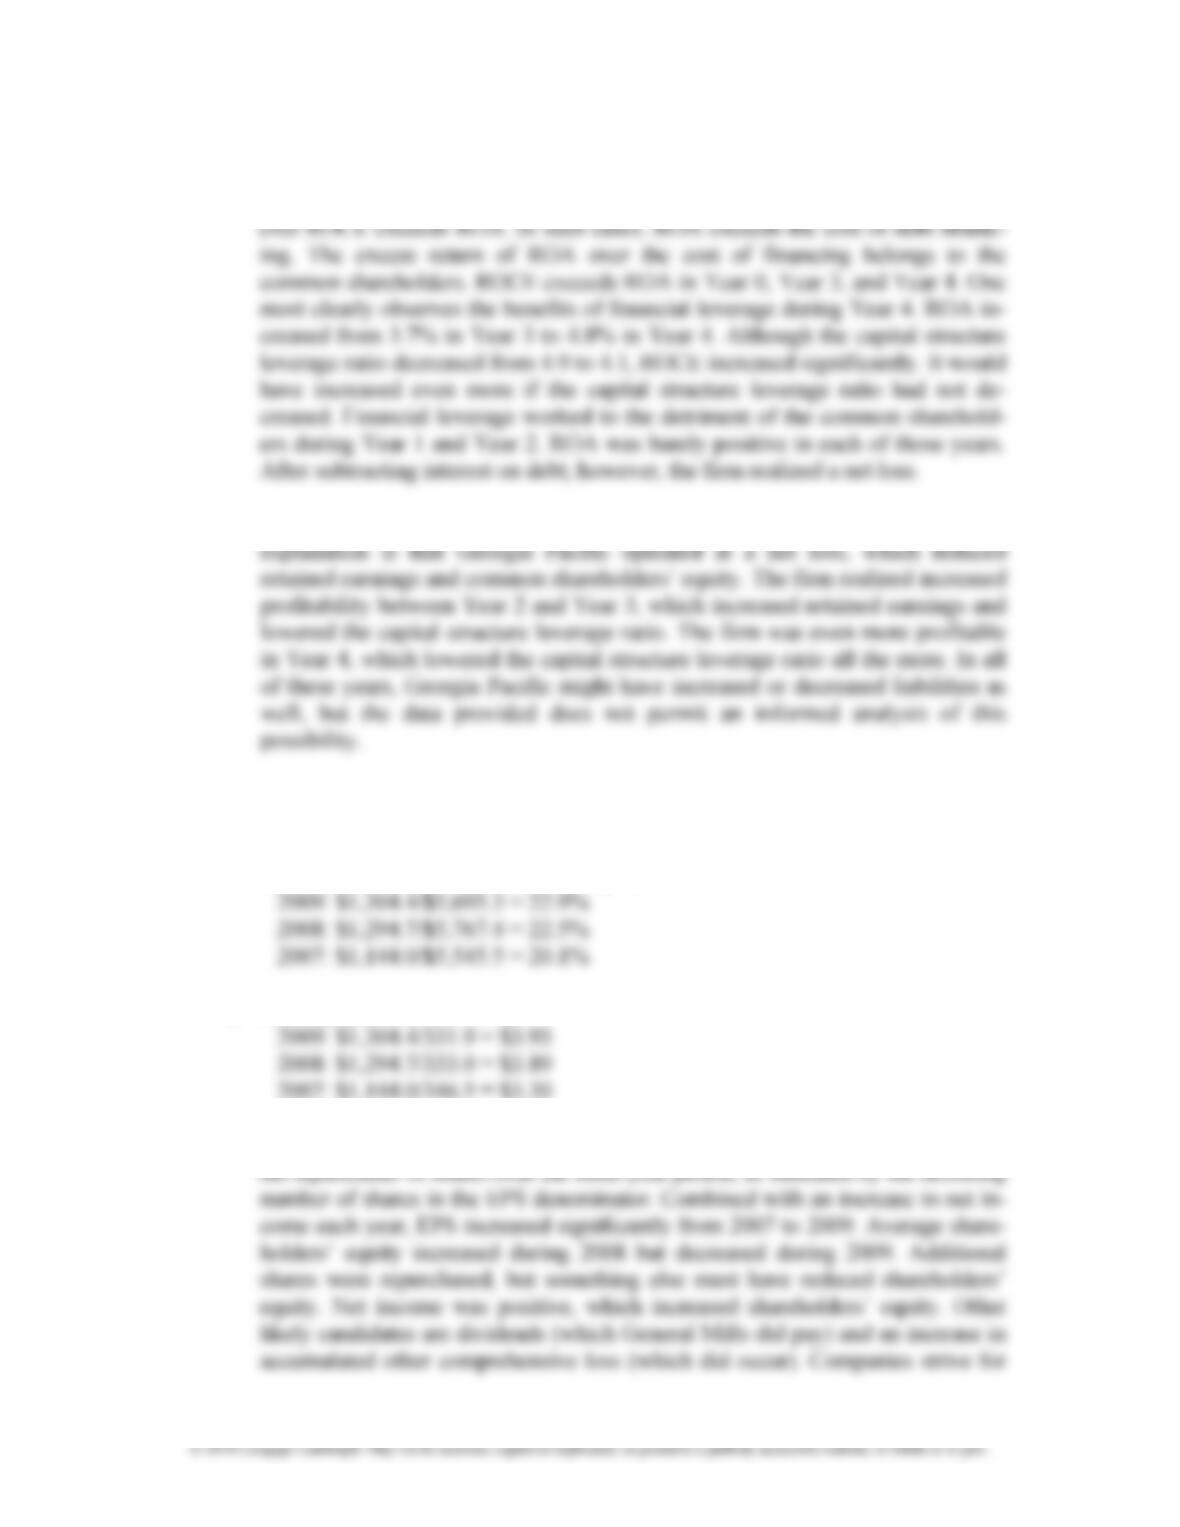
e. Year 2 Year 3 Year 4
Average Assets ……………………………….. $17,917.5 $18,043.5 $16,213.5
Net Income Available to Common:
From Liabilities:
f. Considering all sources of financing, financial leverage worked to the advantage
of the common shareholders in Year 2 and Year 4 because ROCE exceeds
Chapter 4
Profitability Analysis
4-14
4.21 Interpreting the Return on Common Shareholders’ Equity and Its Components.
a. Financial leverage works to the advantage of the common shareholders when-
b. The capital structure leverage ratio increased in Year 1 and Year 2. The likely
4.22 Calculating and Interpreting the Return on Common Shareholders’ Equity
and Earnings per Common Share (amounts in millions).
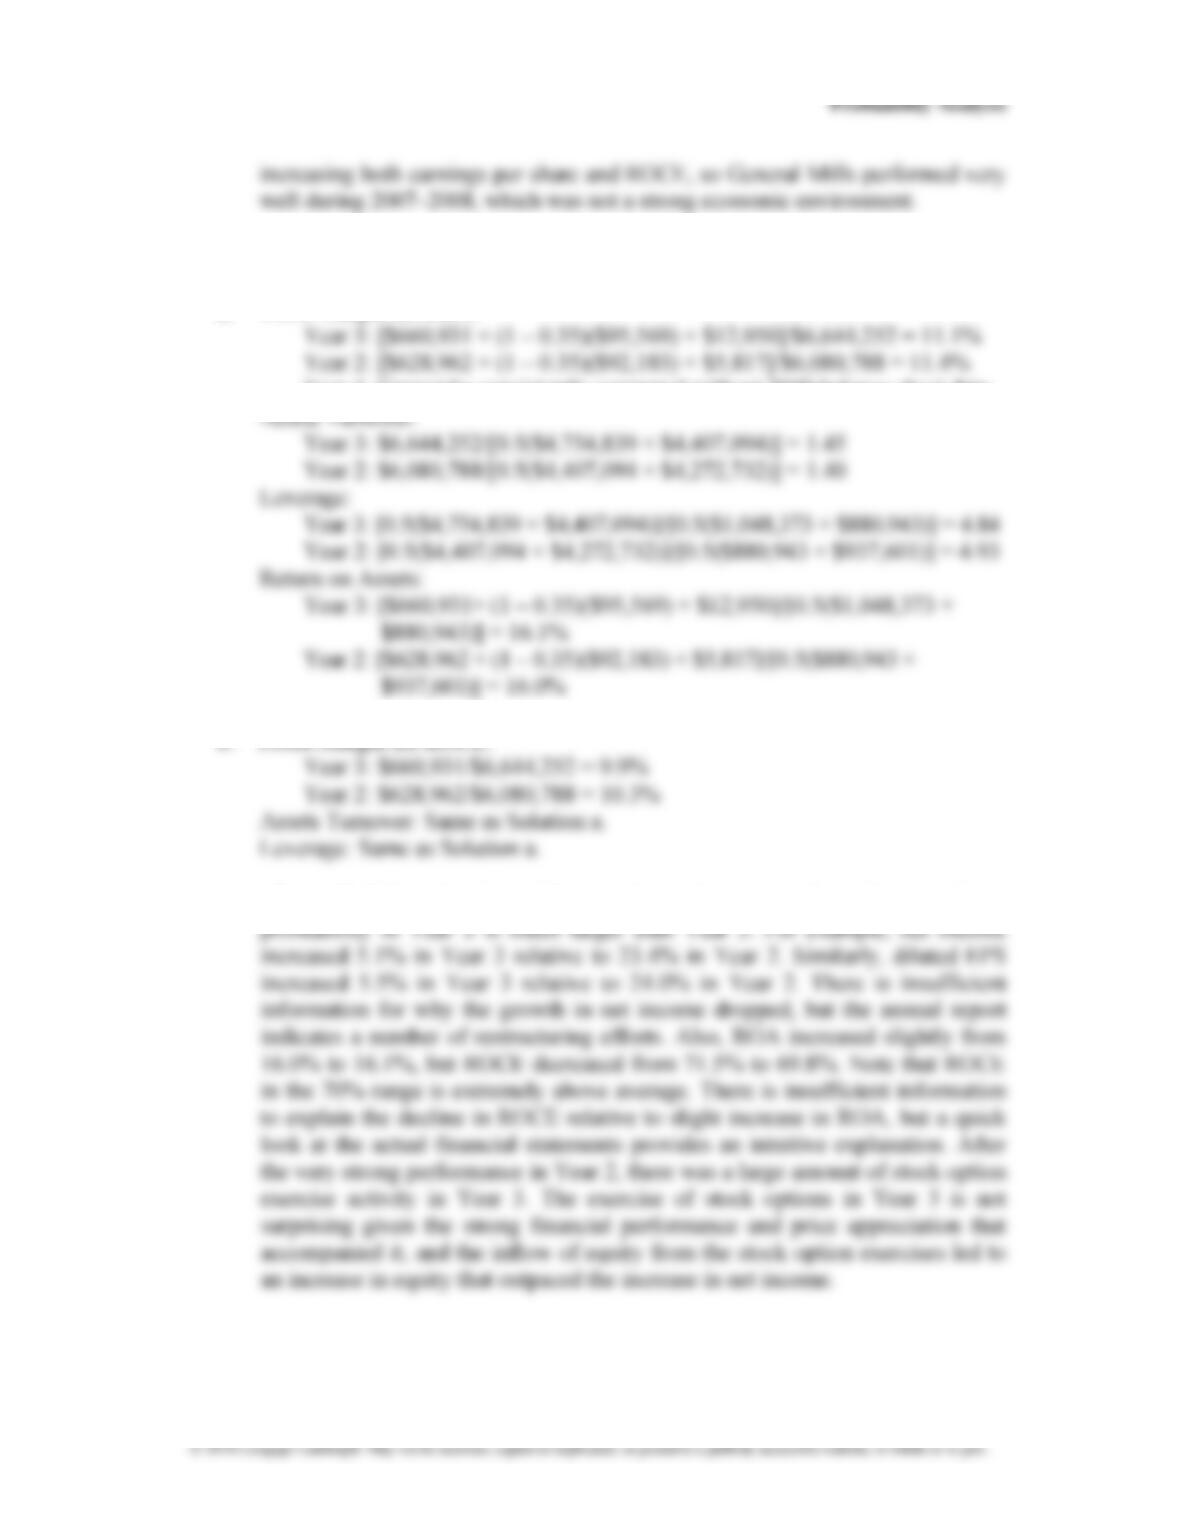
a. Return on Common Shareholders’ Equity
b. Earnings per Common Share
c. Both ROCE and EPS increased during the three-year period. General Mills was a
Chapter 4
4-15
© 2018 Cengage Learning®. May not be scanned, copied or duplicated, or posted to a publicly accessible website, in whole or in part.
increasing both earnings per share and ROCE, so General Mills performed very
well during 2007–2008, which was not a strong economic environment.
4.23 Interpreting Several Measures of Profitability (amounts in millions).
a. Profit Margin for ROA:
Year 1: Cannot be consistently computed without 2009 balance sheet data.
b. Profit Margin for ROCE:
c. All profitability signals exhibit an increasing trend, but the growth in