3-1
CHAPTER 3
INCOME FLOWS VERSUS CASH FLOWS:
UNDERSTANDING THE STATEMENT OF CASH FLOWS
Solutions to Questions, Exercises, Problems, and Teaching Notes to Cases
3.1 Need for a Statement of Cash Flows. The amount of revenue recognized equals
the amount of cash the firm expects to collect from customers. However, the firm
does not necessarily recognize the revenue at the time it receives the cash. It typi-
3.2 Requirement for Managers to Provide a Statement of Cash Flows. You can
always approximate a statement of cash flows given a balance sheet and income
Chapter 3
Income Flows versus Cash Flows:
Understanding the Statement of Cash Flows
3-2
3.3 Structure of the Statement of Cash Flows. The statement of cash flows reconciles
3.4 Articulation of the Statement of Cash Flows with Other Financial Statements.
The statement of cash flows begins with net income (for firms using the indirect
3.5 Classification of Interest Expense. For many users, the explanation for why inter-
3.6 Classification of Cash Flows Related to the Cost of Financing. As in Question
3.5, many users disagree with the classification of interest expense as an operating
Chapter 3
Income Flows versus Cash Flows:
Understanding the Statement of Cash Flows
3-3
© 2018 Cengage Learning®. May not be scanned, copied or duplicated, or posted to a publicly accessible website, in whole or in part.
but dividends are a distribution of earnings, not an expense. The overarching rule in
U.S. GAAP seems to be that “if it’s in the income statement, it is operating.” How-
ever, IFRS permits companies to classify costs of financing as operating or financ-
ing so long as the treatment is consistently followed.
3.7 Classification of Changes in Short-Term Financing. Firms generally use ac-
counts payable directly in financing purchases of inventory and other operating
3.8 Classification of Cash Flows Related to Share-Based Compensation. This is a
very complex topic, as it relates to an intersection of two very complex topics—tax
3.9 Treatment of Noncash Exchanges. This is an investing and financing transaction
whose disclosure helps the statement user understand why property, plant, and
Chapter 3
Income Flows versus Cash Flows:
Understanding the Statement of Cash Flows
3-4
© 2018 Cengage Learning®. May not be scanned, copied or duplicated, or posted to a publicly accessible website, in whole or in part.
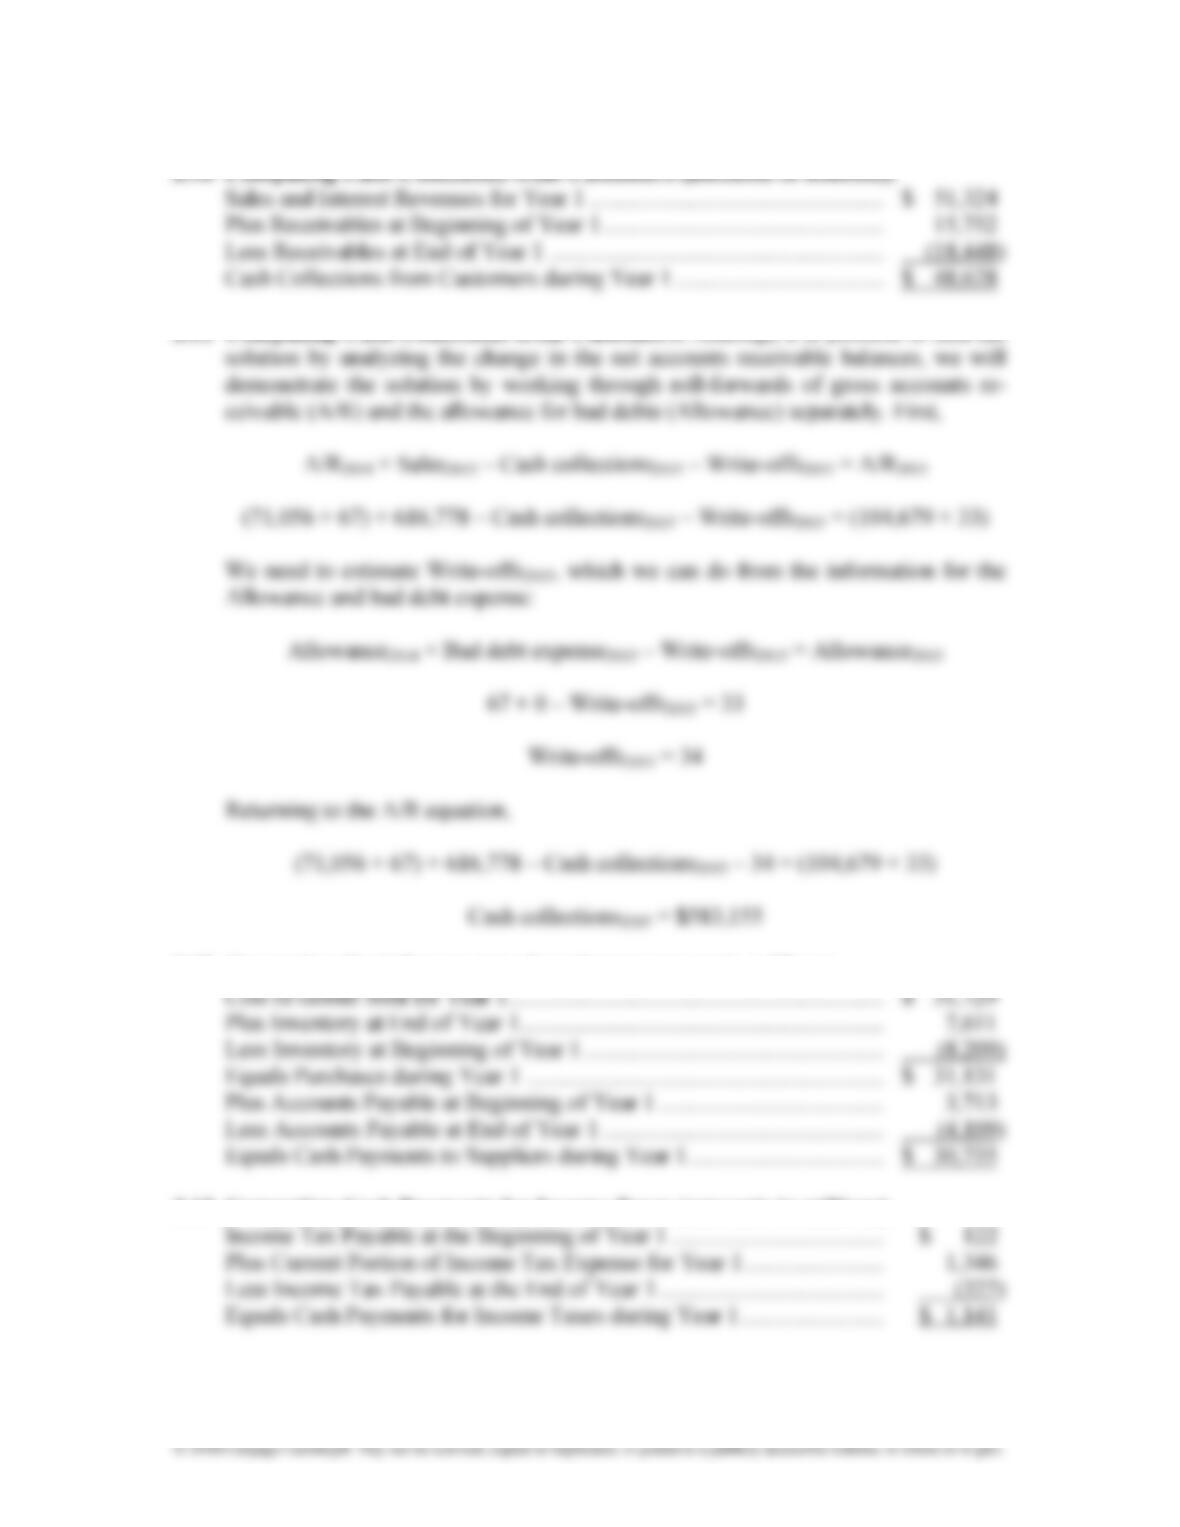
3.10 Computing Cash Collections from Customers (amounts in millions).
Sales and Interest Revenues for Year 1 …………………………………………… $ 51,324
Plus Receivables at Beginning of Year 1 …………………………………………. 15,752
Less Receivables at End of Year 1 …………………………………………………. (18,448)
Cash Collections from Customers during Year 1 ……………………………… $ 48,628
3.11 Computing Cash Collections from Customers. Although it is possible to find the
3.12 Computing Cash Payments to Suppliers (amounts in millions).
3.13 Computing Cash Payments for Income Taxes (amounts in millions).
Chapter 3
Income Flows versus Cash Flows:
Understanding the Statement of Cash Flows
3-5
© 2018 Cengage Learning®. May not be scanned, copied or duplicated, or posted to a publicly accessible website, in whole or in part.
Note that the deferred portion of income tax expense relates to various deferred in-
come tax accounts, not to Income Tax Payable. Also note that computations such as
this one are approximations (due to acquisitions, divestitures, and other miscella-
neous events that affect the ability to reconcile balance sheet changes with informa-
tion on the statement of cash flows). Cash paid for income taxes is a required
disclosure. Many firms include this (as well as cash paid for interest) as a supple-
mental disclosure at the bottom of the statement of cash flows; however, many
firms include the amount of cash paid for income taxes in the income taxes footnote
or another footnote that reports supplemental information. Visa reports cash paid
for income taxes at the bottom of the statement of cash flows, under the heading
“Supplemental Disclosure of Cash Flow Information,” which shows $1,172 million
for “Income taxes paid, net of refunds,” which differs from the amount approx-
imated with the above calculation by $31 million.
3.14 Interpreting the Relation between Net Income and Cash Flow from Opera-
tions. Firm A is Amazon.com, and Firm B is Kroger. Amazon.com is in its rapid
3.15 Interpreting the Relation between Net Income and Cash Flow from Opera-
tions. Firm A is Southwest Airlines, and Firm B is Accenture. Southwest Airlines is
3.16 Interpreting Relations among Cash Flows from Operating, Investing, and
Financing Activities. Firm A is FedEx, and Firm B is Kellogg. The two firms have
Chapter 3
Income Flows versus Cash Flows:
Understanding the Statement of Cash Flows
3-6
© 2018 Cengage Learning®. May not be scanned, copied or duplicated, or posted to a publicly accessible website, in whole or in part.
fixed assets are substantial, consistent with the much larger cash outflow for in-
vesting activities relative to Kellogg. FedEx relies in part on external financing for
its growth. Kellogg, on the other hand, has a net cash outflow for financing activi-
ties typical of a firm repaying debt, paying a dividend, and repurchasing its
common stock.
3.17 Interpreting Relations among Cash Flow from Operating, Investing, and Fi-
nancing Activities. Firm A is eBay, and Firm B is TJX Companies. The two firms
3.18 Interpreting the Statement of Cash Flows. Coca-Cola, like PepsiCo, is a mature
company. Its net income increased close to 20% in Year 2, but pulled back slightly
3.19 Interpreting the Statement of Cash Flows. The wide variation in sales indicates
the cyclical nature of demand for semiconductors. Net income tends to follow the
Chapter 3
Income Flows versus Cash Flows:
Understanding the Statement of Cash Flows
3-7
© 2018 Cengage Learning®. May not be scanned, copied or duplicated, or posted to a publicly accessible website, in whole or in part.
crease in net income). Note that the pattern of changes in operating working capital
accounts is what you would expect with variations in growth. When sales increase,
accounts receivable and inventories increase; current liabilities tend to increase as
well (Year 2, Year 3, and Year 4). When sales decrease (Year 1), accounts receiva-
ble and inventories decrease; current liabilities decrease as well.
Except for Year 0, when Texas Instruments added considerable new capacity,
cash flow from operations was more than sufficient to finance acquisitions of fixed
assets. During the five years, Texas Instruments issued additional common stock,
primarily to employees under stock option plans. It decreased its short-term and
long-term borrowing. Firms subject to high technology risk and short product life
cycles tend not to rely on debt financing. Texas Instruments used the cash flow
from operations in excess of fixed asset acquisitions and debt retirements, particu-
larly in Year 2, Year 3, and Year 4, to pay dividends and repurchase its common
stock.
3.20 Interpreting the Statement of Cash Flows. The first pattern to note is the increas-
ing losses reported across 2010–2012, more than doubling from $154 million to
there is no adjustment for “Excess tax benefits from stock-based compensation” be-
cause Tesla’s share price has languished during 2012, and exercises by employees
were minimal.) Thus, approximately $78 million of the $130 million difference is
Chapter 3
Income Flows versus Cash Flows:
Understanding the Statement of Cash Flows
3-8
As Tesla explains, “Reservation payments consist of payments that allow potential
3.21 Interpreting the Statement of Cash Flows. The best place to start with interpret-
ing the statement of cash flows of Gap is the changes in sales. Gap experienced its
largest increase in sales of the five years during Year 0. Sales growth declined
Chapter 3
Income Flows versus Cash Flows:
Understanding the Statement of Cash Flows
3-9
© 2018 Cengage Learning®. May not be scanned, copied or duplicated, or posted to a publicly accessible website, in whole or in part.
expenditures. Gap increased its long-term borrowing in Year 2. One wonders about
the new debt issued, given the excess cash flow. Gap invested some of the cash
flow in marketable securities and some simply in cash.
Sales and net income increased still further in Year 3. Gap must have instituted
more effective inventory controls in that year because it reduced its inventory even
though sales increased. It reduced expenditures on fixed assets still further, resulting
in substantially increased cash flow. The firm invested the cash in marketable secu-
rities and repaid long-term borrowing. By Year 3, the firm appears to have weath-
ered the downturn in Year 1 and placed itself on solid financial footing.
Year 4 brought another drastic slowdown in the rate of growth in sales and a
commensurate small increase in net income. Cash flow from operations was more
than sufficient to finance acquisitions of fixed assets. Gap used the excess to reduce
long-term debt still further and reacquire outstanding common stock.
3.22 Interpreting the Statement of Cash Flows. The company has been realizing
extremely high growth rates for revenue, but also large losses. The losses are large
3.23 Interpreting the Statement of Cash Flows.
a. The sales decline is a primary indicator of an operating problem. During a
period of decreased sales, accounts receivable and inventories usually decrease.
Chapter 3
Income Flows versus Cash Flows:
Understanding the Statement of Cash Flows
3-10
© 2018 Cengage Learning®. May not be scanned, copied or duplicated, or posted to a publicly accessible website, in whole or in part.
to improve the quality of its products and stimulate sales. Sunbeam sold some
businesses and acquired others, suggesting that it recognized the need to change
the mix of businesses in which it was involved. Cash flow from operations was
insufficient to finance its investing needs. The firm engaged in short-term bor-
rowing to cover the shortfall. Healthy firms generally use long-term financing
for noncurrent assets, perhaps a signal of difficulty in obtaining long-term
financing. Sunbeam repurchased shares of its common stock during Year 5.
Such use of cash appears unwise, given its operating problems and need to
finance acquisitions of fixed assets. An alternative interpretation of the stock
repurchases was that Sunbeam wanted to reduce the dilution effects of issuing
common stock to employees, so it repurchased approximately the same number
of shares that it issued to employees.
b. Net income turned negative during Year 6, primarily as a result of the provision
for restructuring and asset impairment. Assuming an income tax rate of 35%,
the restructuring and asset impairment charge reduced net income for Year 6 by
$184.4 million [(1 – 0.35)($283.7)]. Thus, net income without the restructuring
and asset impairment charge was a net loss of $43.9 million ($228.3 – $184.4).
The decrease in sales during Year 6 was even larger than in Year 5, yet accounts
18.7% increase in sales. The surprising signal was that the increased sales did
not result in positive cash flow from operations. The negative cash flow from
inventories. Although one would expect an increase in these accounts when
Chapter 3
3-11
© 2018 Cengage Learning®. May not be scanned, copied or duplicated, or posted to a publicly accessible website, in whole or in part.
expenditures still further during Year 7 and sold off businesses to generate cash.
It continued to engage in short-term borrowing.
3.24 Interpreting the Statement of Cash Flows. Montgomery Ward’s march toward
bankruptcy manifests itself more clearly through examination of its cash flow pat-
tern over time.
During Year 7, sales grew slowly. Net income was positive. Cash flow from op-
erations exceeded net income because of the addback for depreciation. Cash flow
inventories. Cash flow from operations was insufficient to finance capital expendi-
tures, so Montgomery Ward increased its long-term borrowing.
Montgomery Ward stretched its suppliers in excess of the increase in inventories.
the firm’s bankruptcy were sown in Year 9.
Despite the acquisition of Lechmere, sales declined slightly between Year 9 and
Year 10 and the firm operated at a net loss. Cash flow from operations turned nega-
tive as Montgomery Ward paid deferred taxes and increased accounts receivable
and inventories in excess of the increase in current operating liabilities. The in-
Chapter 3
Income Flows versus Cash Flows:
Understanding the Statement of Cash Flows
3-12
Montgomery Ward shifted its financing to longer-term sources during Year 10 in
3.25 Extracting Performance Trends from the Statement of Cash Flows. The Apollo
Group came under heavy fire from government officials during 2012. Concerned
over student loan debt and accusations of abuse by private educators, the Depart-
Chapter 3
Income Flows versus Cash Flows:
Understanding the Statement of Cash Flows
3-13
sale-leaseback proceeds and a collateralization of a letter of credit. Both transactions
3.26 Interpreting a Direct Method Statement of Cash Flows. The airline industry is
plagued by volatility in profitability and cash flows, and the swing in cash flows
from Year 1 to Year 2 demonstrates this characteristic of the industry well. Indeed,
Year 2). Depreciation and amortization were similar across years, which is con-
sistent with examples in the chapter. Part of the Year 2 loss reflects the non-cash
Year 2. This reflects two primary differences. First, in Year 1, the airline re-
ceived cash from the maturity and liquidation of €138 million in investments (of
Chapter 3
Income Flows versus Cash Flows:
Understanding the Statement of Cash Flows
3-14
equipment in Year 2 (€114 million) relative to Year 1 (€201 million), which
million at the end of Year 2. As noted in the chapter, a difference between U.S.
tion of cash and cash equivalents, so it is possible to report negative cash, cash
equivalents, and bank overdrafts, as Aer Lingus does at the end of Year 1.
b. The operating section of Aer Lingus’ statement of cash flows ends up being a
3.27 Identifying Industry Differences in the Statement of Cash Flows. Exhibit 3.27
orders the firms in terms of the relation between net income and cash flow from op-
erations. Firms with low percentages for net income have the highest percentages
for the depreciation addback and therefore are the most capital-intensive.
Firm # Firm
Chapter 3
Income Flows versus Cash Flows:
Understanding the Statement of Cash Flows
3-15
Firms 1, 2, and 3 display the highest capital intensity. The three firms with the
cash flow from operations over capital expenditures of Firm 2 exceeds that of Firm
is Inland Steel and Firm 3 is Chevron Texaco. Inland Steel is less capital-intensive
than Chevron. (Note that the ratio of depreciation to net income is higher for Firm 3
cycle. The firm financed its growth with a mixture of debt and equity financing.
These characteristics describe Biogen, a biotechnology company. Biotechnology
Chapter 3
Income Flows versus Cash Flows:
Understanding the Statement of Cash Flows
3-16
stock seems unusual given the need for capital to finance ongoing R&D and the is-
the earnings of the firm each year and require large payouts in order to make the
prising clue is the changes in long-term debt. One would expect that a service firm,
without fixed assets to serve as collateral, would minimize the use of long-term
acquisitions), so one would expect a high dividend payout ratio. The high percen-
products. The stock buyback might occur to thwart an unfriendly takeover, to force
3.28 Preparing a Statement of Cash Flows from Balance Sheets and Income State-
ments.
Chapter 3
Income Flows versus Cash Flows:
Understanding the Statement of Cash Flows
3-17
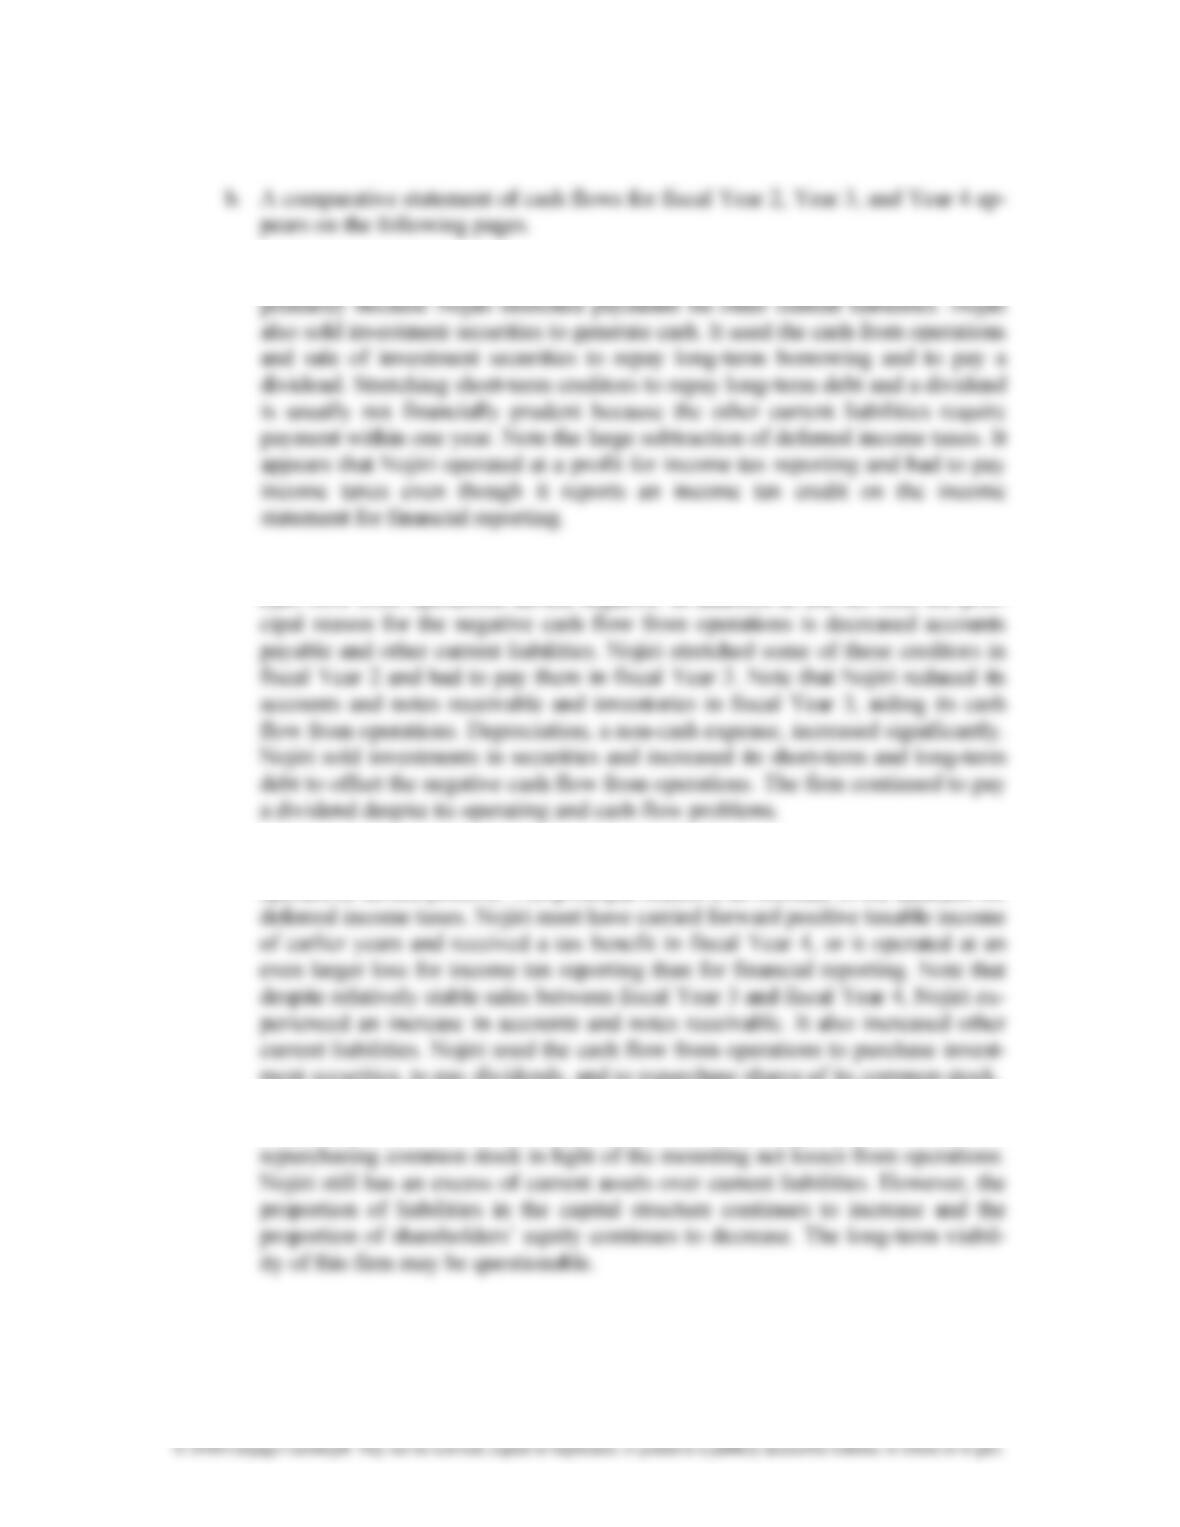
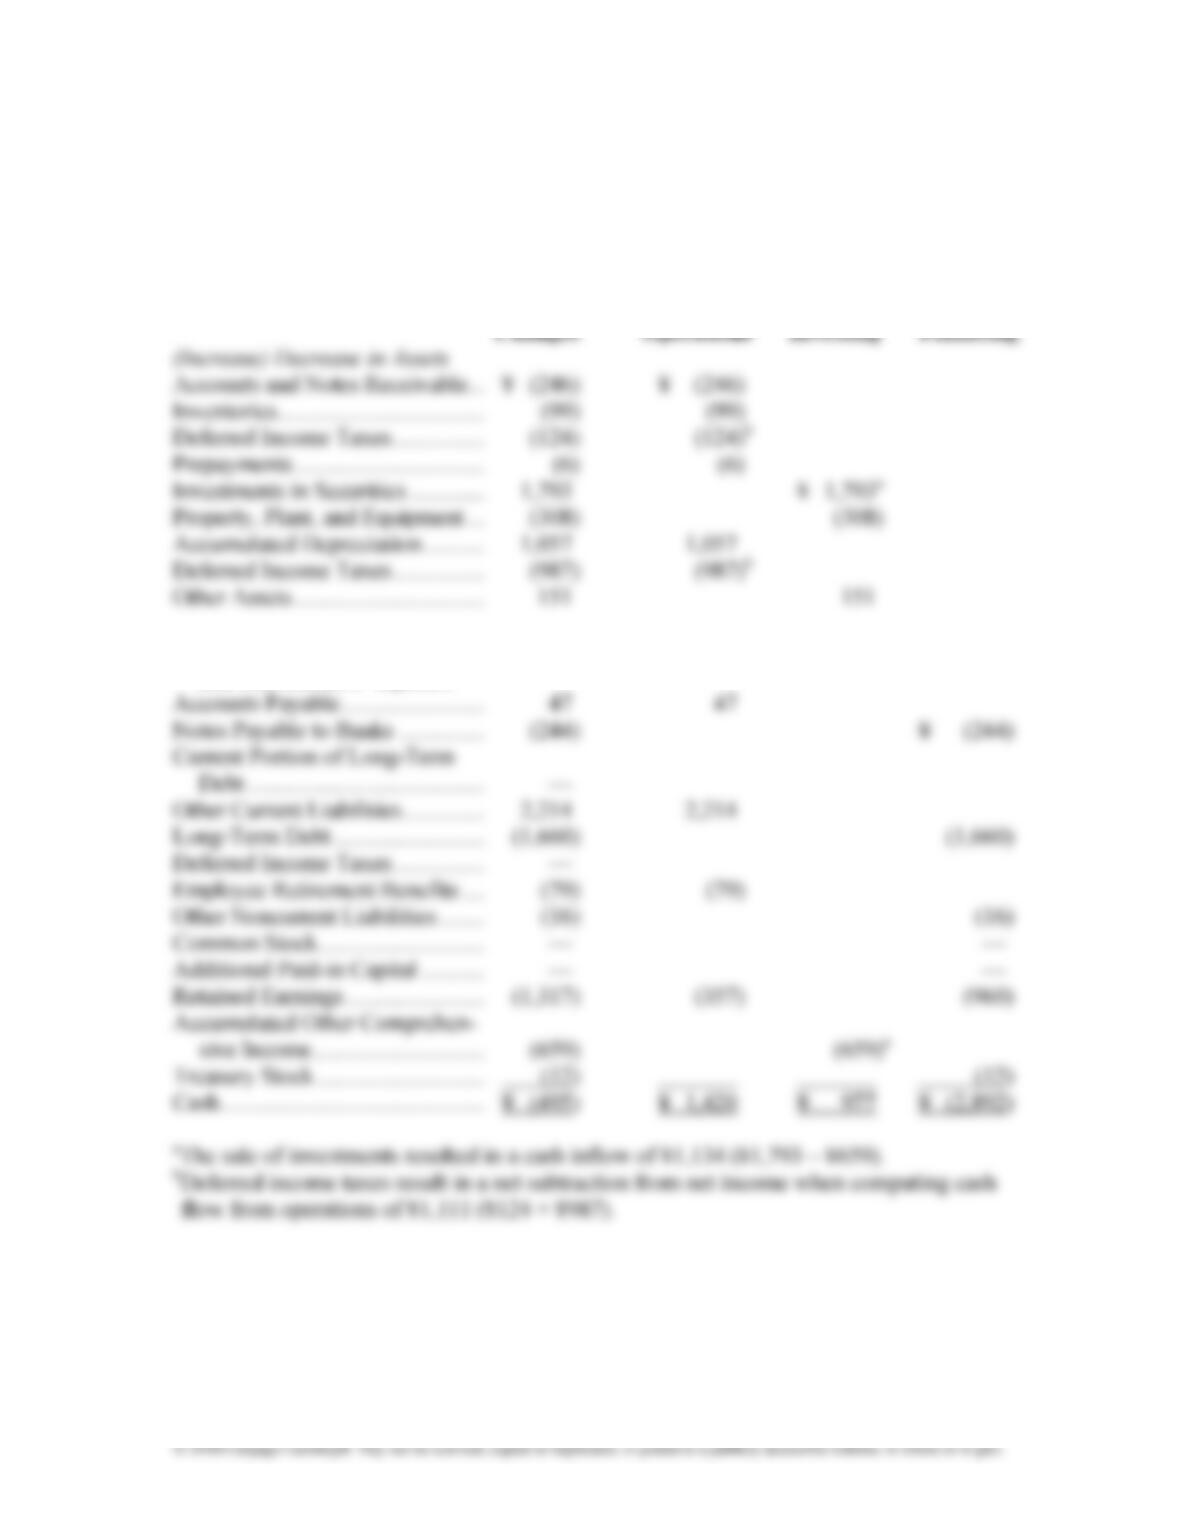
c. Year 2: Net income was negative but cash flow from operations was positive,
Year 3: The net loss increased between fiscal Year 2 and fiscal Year 3, and
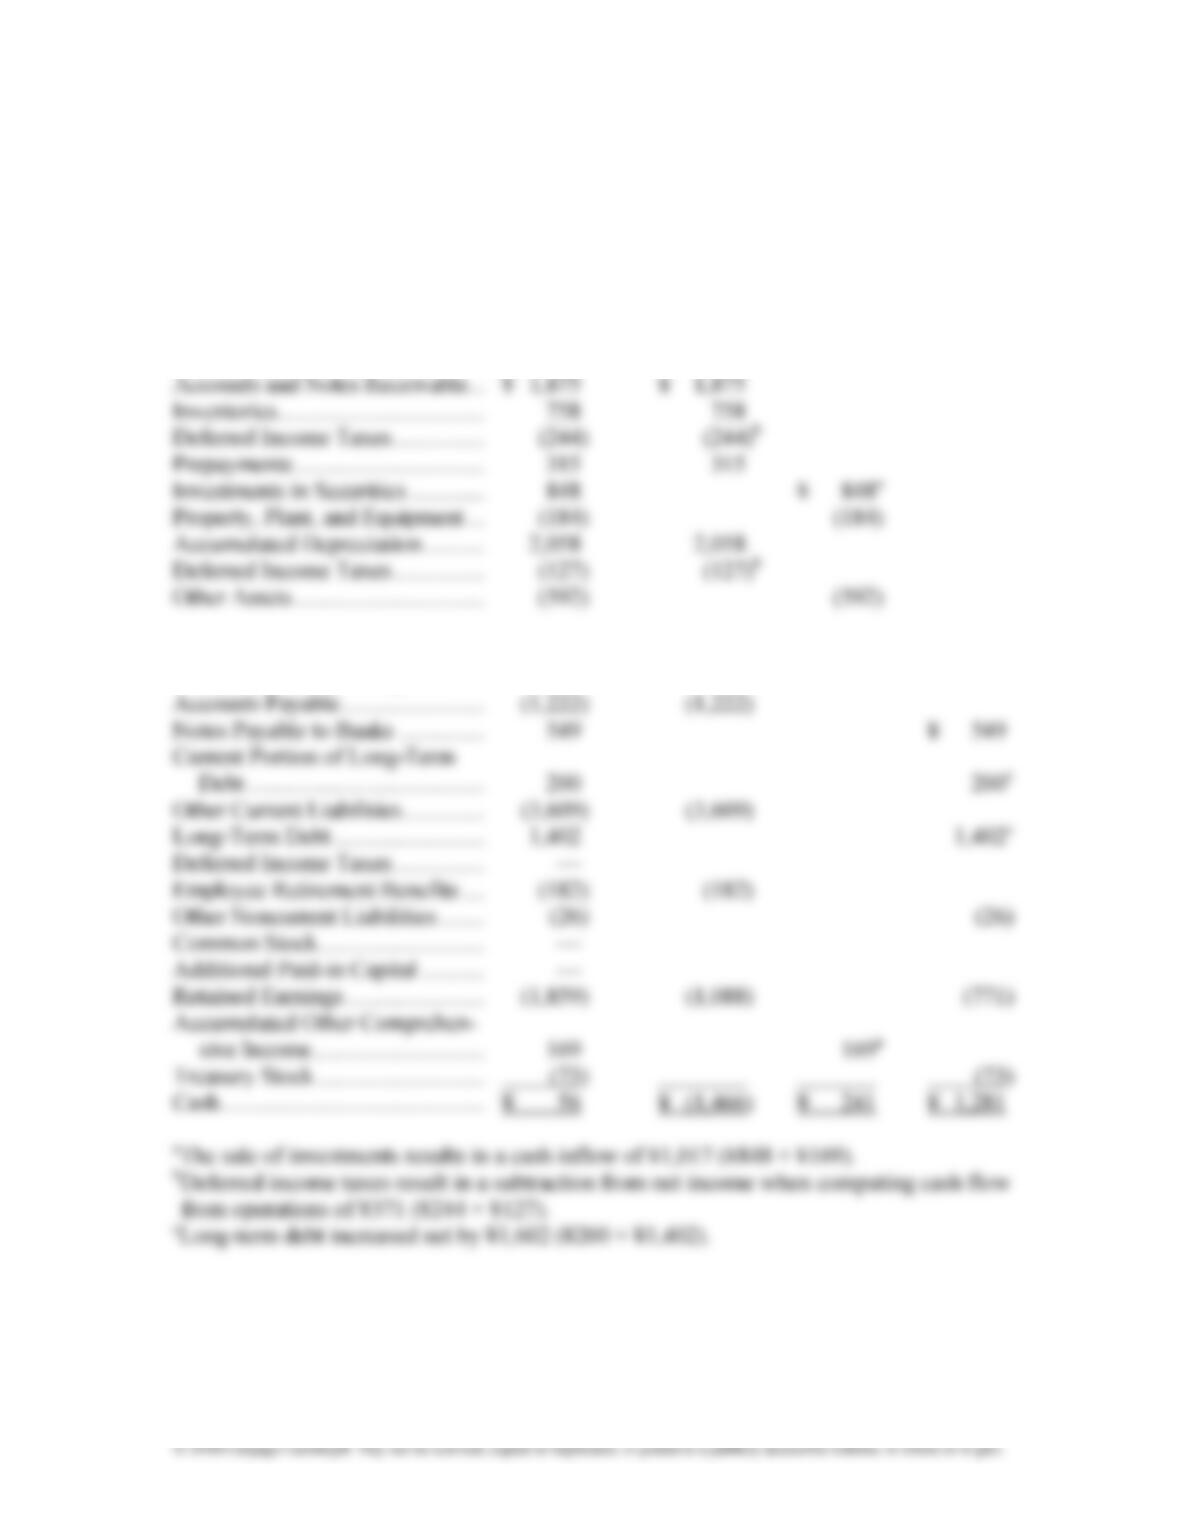
cash flow from operations turned negative. In addition to the net loss, the prin-
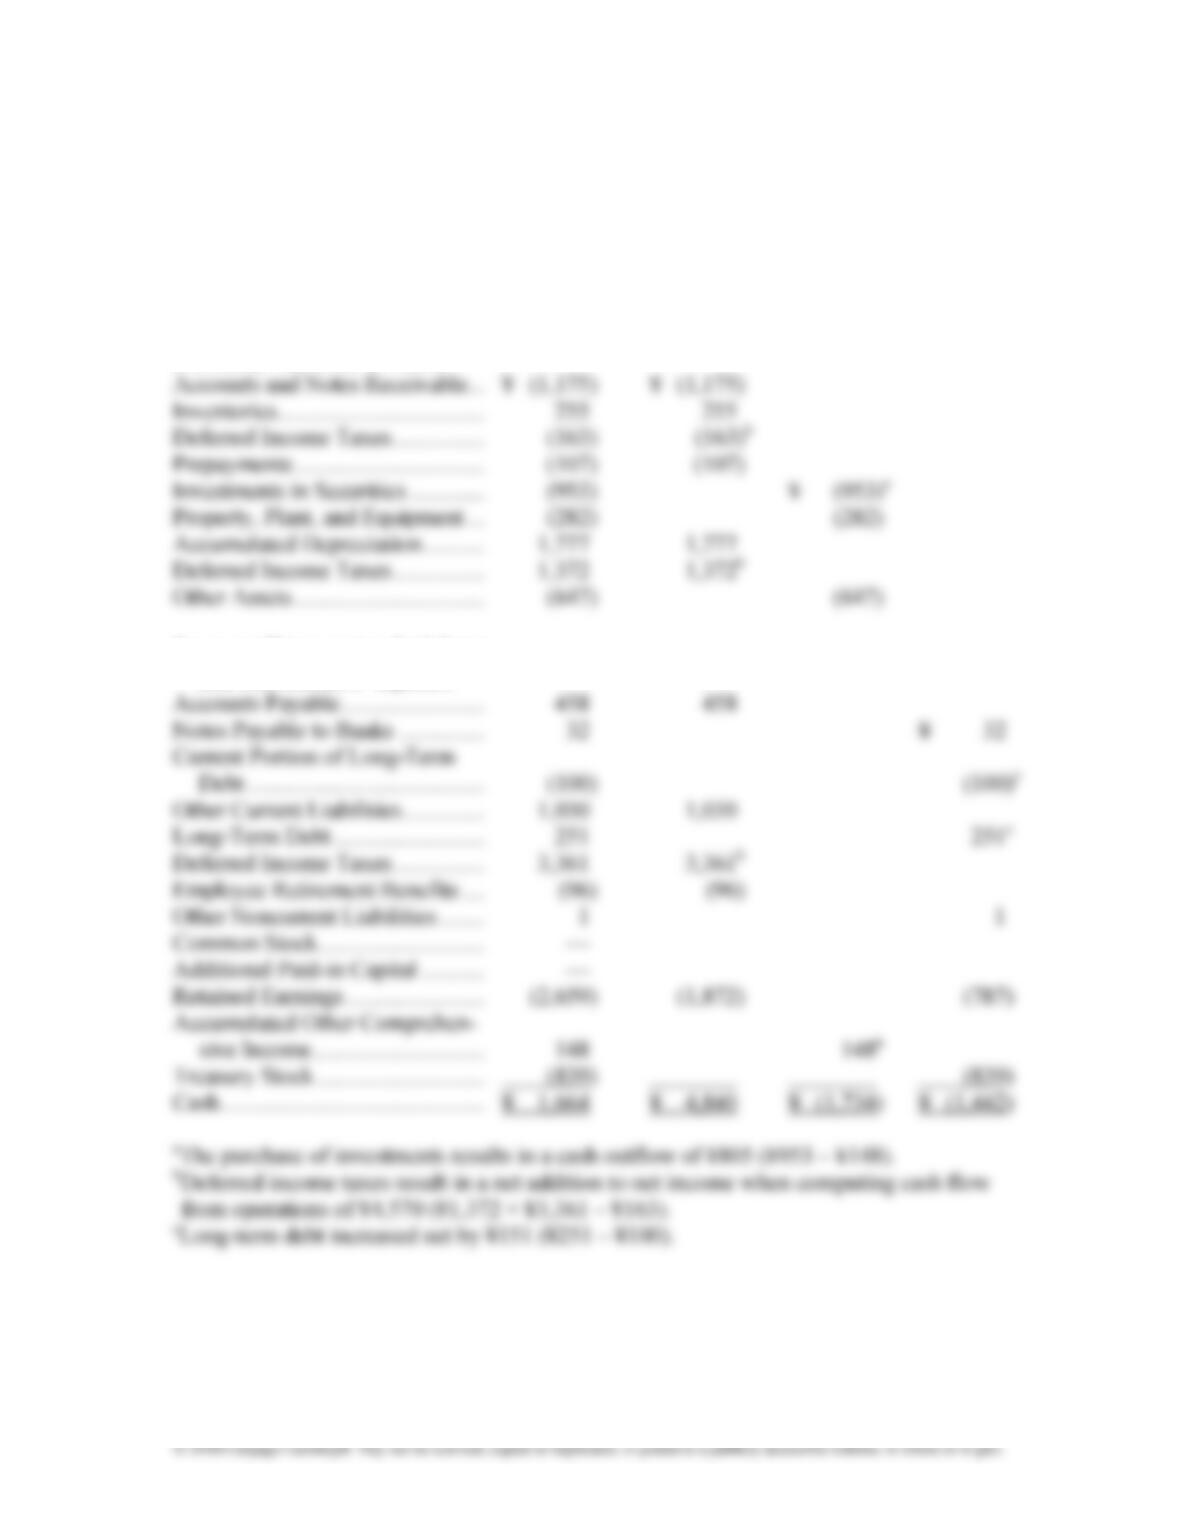
Year 4: The net loss increased still further in fiscal Year 4, but cash flow from
operations turned positive. The principal reason is an increase in the addback for
ment securities, to pay dividends, and to repurchase shares of its common stock.
Summary: One wonders about the wisdom of continuing to pay dividends and
Chapter 3
Income Flows versus Cash Flows:
Understanding the Statement of Cash Flows
3-18
a. Worksheet for Statement of Cash Flows for Nojiri Pharmaceutical
Year 2
(amounts in millions)
(Problem 3.28)
Balance Sheet
Increase (Decrease) in Liabilities
and Shareholders’ Equities
Chapter 3
Income Flows versus Cash Flows:
Understanding the Statement of Cash Flows
3-19
Worksheet for Statement of Cash Flows for Nojiri Pharmaceutical
Year 3
(amounts in millions)
(Problem 3.28)
Balance Sheet
Changes Operations Investing Financing
(Increase) Decrease in Assets
Increase (Decrease) in Liabilities
and Shareholders’ Equities
Chapter 3
Income Flows versus Cash Flows:
Understanding the Statement of Cash Flows
3-20
Worksheet for Statement of Cash Flows for Nojiri Pharmaceutical
Year 4
(amounts in millions)
(Problem 3.28)
Balance Sheet
Changes Operations Investing Financing
(Increase) Decrease in Assets
Increase (Decrease) in Liabilities
and Shareholders’ Equities