Chapter 14
Valuation: Market-Based Approaches
14-12
d. Under these assumptions, Enron’s shares appear to be priced by the market to
yield a 4.413% rate of return, as shown above, which is only marginally
greater than the prevailing risk-free rate of return. Enron’s shares appear to be
14.21 Valuation of Coca-Cola Using Market Multiples. This is an extensive integrat-
ed problem that connects the topics of Chapter 14 to those of Chapters 10–13 us-
Chapter 14
Valuation: Market-Based Approaches
14-13
Part I—Computing Coca-Cola’s Value-to-Book Ratio Using the Value-to-Book
Valuation Approach
b.–i.
Exhibit 14.A presents the excerpts from FSAP for the valuation of Coca-Cola
based on projected residual ROCE and the value-to-book approach. The first
© 2018 Cengage Learning®. May not be scanned, copied or duplicated, or posted to a publicly accessible website, in whole or in part.
Chapter 14
Valuation: Market-Based Approaches
Exhibit 14.A
Value-to-Book Model Valuation for Coca-Cola
(Problem 14.21)
Continuing
RESIDUAL INCOME VALUATION 1 2 3 4 5 Value
Market-to-Book Approach Year +1 Year +2 Year +3 Year +4 Year +5 Year +6
Residual ROCE 21.2% 21.1% 21.4% 21.7% 22.0% 22.5%
Cumulative growth factor in common equity as of t–1 100.0% 103.5% 105.8% 107.9% 109.7% 111.3%
Residual ROCE times cumulative growth 21.2% 21.9% 22.6% 23.4% 24.2% 25.0%
Chapter 14
Valuation: Market-Based Approaches
14-15
© 2018 Cengage Learning®. May not be scanned, copied or duplicated, or posted to a publicly accessible website, in whole or in part.
b. and c.
Projected residual ROCE amounts for Coca-Cola in Years +1 to +6 are
shown in Exhibit 14A.
d. The data in the exhibit indicate that the sum of the present value of residual
ROCE for Coca-Cola for Years +1 through +5 amounts to 1.91. This indicates
that over Years +1 through +5, Coca-Cola will earn positive residual ROCE
that, in present value, is equivalent to 0.91 times beginning book value of
equity.
e. The data in the exhibit indicate that projected residual ROCE in Year +6 will be
22.5%. Using the 7.50% required rate of return on common equity from Solu-
tion a as a discount rate and the 3.0% long-run growth rate from Solution c,
we compute the continuing value of Coca-Cola as of the start of Year +6 and
discount it to present value at the start of Year +1. The present value of con-
tinuing value is 3.88 [0.225/(0.0750 – 0.030) × 0.697].
Chapter 14
Valuation: Market-Based Approaches
14-16
Part II—Analyzing Coca-Cola’s Share Price Using the Value-Earnings Ratio,
Price-Earnings Ratio, and Reverse Engineering
j. Our Year +1 earnings per share based on projected comprehensive income
available for common shareholders in Year +1 of $7,342.3 million divided by
7.50% expected return implied by the CAPM. We determine this by assuming
that value equals price and that our earnings and 3% long-run growth forecasts
through Year +6 and beyond are reliable proxies for the market’s expectations
for Coca-Cola. We then solve for the implied expected rate of return (the dis-
count rate) the market has impounded in Coca-Cola’s share price by varying
14-17
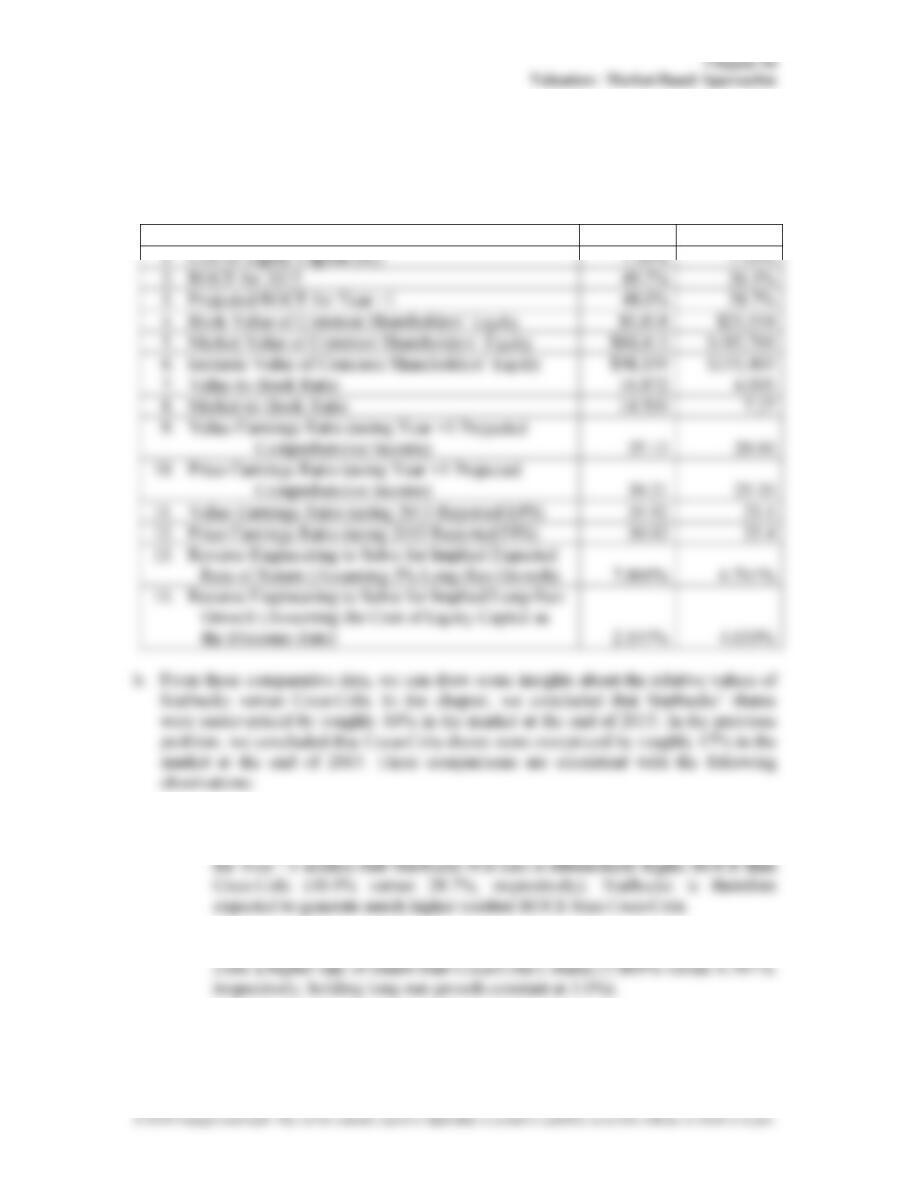
14.22 Analysis of Comparable Companies Using Market Multiples.
a. The following table uses data and analyses for Starbucks from this chapter and
the data and analyses for Coca-Cola from the previous problem to compare
these two competitors on the following dimensions:
dollar amounts in millions Starbucks Coca-Cola
(1) Both Starbucks and Coca-Cola have similar costs of equity capital and both
are expected to generate very high ROCE next year (and beyond). Forecasts
(2) Reverse engineering suggests that the market has priced Starbucks’ shares to
14-18
© 2018 Cengage Learning®. May not be scanned, copied or duplicated, or posted to a publicly accessible website, in whole or in part.
(3) Reverse engineering suggests that the market prices for Starbucks’ shares
reflect less value for long-run growth than Coca-Cola shares (2.157% versus
4.030%, respectively).
Integrative Case 14.1
Valuation of Walmart Using Market Multiples. This is an extensive integrated
was $67.50.
Part I—Computing Walmart’s Value-to-Book Ratio Using the Value-to-Book Valua-
tion Approach
© 2018 Cengage Learning®. May not be scanned, copied or duplicated, or posted to a publicly accessible website, in whole or in part.
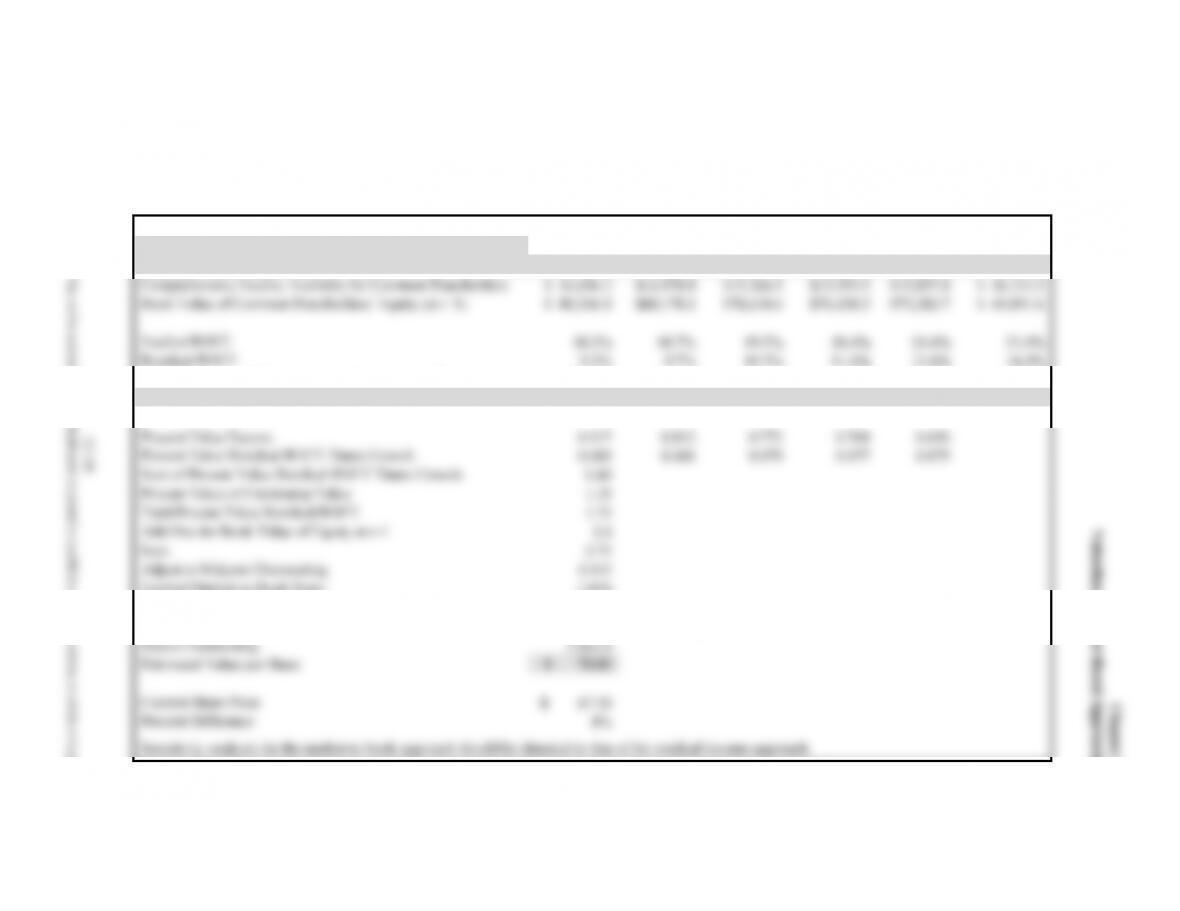
Exhibit 14.B
Value-to-Book Model Valuation for Walmart Stores
(Integrative Case 14.1)
Continuing
RESIDUAL INCOME VALUATION 1 2 3 4 5 Value
Market-to-Book Approach Year +1 Year +2 Year +3 Year +4 Year +5 Year +6
Cumulative growth factor in common equity as of t–1 100.0% 99.5% 97.4% 94.5% 91.0% 86.8%
Residual ROCE times cumulative growth 9.2% 9.6% 10.2% 10.8% 11.5% 12.5%
Implied Market-to-Book Ratio 2.870
Times Beginning Book Value of Equity $ 80,546.0
Total Present Value of Equity $231,184.5
Chapter 14
Valuation: Market-Based Approaches
14-20
b. and c.
0.030) × 0.650].
f. We compute Walmart’s value-to-book ratio as of the end of 2015 with the following
Chapter 14
Valuation: Market-Based Approaches
14-21
k. Using the Year +1 EPS forecast of $4.65 from Solution j and the $67.50 share price at
the end of 2015, Walmart’s price-earnings ratio is 14.5. Thus, Walmart’s value-

Chapter 14
Valuation: Market-Based Approaches
14-22
This page is intentionally left blank