14-1
CHAPTER 14
VALUATION: MARKET-BASED APPROACHES
Solutions to Questions, Exercises, Problems, and Teaching Notes to Cases
14.1 Value Determinants. The same fundamental determinants of firm value (expected
14.2 Residual ROCE. Residual ROCE (return on common shareholders’ equity) rep-
resents residual income scaled by beginning common shareholders’ equity. Alter-
14.3 Value-to-Book Valuation Approach. In conceptual terms, the value-to-book val-
uation approach measures the value of each dollar invested in book value of com-
ter 13. The only real difference is that the value-to-book approach scales all of the
variables in the valuation computation by beginning book value of equity.
14.4 Interpreting Value-to-Book Ratios. A firm with a value-to-book ratio that is
exactly equal to 1 indicates that the book value of common equity plus the present
14.5 Interpreting Value-to-Book Ratios. A value-to-book ratio that is greater than
Chapter 14
Valuation: Market-Based Approaches
14-2
14.6 Value-to-Book Ratio Drivers. A firm’s value-to-book ratio will be higher than
their investment. Such conditions could arise, for example, if (1) the firm’s
14.7 Value-to-Book Ratio Drivers. Various economic factors will cause a firm’s
value-to-book ratio to decrease over time, including (1) increasing competition
driving the firm’s ROCE down, (2) increasing systematic risk that increases the
14.8 The Value-Earnings Ratio. In conceptual terms, the value-earnings ratio
expresses equity value as a multiple of one period of earnings. Similarly, the price-
earnings ratio expresses share price as a multiple of one period of earnings.
14.9 The Price-Earnings Ratio. In practice, it is common to observe price-earnings
ratios measured as current period price divided by trailing twelve months (or most
Chapter 14
14-3
© 2018 Cengage Learning®. May not be scanned, copied or duplicated, or posted to a publicly accessible website, in whole or in part.
that are not expected to persist; (3) the firm pays dividends, which reduce share
price but are not subtracted from earnings; and (4) share price is computed based
on year-ending shares outstanding, whereas earnings per share are based on
weighted-average shares outstanding during the year.
14.10 Price-Earnings Ratio Drivers. Various economic factors can cause one firm’s
price-earnings ratio to be higher than that of other firms in the same industry: (1)
investors expect that the firm’s strategy enables it to generate and sustain greater
14.11 Price-Earnings Ratio Drivers. Various economic factors can drive a firm’s
price-earnings ratio down over time, including (1) increasing competition driving
the firm’s share price down faster than earnings, (2) increasing systematic risk
that increases the firm’s equity cost of capital over time, (3) losing technological
14.12 Market-to-Book versus Price-Earnings Ratios. Market-to-book multiples
demonstrate less volatility over time and less variance across firms than do price-
14-4
14.13 Reverse Engineering Share Prices. Reverse engineering share prices is a pro-
cess through which the analyst attempts to infer the assumptions that the capital
market is making in valuing a particular share. By assuming that value equals
14.14 Market Efficiency. Market efficiency is a matter of degree that describes the
amount of information impounded in share prices and the speed with which prices
reflect new value-relevant information. Market efficiency does not mean that
14.15 Analysts’ Role in Market Efficiency. Analysts play a key role in making the
capital markets efficient by being active acquirers and processors of value-
14.16 Market Efficiency with Respect to Quarterly Earnings Surprises. The
evidence presented in Exhibit 14.8 in the text indicates that the market is highly
efficient with respect to quarterly earnings surprises during the 60 trading days
14-5
14.17 Using Market Multiples to Assess Values and Market Prices.
Steak ’n Shake (amounts in millions):
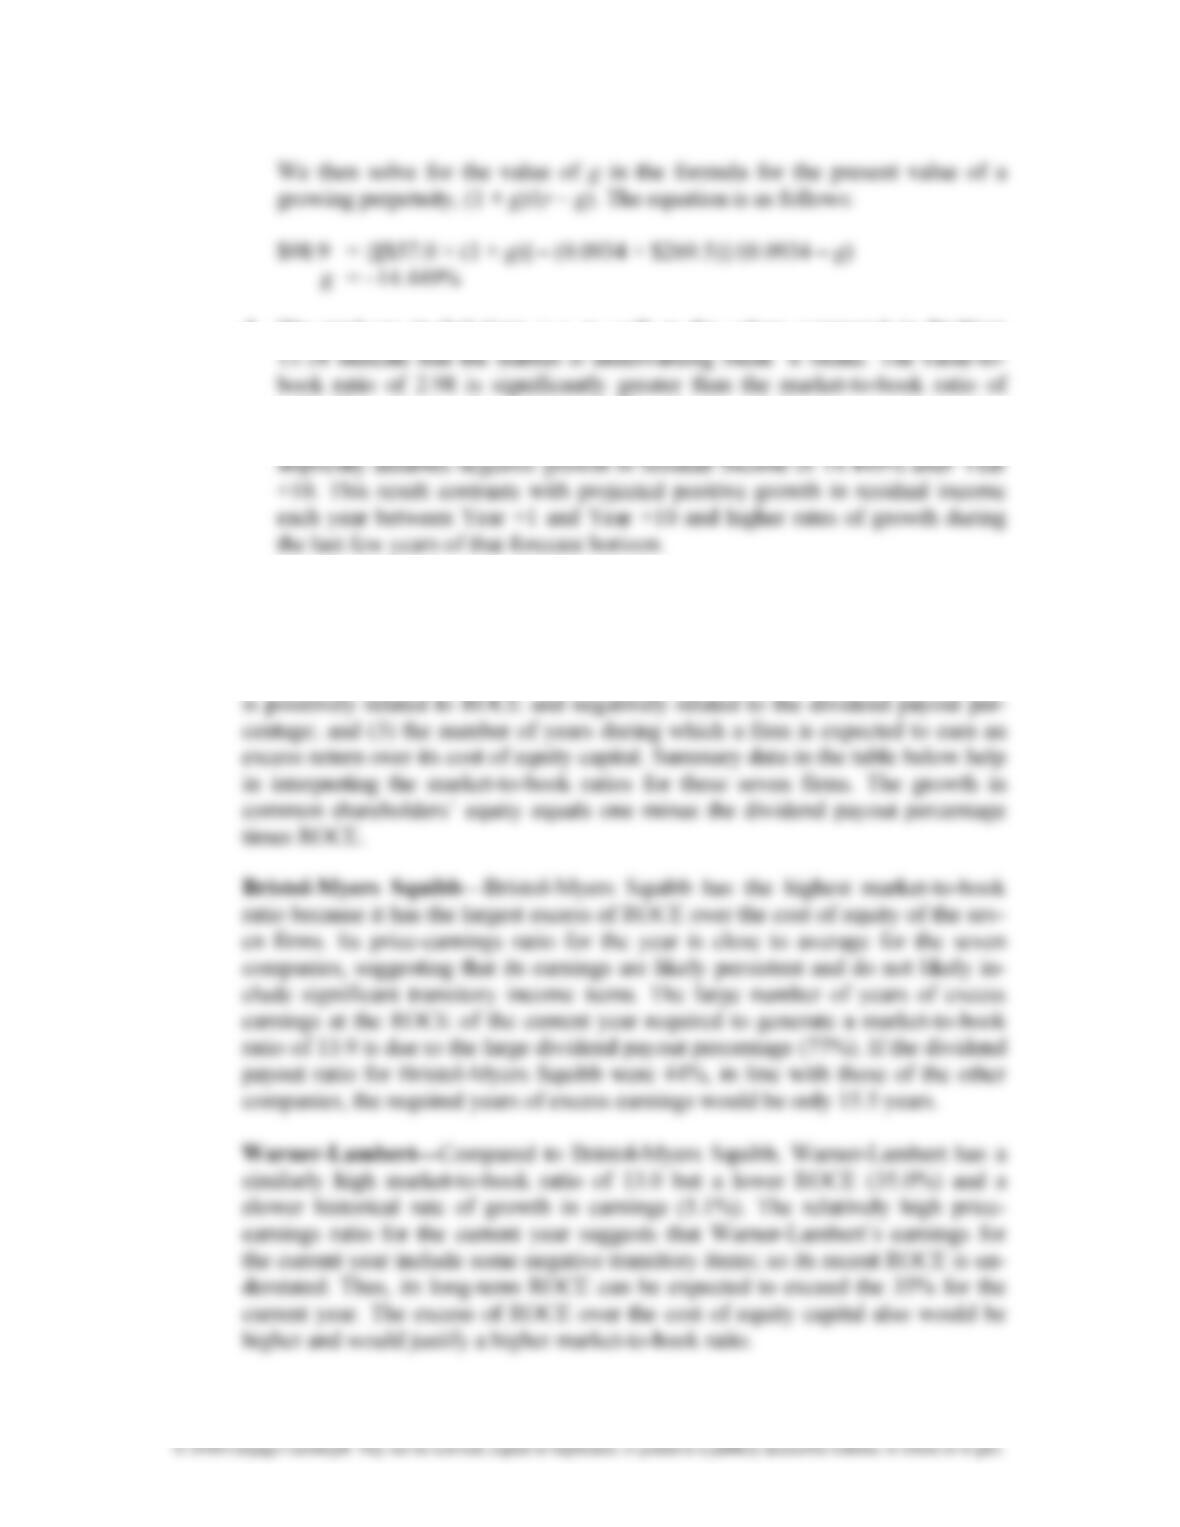
a. Compre- Cum. Present Value/
hensive Implied Residual Share. Eq. Value Book
Year Income ROCE ROCE Growth Factor Ratio
(3) Value-Earnings Year 0: $493.6/$21.8 = 22.6
(4) Price-Earnings Year 0: $309.98/$21.8 = 14.2
(5) Value-Earnings Year +1: $493.6/$24.5 = 20.1
(6) Price-Earnings Year +1: $309.98/$24.5 = 12.6
Chapter 14
Valuation: Market-Based Approaches
14-6
© 2018 Cengage Learning®. May not be scanned, copied or duplicated, or posted to a publicly accessible website, in whole or in part.
We then solve for the value of g in the formula for the present value of a
growing perpetuity, (1 + g)/(r – g). The equation is as follows:
$98.9 = {[$57.0 × (1 + g)] – (0.0934 × $269.5)}/(0.0934 – g)
g = –14.449%
d. The analyses in Solutions a–c as well as the values computed in Problem
1.87. The value-earnings ratios significantly exceed the corresponding price-
earnings ratios. Perhaps the most interesting insight is that the market price
14.18 Interpreting Market-to-Book Ratios.
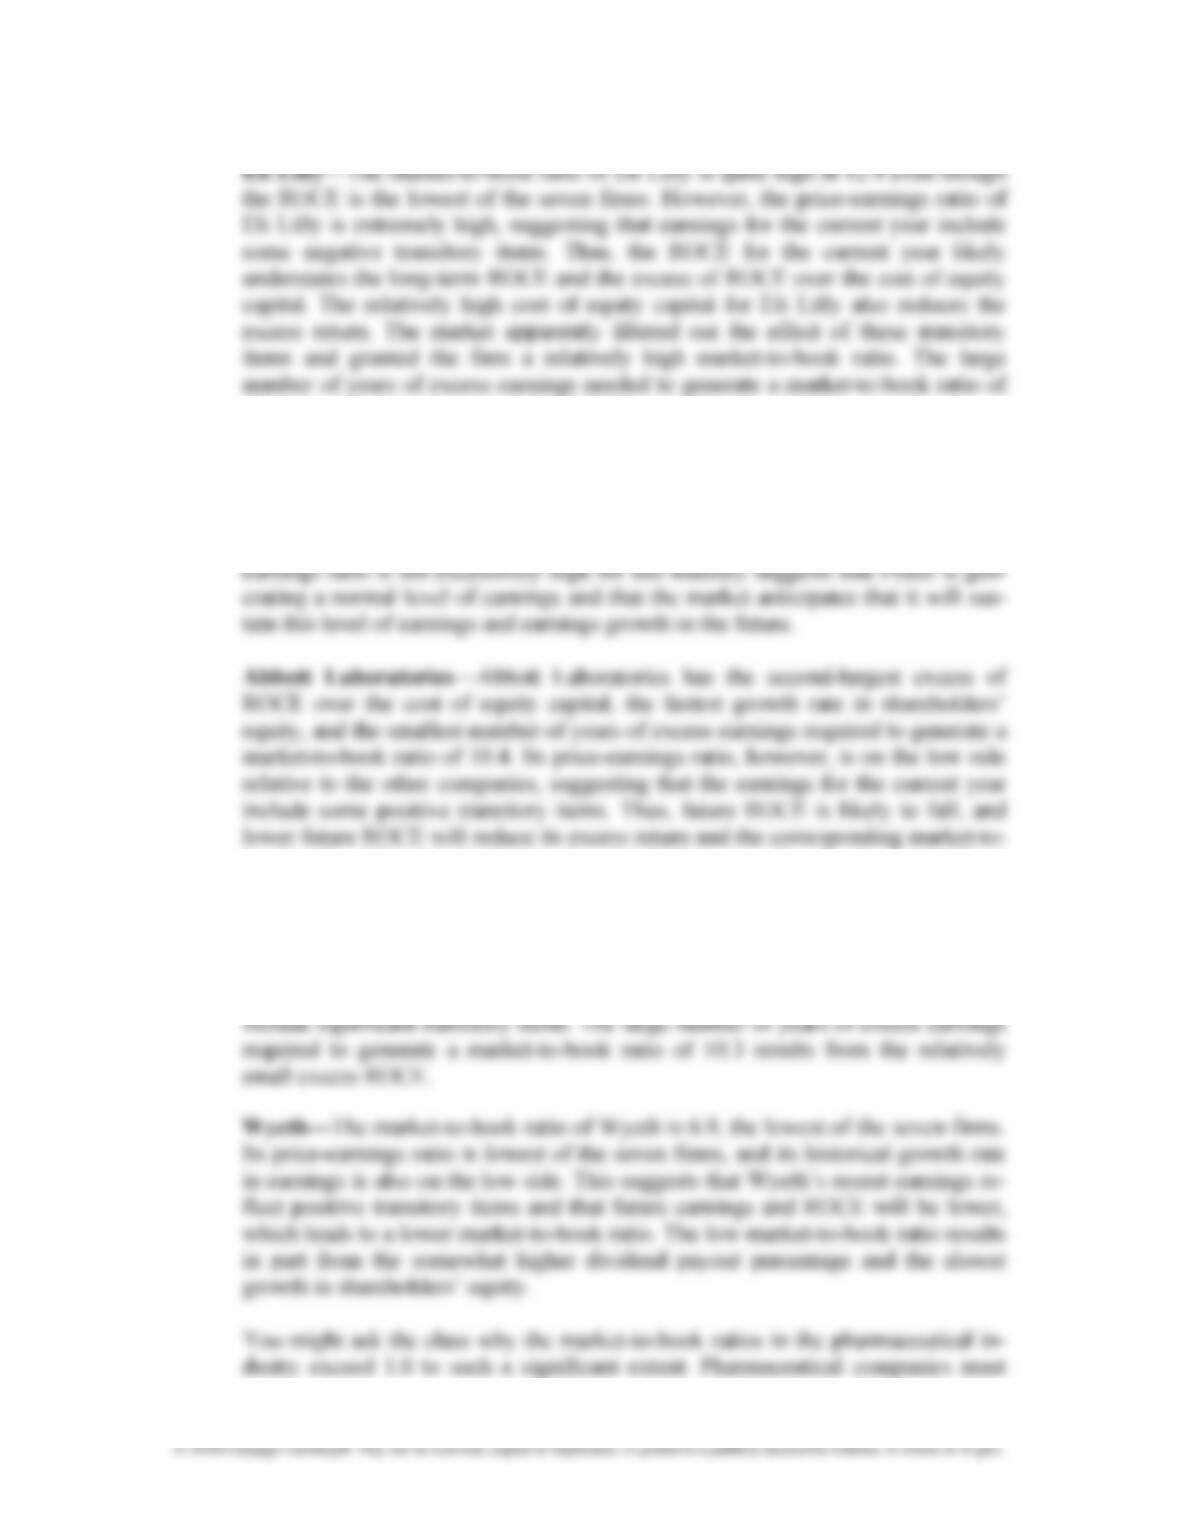
The variables that affect the market-to-book ratio are (1) the excess of ROCE over
the cost of equity capital; (2) the growth in common shareholders’ equity, which
Chapter 14
Valuation: Market-Based Approaches
14-7
© 2018 Cengage Learning®. May not be scanned, copied or duplicated, or posted to a publicly accessible website, in whole or in part.
Eli Lilly—The market-to-book ratio of Eli Lilly is quite high at 12.4 even though
the ROCE is the lowest of the seven firms. However, the price-earnings ratio of
Eli Lilly is extremely high, suggesting that earnings for the current year include
some negative transitory items. Thus, the ROCE for the current year likely
understates the long-term ROCE and the excess of ROCE over the cost of equity
capital. The relatively high cost of equity capital for Eli Lilly also reduces the
excess return. The market apparently filtered out the effect of these transitory
items and granted the firm a relatively high market-to-book ratio. The large
number of years of excess earnings needed to generate a market-to-book ratio of
12.4 also relates to the understated ROCE and high cost of equity capital.
Pfizer—Pfizer’s market-to-book ratio of 11.2 falls in the middle of the seven
companies. Its relatively high excess of ROCE over its cost of equity capital, cou-
pled with the highest growth rate in earnings in recent years, suggests that its
market-to-book ratio should perhaps be even higher. The fact that Pfizer’s price-
book ratio. Abbott Laboratories has the highest growth rate in shareholders’
equity as a result of large ROCE and the lowest dividend payout percentage.
Merck—Merck’s market-to-book ratio of 10.3 is a function of a somewhat lower
excess ROCE, which results in part from a high cost of equity capital. Its price-
earnings ratio falls near the middle of the seven firms, so earnings do not likely
Chapter 14
Valuation: Market-Based Approaches
14-8
© 2018 Cengage Learning®. May not be scanned, copied or duplicated, or posted to a publicly accessible website, in whole or in part.
expense R&D costs in the year incurred, which reduces net income for the ex-
penditures made each year but reduces shareholders’ equity for cumulative R&D
expenditures. Because of the significant lag between making R&D expenditures
and generating revenues and positive earnings from those expenditures, the mar-
ket values the expected benefits several years before the accounting records rec-
ognize those benefits. Thus, market values of equity will exceed book values.
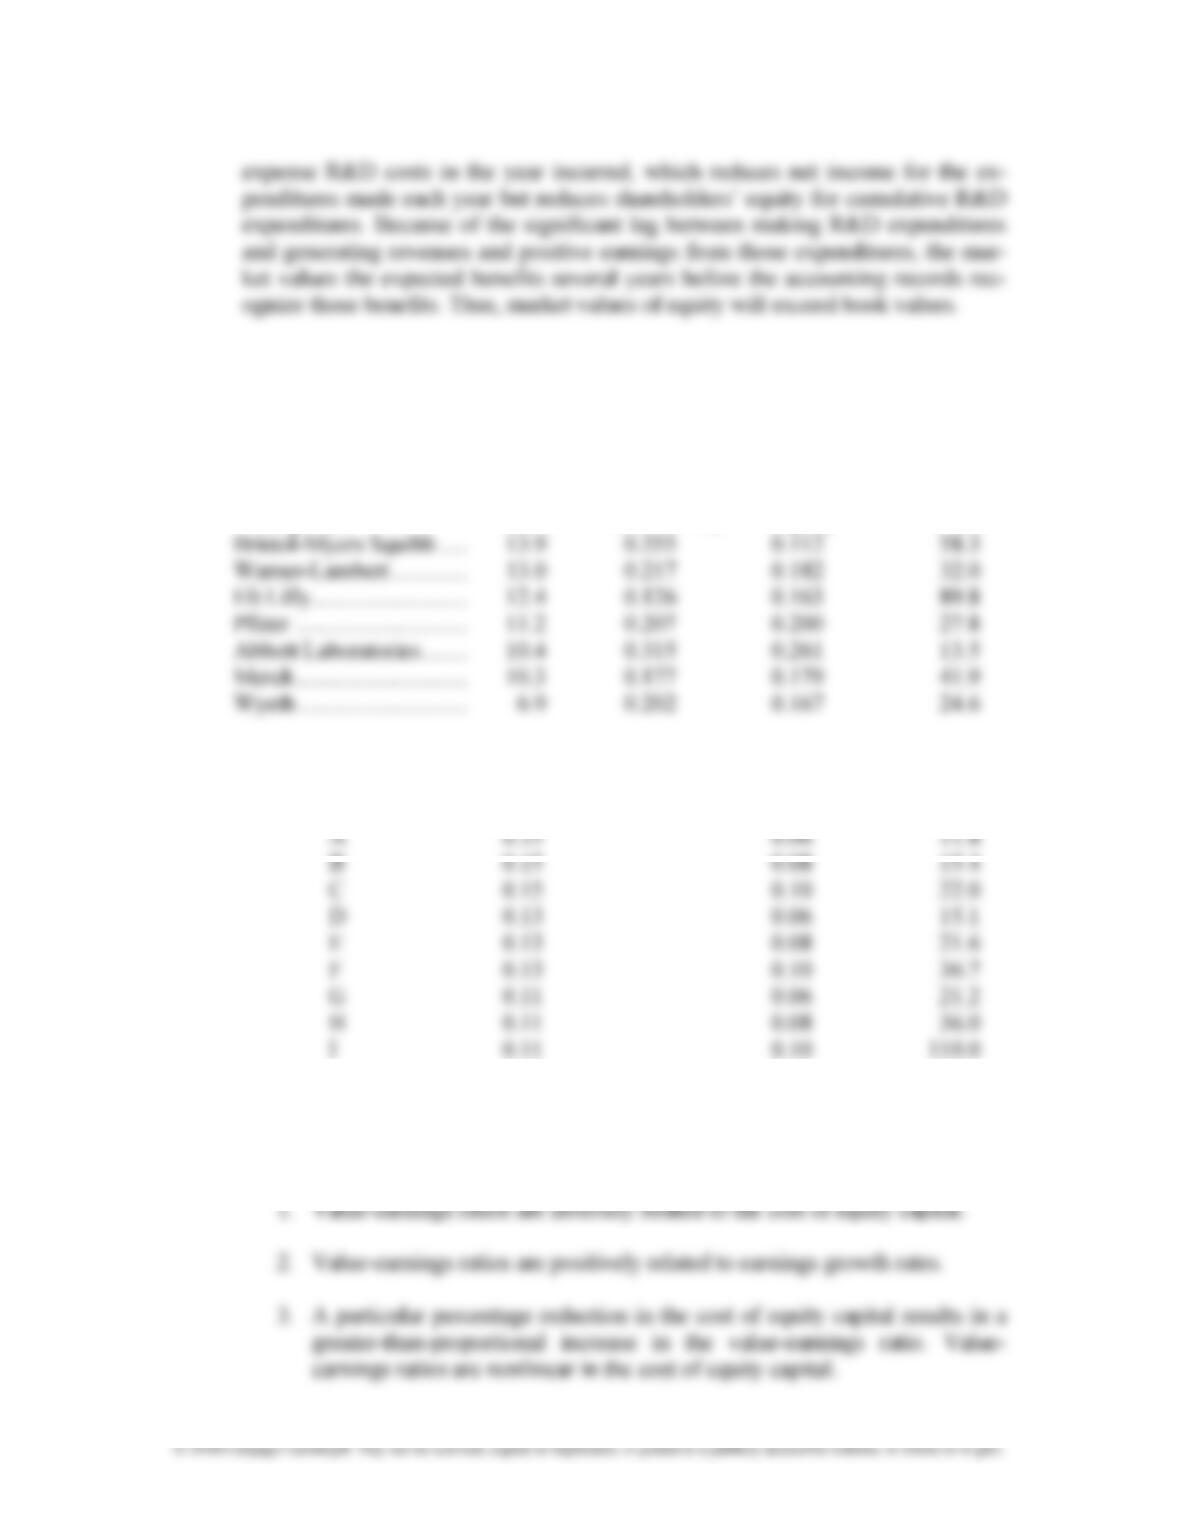
Summary of Data for Seven Pharmaceutical Companies
(Problem 14.18)
Market- Growth in Excess
to-Book Shareholders’ Earnings
Company Ratio ROCE – RE Equity Years
14.19 Sensitivity of Value-Earnings and Value-to-Book to Changes in Assumptions.
a. Scenario Cost of Equity Capital Growth Rate in Earnings VE Ratio
b. The calculations project one-year-ahead earnings and then compute the value-
earnings ratio. Thus, the value-earnings ratios are computed as (1 + g)/(RE – g).
These ratios support the following observations:
14-9
4. The size of the proportional increase in the value-earnings ratio from a
5. A particular percentage increase in the growth rate results in a greater-
Dividend Years of
Cost of Equity Payout Excess VB
Scenario ROCE Capital Percentage Earnings Ratio
A 0.20 0.13 0.30 10 1.64
1. The value-to-book ratio is
Chapter 14
Valuation: Market-Based Approaches
14-10
4. A particular percentage change in the dividend payout rate results in a
5. A particular percentage change in the length of the period in which a firm
6. In terms of sensitivity of the value-to-book ratio to percentage changes in
an underlying variable, the underlying variables rank from largest to
14.20 Market Multiples and Reverse Engineering Share Prices.
a. Following the CAPM, Enron faces a required rate of return on equity capital
(1) Market-to-book = $62,530 million/$11,470 million = 5.45.
(3) Forward price-earnings, based on 2001 consensus earnings forecasts =
(3) Enron will maintain a 40% dividend payout rate.
(4) Beyond 2005, Enron’s long-run earnings growth rate will be 3.0% and the
Year +1 Year +2 Year +3 Year +4 Year +5
Long
Run
EPS $1.31 $1.44 $1.59 $1.74 $1.92 $1.98
BVps (Lagged) $15.25 $16.02 $16.87 $17.80 $18.83 $19.96
computations:
Year +1 Year +2 Year +3 Year +4 Year +5
Long
Run
EPS $1.31 $1.44 $1.59 $1.74 $1.92 $1.98