13-1
CHAPTER 13
VALUATION: EARNINGS-BASED APPROACH
Solutions to Questions, Exercises, Problems, and Teaching Notes to Cases
13.1 Valuation Approach Equivalence. Conceptually, valuation based on dividends,
13.2 Required Income. Required income represents the amount of income the firm
needs to generate to earn a return equal to the required rate of return on common
13.3 Residual Income. Residual income measures the differential amount of income
the firm generates relative to the required income necessary just to satisfy the
common equity shareholders’ required rate of return. Residual income can be pos-
13.4 Residual Income Valuation Theory. The theory behind the residual income
valuation approach is that the firm’s book value of equity represents equity value
in place (that is, the accumulation of previous net investments by shareholders,
Chapter 13
Valuation: Earnings-Based Approach
13-2
13.5 Residual Income Valuation Approach. Book value of common shareholders’
equity plays two roles in the residual income valuation approach. First, book
13.6 Interpreting Residual Income. If a firm’s residual income for a particular year is
positive, the firm was profitable and in fact earned income that exceeded the
amount of income required to meet shareholders’ required return on their invested
capital. If a firm’s residual income for a particular year is negative, the firm’s
13.7 Effects of Investments on Residual Income. If the firm invests incremental
equity capital in assets that generate a return less than the required return of 10%,
13.8 Effects of Borrowing on Residual Income. If the firm borrows capital from a
13.9 Effects of Competition on Residual Income. If the firm competes in a very
competitive, mature industry, competitive conditions will drive residual income
Chapter 13
Valuation: Earnings-Based Approach
13-3
© 2018 Cengage Learning®. May not be scanned, copied or duplicated, or posted to a publicly accessible website, in whole or in part.
dents about how that will happen. Students should think through how increasing
competition will reduce the firm’s prices and profit margins, which will reduce
net income and, therefore, residual income.
13.10 Effects of Conservative Accounting on Residual Income Valuation. The
residual income value estimates will not be distorted by conservative accounting
because forecasts of income will capture the wealth being created by the off-
13.11 Effects of Aggressive Accounting on Residual Income Valuation. Residual
income value estimates will not be distorted by aggressive accounting. The resid-
13.12 Appropriate Discount Rates. It is appropriate to use a required rate of return on
13.13 Computing Residual Income.
a. Required return on equity capital:
Chapter 13
Valuation: Earnings-Based Approach
13-4
b. Required Income:
13.14 Computing Residual Income.
a. Required return on equity capital:
Microsoft ……………… 4.0% + (0.96 × 5.0%) = 8.80%
Intel …………………….. 4.0% + (1.12 × 5.0%) = 9.60%
Chapter 13
Valuation: Earnings-Based Approach
13-5
© 2018 Cengage Learning®. May not be scanned, copied or duplicated, or posted to a publicly accessible website, in whole or in part.
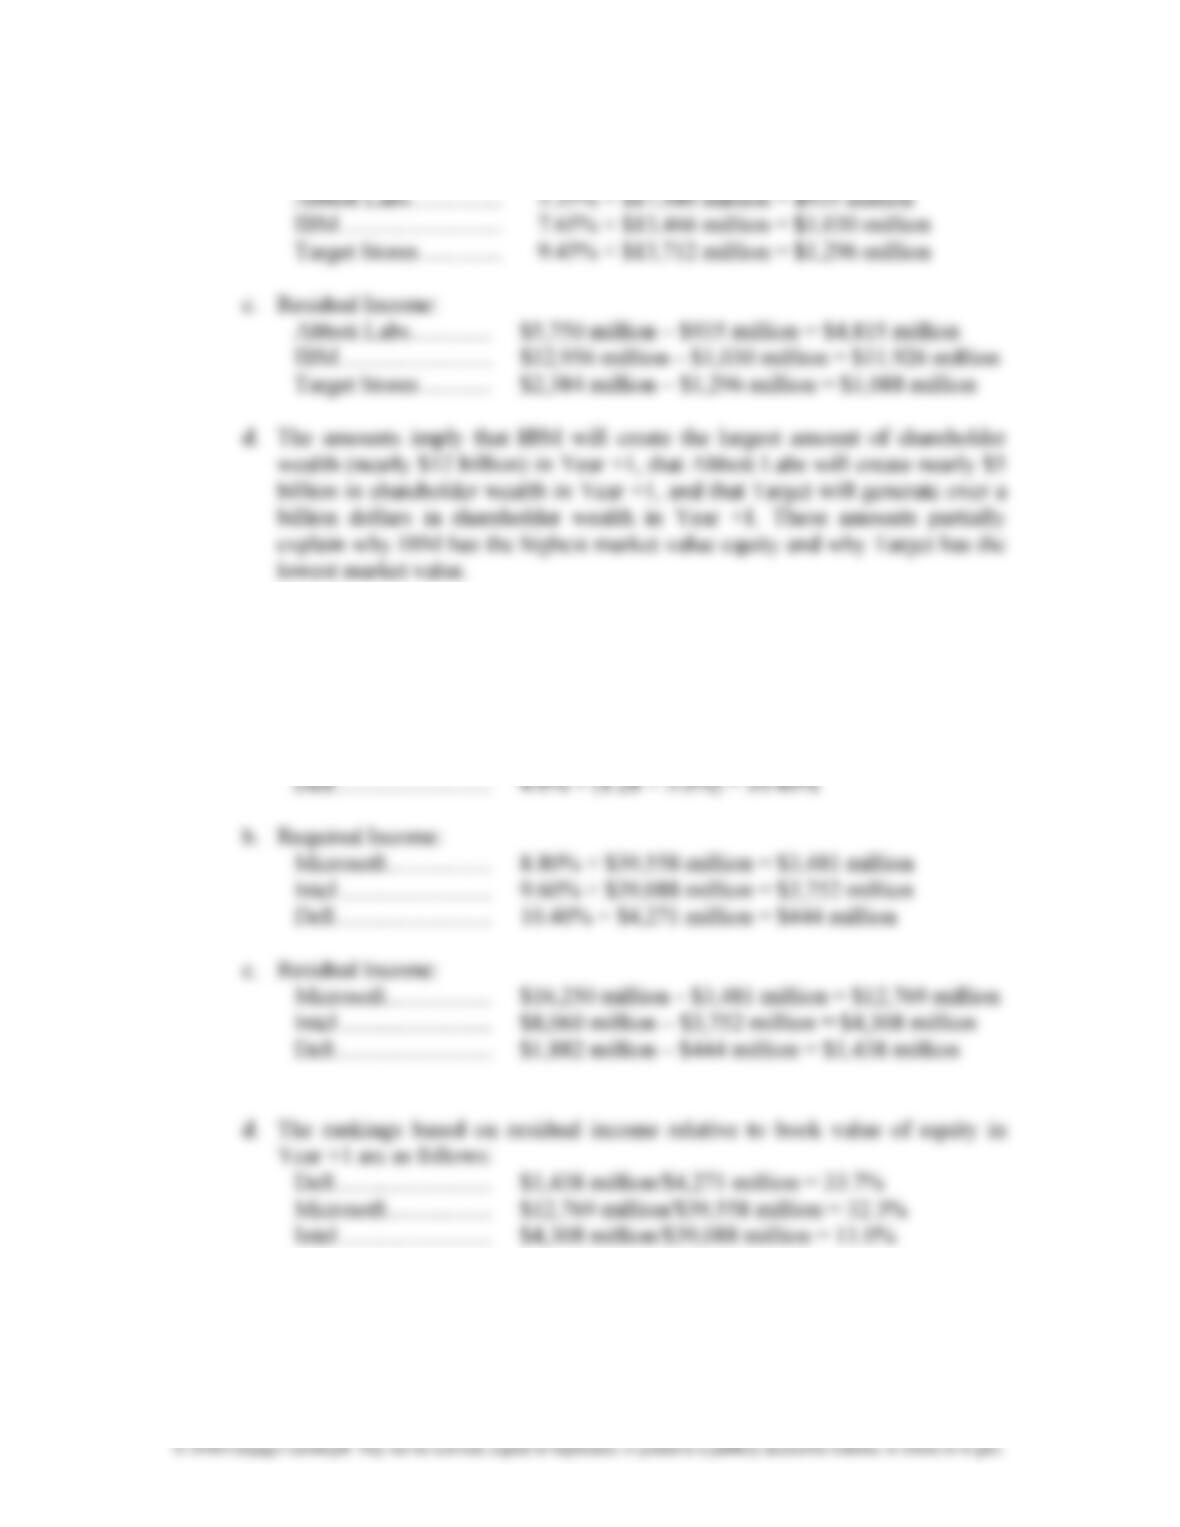
e. The residual income amounts imply that all three firms will create substantial
amounts of shareholder wealth in Year +1. Microsoft is the largest firm of the
set and will create the largest amount of shareholder wealth (nearly $13 billion)
in Year +1, whereas Intel will generate over $4 billion of shareholder wealth in
Year +1, and Dell will create over $1.4 billion in shareholder wealth in Year
+1. Even though this is the smallest dollar amount of residual income, Dell is
creating the highest residual ROCE. Microsoft has the largest book value of
equity of this set of firms and the largest residual income (at least in Year +1),
which partially explains why it has the largest market value of equity.
13.15 Computing Residual Income.
a. Required return on equity capital:
Southwest Airlines ….. 4.0% + (1.10 × 5.0%) = 9.50%
Kroger …………………… 4.0% + (0.35 × 5.0%) = 5.75%
Yum! Brands ………….. 4.0% + (1.04 × 5.0%) = 9.20%
Chapter 13
Valuation: Earnings-Based Approach
13-6
13.16 Equity Valuation Using the Residual Income Model.
Morrissey Tool Company:
a. Comprehensive Required Residual Present Value Present
Year Income Incomea Income Factor Value
+1 $213,948 $133,337 $80,611 0.89286 $ 71,974
Midyear Adjustment: $1,241,833 × [1 + (0.12/2)] …………………. $1,316,343
aAmounts equal 12% of common shareholders’ equity at the beginning of the
13-7
13.17 Equity Valuation Using the Residual Income and Dividend Discount Models.
Priority Contractors:
a. Comprehensive Required Residual Present Value Present
Year Income Incomea Income Factor Value
+1 $478,246 $266,928 $211,318 0.89286 $188,677
Midyear Adjustment: $2,791,877 × 1.06 ………………………………. $2,959,390
aAmounts equal 12% of common shareholders’ equity at the beginning of the
year. Common shareholders’ equity changed each year as follows:
Comprehensive
Year Start of Year + Income – Dividends = End of Year
0.05) × 0.56743]. The value after the midyear adjustment is $2,959,407. The
13-8
13.18 Equity Valuation Using the Residual Income, Free Cash Flow, and Dividend
Discount Models.
Steak n’ Shake (amounts in millions):
a. Net Required Residual Present Value Present
Year Income Incomea Income Factor Value
Book Value of Common Shareholders’ Equity,
Chapter 13
Valuation: Earnings-Based Approach
13-9
b. Present Value of Free Cash Flows to Common Equity Shareholders (amounts
in millions)
Cash Cash Cash Free Present
Flow Flow Flow (Inc.) Dec. Cash Value Present
Year Oper. Invest. Debt in Cash Flow Factor Value
c. The all-inclusive dividends to common shareholders are equal in amounts
13.19 Residual Income Valuation.
This is an extensive integrated problem that illustrates the topics of Chapter 13
Chapter 13
13-10
© 2018 Cengage Learning®. May not be scanned, copied or duplicated, or posted to a publicly accessible website, in whole or in part.
The FSAP file containing these analyses is available for download by instructors
(not students) from the book’s website for instructors. Go to Instructor’s resources
page at www.cengagebrain.com.
In this problem, we estimate cost of equity capital for Coca-Cola and use the
residual income valuation approach to estimate Coca-Cola’s share value. The
problem also asks students to run a bit of sensitivity analysis and make a recom–
mendation on Coca-Cola stock based on this analysis. The market equity beta for
Coca-Cola at the end of 2015 is 0.75. Assume that the risk-free interest rate is
3.0% and the market risk premium is 6.0%. Coca-Cola has 4,324 million shares
outstanding at the end of 2015, when Coca-Cola’s share price was $42.96.
Part I—Computing Coca-Cola’s Share Value Using the Residual Income
Valuation Approach.
b., c., d., and e.
Exhibit 13.A presents the excerpts from FSAP for the valuation of Coca-Cola
$35.49. You also can demonstrate for students that the dividends valuation
model in Chapter 11 leads to an identical value estimate. In addition, you can
Chapter 13
Valuation: Earnings-Based Approach
13-11
Chapter 13
Valuation: Earnings-Based Approach
13-12
b. Based on the 7.50% required rate of return on equity capital computed in Solu-
tion a, the projected residual income amounts in Years +1 to +6 are as follows:
Year +1 Year +2 Year +3 Year +4 Year +5 Year +6
13.10.
c. The data in Exhibit 13.A show that the sum of the present value of residual
(1) The sum of the present value of residual income is $122,362.2 million
($23,311.8 million + $99,050.3 million).
13-13
(2) Adding beginning book value of common shareholders’ equity indicates
(3) After adjusting the sum of the present value using the midyear discount-
(4) The per share value estimate for Coca-Cola, after dividing the total pre-
sent value by the 4,324 million shares outstanding, equals $35.49. This
amount is 17% below current share price of $42.96.
Part II—Sensitivity Analysis and Recommendation
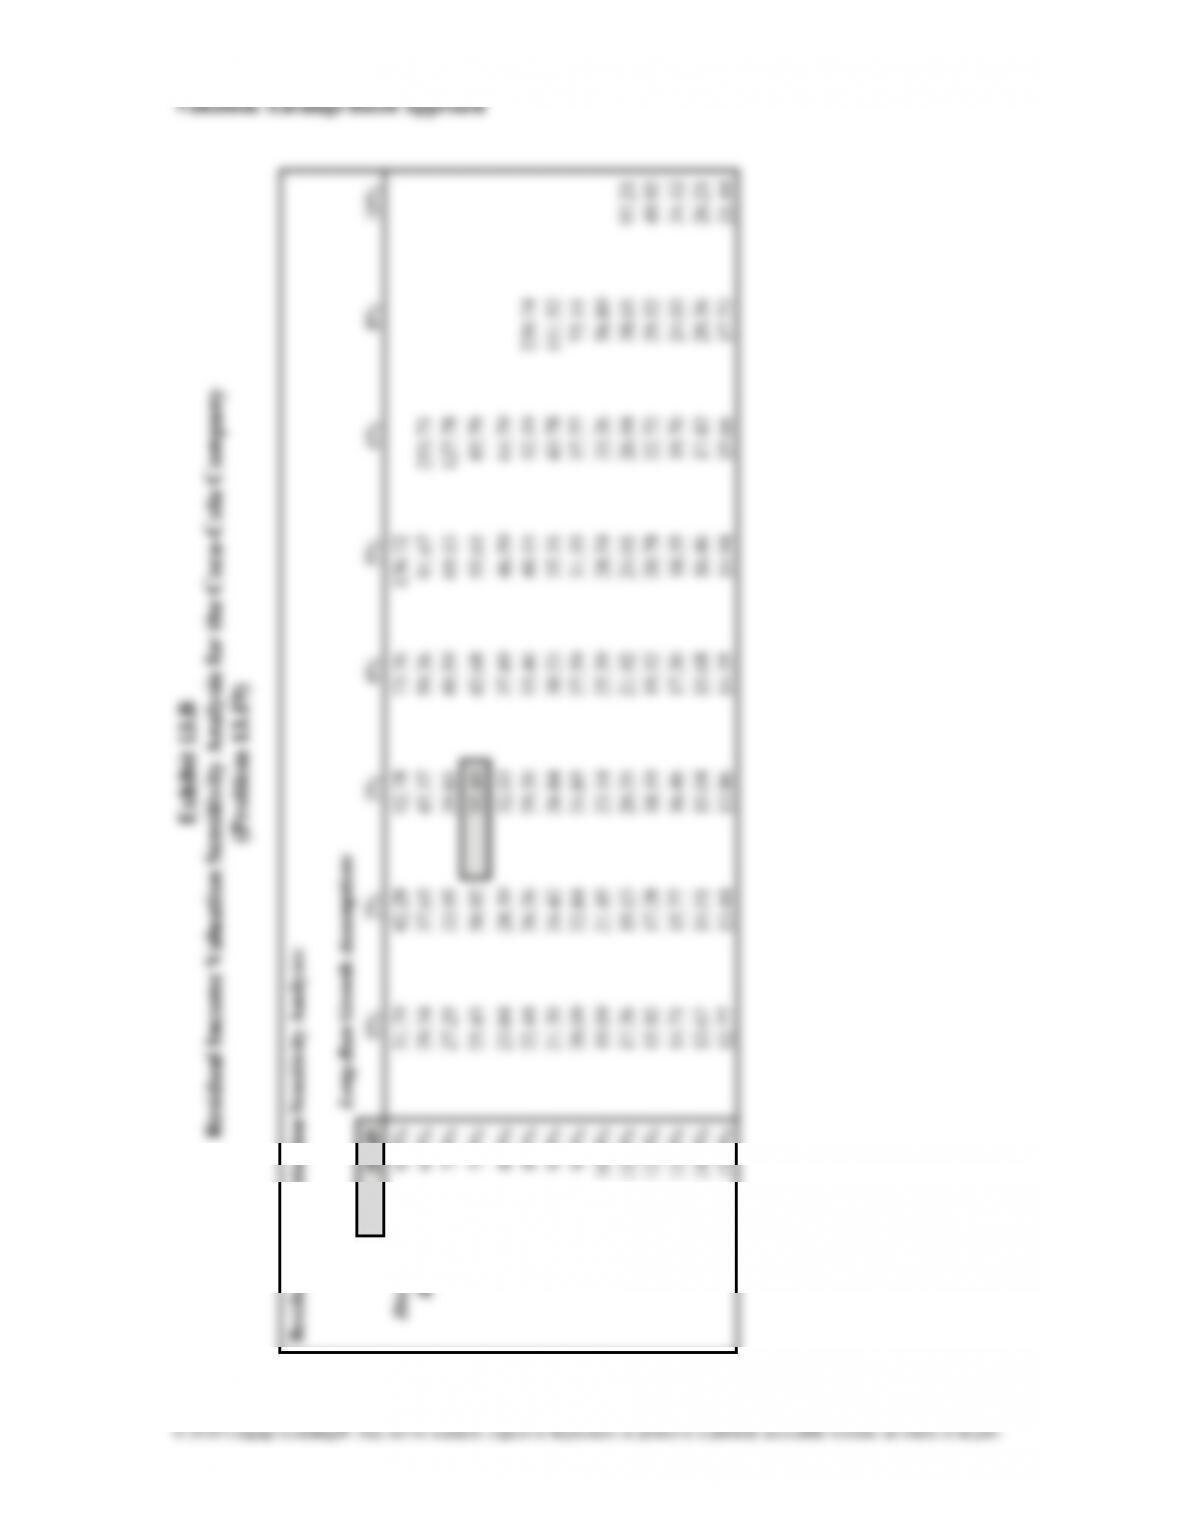
f. The data in Exhibit 13.B show the results of various sensitivity analysis sce-
narios, varying discount rates, and growth rates.
Scenario 1: If we assume that Coca-Cola’s long-run growth will be 2%, not
13-14
Chapter 13
Residual Income Valuation Sensitivity Analysis for the Coca-Cola Company
Residual Income Valuation Sensitivity Analysis:
Long-Run Growth Assumptions
35.49 0% 2% 3% 4% 5% 6% 8% 10%
Discount 6.0% 31.79 42.28 52.78 73.76 136.72
7.0% 27.25 33.95 39.81 49.59 69.13 127.78
7.5% 25.43 30.92 35.49 42.68 55.61 85.79
8.0% 23.84 28.39 32.03 37.49 46.59 64.79
8.5% 22.44 26.26 29.20 33.46 40.15 52.19 220.74
9.0% 21.20 24.42 26.84 30.23 35.31 43.78 111.52
9.5% 20.09 22.84 24.85 27.59 31.55 37.77 75.11
10.0% 19.09 21.45 23.14 25.39 28.54 33.26 56.89
11.0% 17.36 19.13 20.35 21.92 24.01 26.94 38.65 97.21
12.0% 15.92 17.28 18.19 19.32 20.78 22.72 29.52 49.92
13.0% 14.71 15.77 16.46 17.30 18.35 19.70 24.03 34.12
14.0% 13.67 14.51 15.04 15.68 16.46 17.43 20.36 26.21
15.0% 12.77 13.44 13.86 14.35 14.94 15.66 17.73 21.44
Chapter 13
Valuation: Earnings-Based Approach
13-15
Integrative Case 13.1 Walmart: Residual Income Valuation of Walmart’s Common
Equity
This is an extensive integrated case that connects the topics of Chapter 13 to those
by instructors (not students) from the book’s website for instructors. Go to In-
structor’s resources page at www.cengagebrain.com.
In this case, we estimate cost of equity capital for Walmart and use the
Part I—Computing Walmart’s Share Value Using the Residual Income Valua-
tion Approach.
a. Following the CAPM, Walmart faces a required rate of return on equity capi-
tal of 9.0% at the end of 2015. This rate is computed as follows:
13-16
Chapter 13
Valuation: Earnings-Based Approach
Chapter 13
Valuation: Earnings-Based Approach
13-17
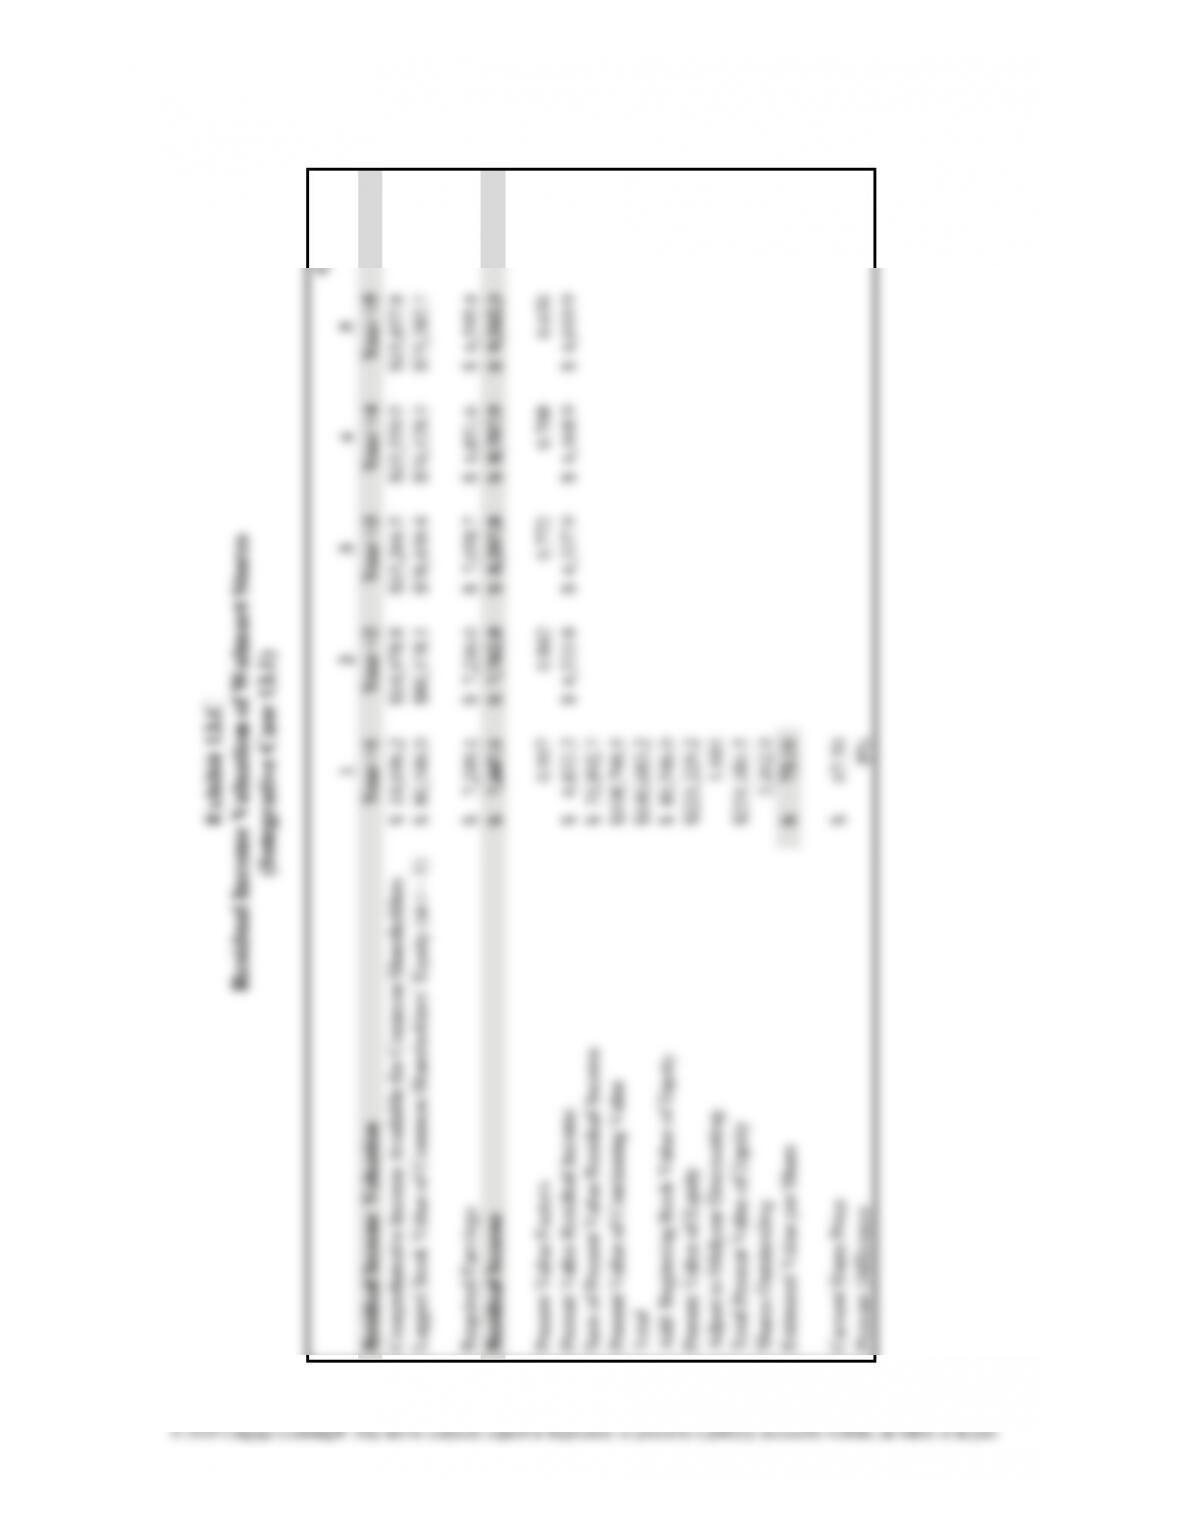
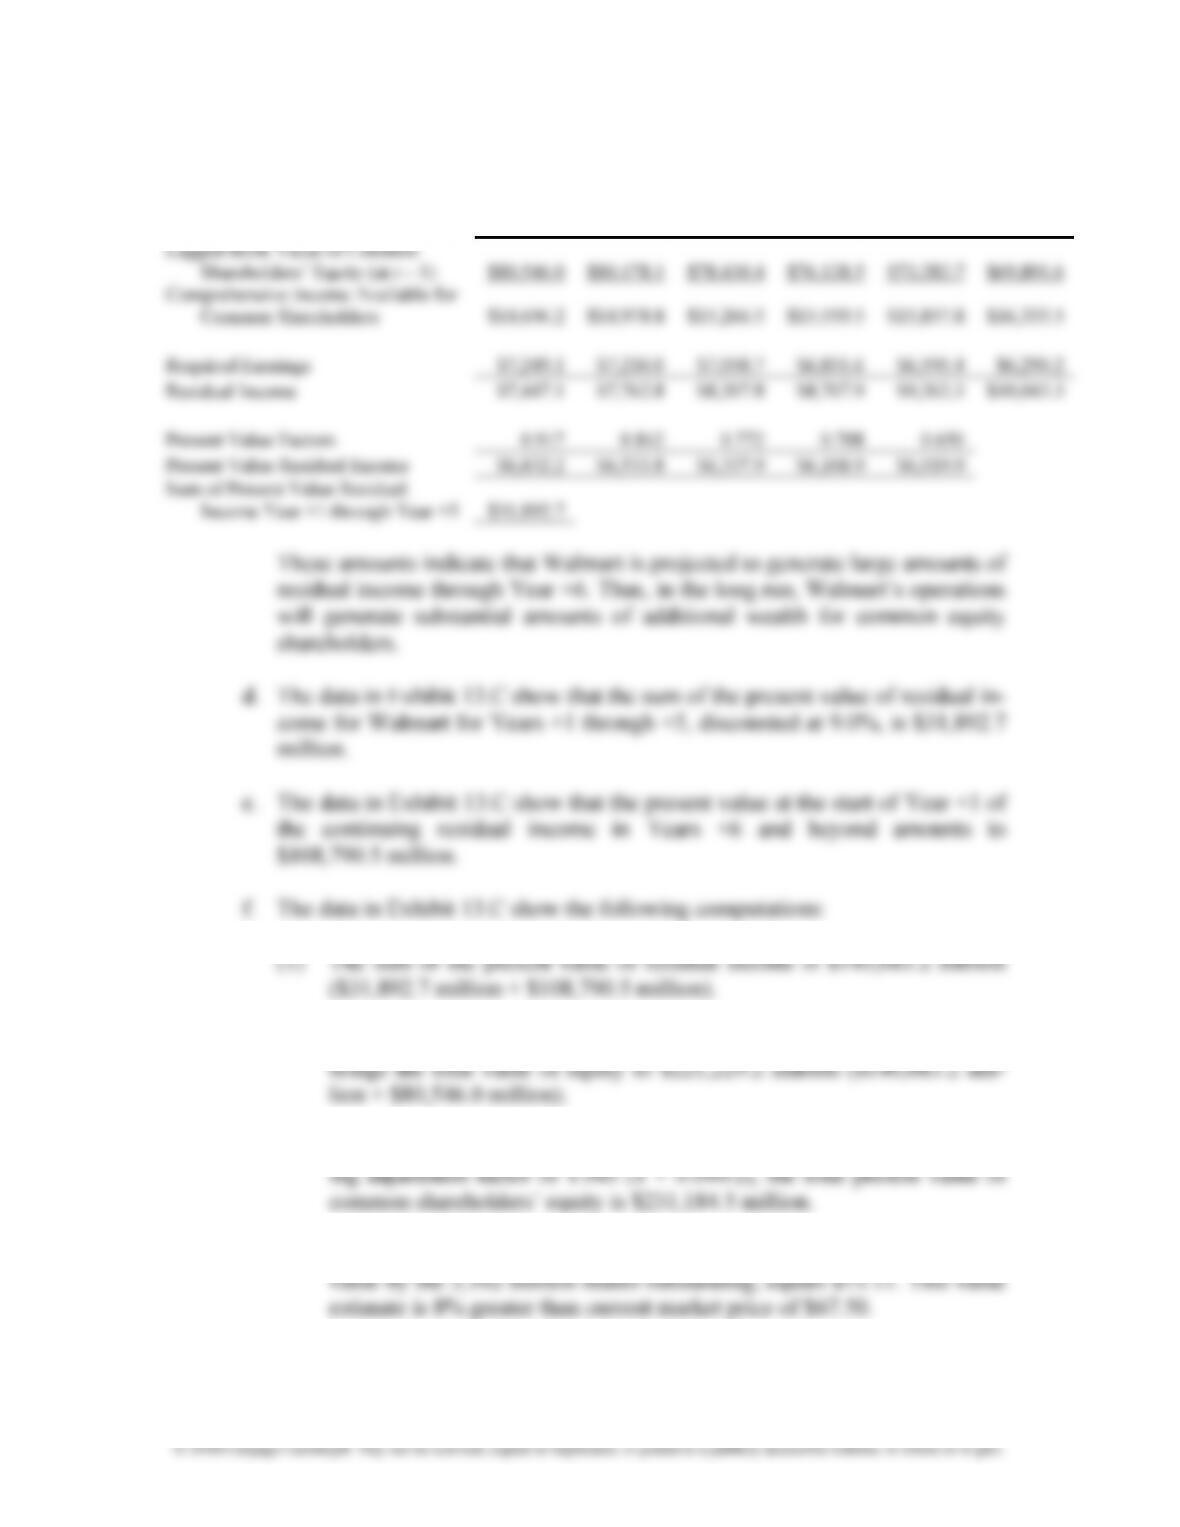
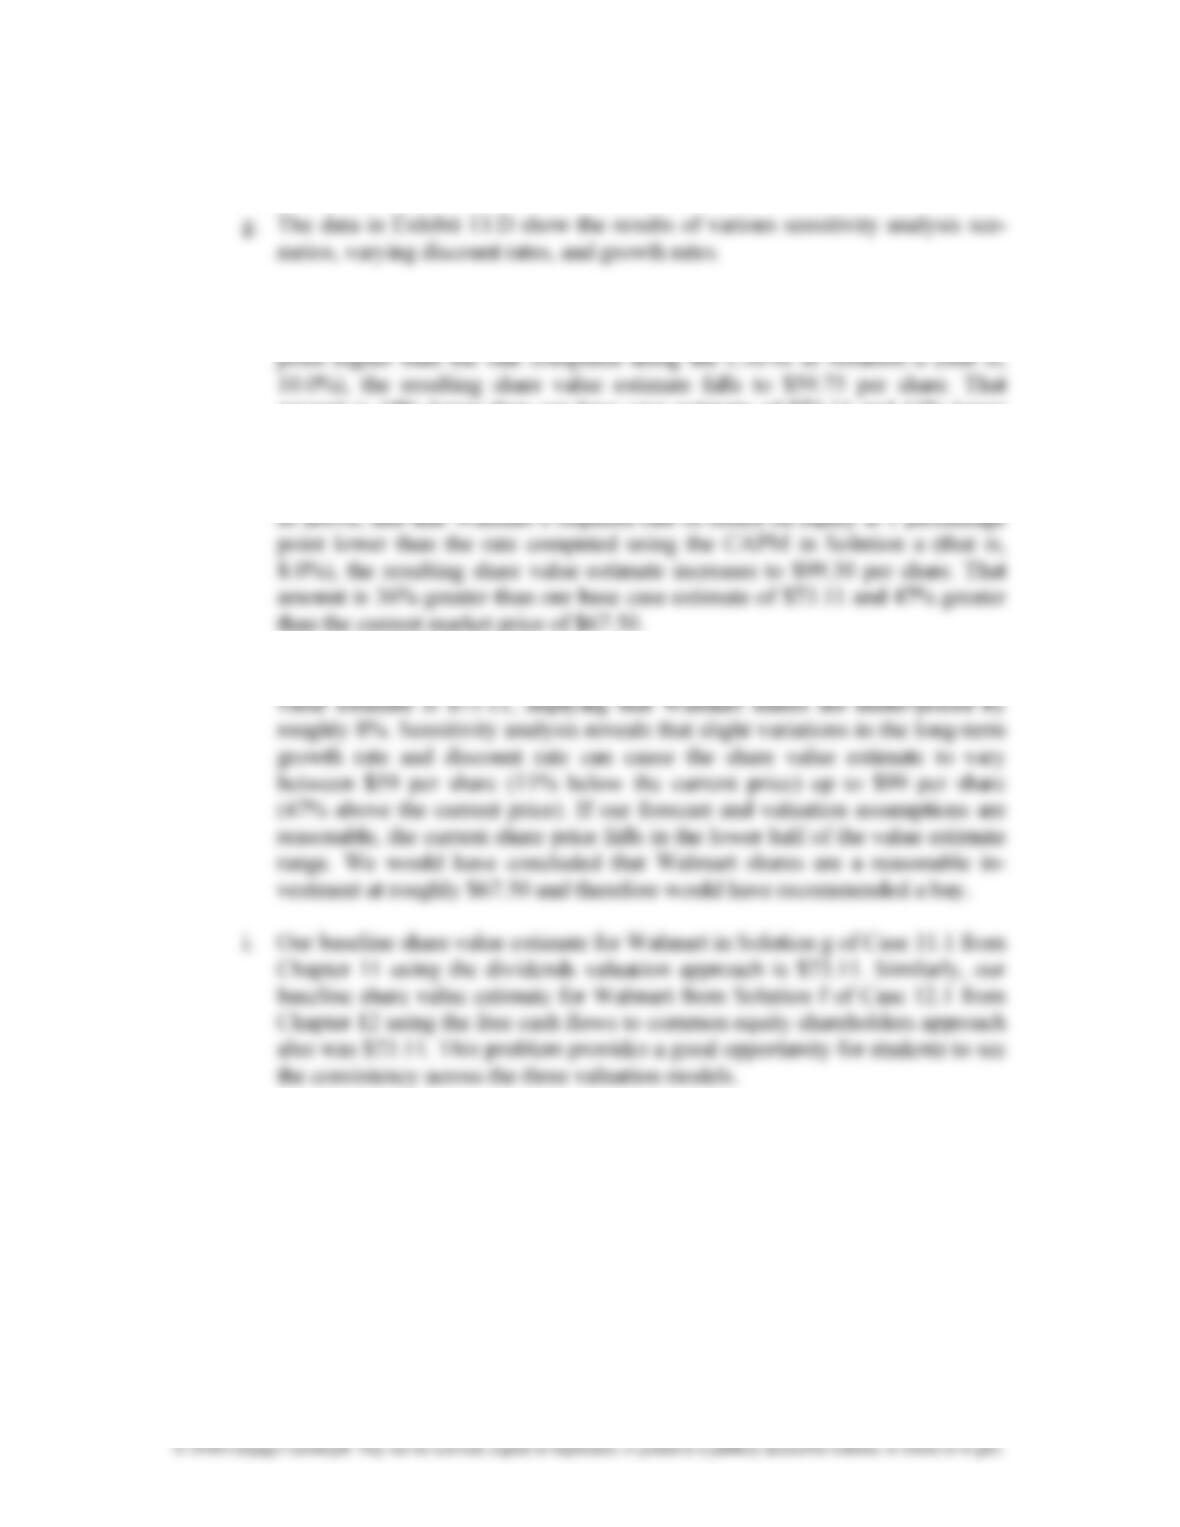
b. and c. Projected residual income amounts in Years +1 to +6 are as follows:
Residual Income Valuation Year +1 Year +2 Year +3 Year +4 Year +5 Year +6
(2) Adding the beginning book value of common shareholders’ equity
(3) After adjusting the sum of the present value using the midyear discount-
(4) The per share value estimate for Walmart, after dividing the total present
Chapter 13
Valuation: Earnings-Based Approach
13-18
Part II—Sensitivity Analysis and Recommendation
Scenario 1: If we assume that Walmart’s long-run growth will be 2%, not 3%
as above, and that Walmart’s required rate of return on equity is 1 percentage
amount is 18% lower than our base case estimate of $73.11 and 11% lower
than the current market price of $67.50.
Scenario 2: If we assume that Walmart’s long-run growth will be 4%, not 3%
h. At the start of Year +1, Walmart’s share price was $67.50. Our baseline share
Chapter 13
13-19
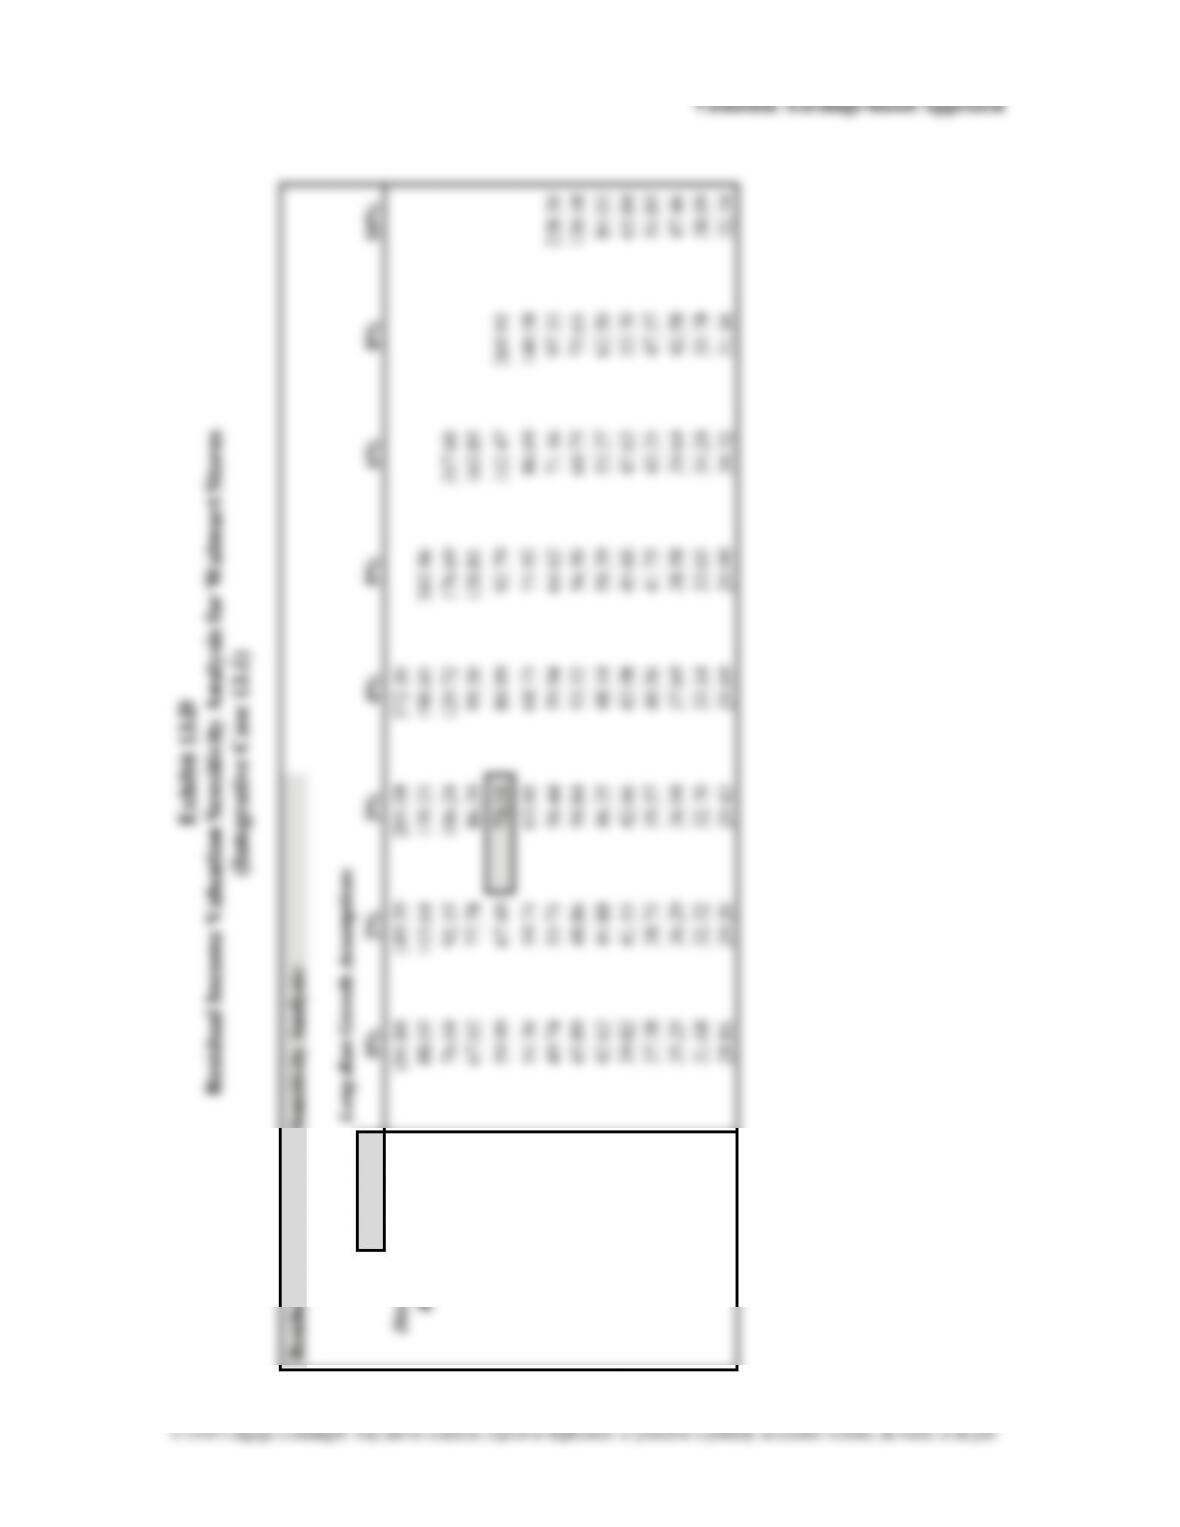
Residual Income Valuation Sensitivity Analysis for Walmart Stores
Residual Income Valuation Sensitivity Analysis:
Long-Run Growth Assumptions
73.11 0% 2% 3% 4% 5% 6% 8% 10%
Discount 5% 104.84 149.39 205.08 372.16
Rates: 6% 88.05 113.64 139.23 190.41 343.96
7% 76.04 92.15 106.24 129.72 176.69 317.60
8% 67.02 77.78 86.39 99.30 120.81 163.85
9% 59.99 67.49 73.11 80.99 92.79 112.47 269.91
10% 54.36 59.75 63.60 68.73 75.92 86.69 140.58
11% 49.74 53.71 56.44 59.94 64.62 71.16 97.33 228.20
12% 45.89 48.86 50.84 53.32 56.50 60.75 75.61 120.18
13% 42.62 44.88 46.35 48.14 50.39 53.27 62.50 84.03
14% 39.82 41.55 42.66 43.98 45.60 47.63 53.70 65.84
15% 37.38 38.73 39.57 40.56 41.75 43.21 47.37 54.85
16% 35.25 36.29 36.94 37.69 38.58 39.64 42.58 47.46
18% 31.68 32.32 32.70 33.14 33.65 34.24 35.78 38.09
20% 28.81 29.20 29.43 29.69 29.99 30.32 31.16 32.34

Chapter 13
Valuation: Earnings-Based Approach
This page is intentionally left blank