12-1
CHAPTER 12
VALUATION: CASH-FLOW-BASED APPROACHES
Solutions to Questions, Exercises, Problems, and Teaching Notes to Cases
12.1 Free Cash Flows. Cash flows are free if they are unencumbered and available to
be distributed to financial claims, such as debt, preferred, noncontrolling interests,
and common equity shares. Cash flows are not free if it is necessary for the firm
12.2 Free-Cash-Flows Valuation Approach. The theory behind the free-cash-flows
valuation approach is that these cash flows are ultimately distributable to common
12.3 Valuation Approach Equivalence. Valuation based on dividends and valuation
based on the free cash flows for common equity shareholders should yield
12.4 Measuring Value-Relevant Free Cash Flows. When the firm borrows cash by
issuing debt, it increases free cash flows for common equity shareholders that
Chapter 12
Valuation: Cash-Flow-Based Approaches
12-2
12.5 Measuring Value-Relevant Free Cash Flows. When the firm uses marketable
securities to manage operating liquidity and then uses cash to purchase
12.6 Valuation When Free Cash Flows Are Negative. Healthy, growing, profitable
firms commonly project negative free cash flows for equity shareholders for a
number of years as they invest cash in acquiring assets and growing the business.
12.7 Using Different Free-Cash-Flows-Based Approaches. Analysts should use free
cash flows for all debt and equity stakeholders when valuing the operating assets
of an entity or all financial claims on the entity. In settings such as those, the
12.8 Appropriate Discount Rates. The analyst should use a required rate of return on
equity capital as a discount rate when valuing the equity in a firm or a share of
12.9 Free Cash Flows and Discount Rates. Firms that are financed with all common
equity capital (no debt, preferred stock, or noncontrolling interests) are obvious
12-3
12.10 Calculating Free Cash Flows.
Free cash flows for 3M for 2013 through 2015 were as follows: (amounts in
millions; allow for rounding)
a. Free cash flows for all debt and equity stakeholders:
2015 2014 2013
b. Free cash flows for common equity shareholders:
Chapter 12
Valuation: Cash-Flow-Based Approaches
12-4
12.11 Calculating Free Cash Flows.
Free cash flows for Dick’s Sporting Goods for fiscal years ending in 2016, 2015,
and 2014 were as follows: (amounts in thousands)
a. Free cash flows for all debt and equity stakeholders:
2016 2015 2014
Equity Stakeholders ……………………… $ 375,973 $ 262,720 $ 229,644
b. Free cash flows for common equity shareholders:
2016 2015 2014
c. Dick’s Sporting Goods sources of free cash flows from common equity
shareholders:
Chapter 12
12-5
© 2018 Cengage Learning®. May not be scanned, copied or duplicated, or posted to a publicly accessible website, in whole or in part.
d. In each of these three years, the free cash flows to all debt and equity capital
stakeholders differ from the free cash flows to common equity shareholders
because Dick’s Sporting Goods is relying on short-term borrowing through
bank overdrafts to meet short-term liquidity needs.
12.12 Valuing a Leveraged Buyout Candidate. (dollar amounts in millions)
May Department Stores:
X = 0.61
b. Revised Equity Beta:
Revised Cost of Equity Capital:
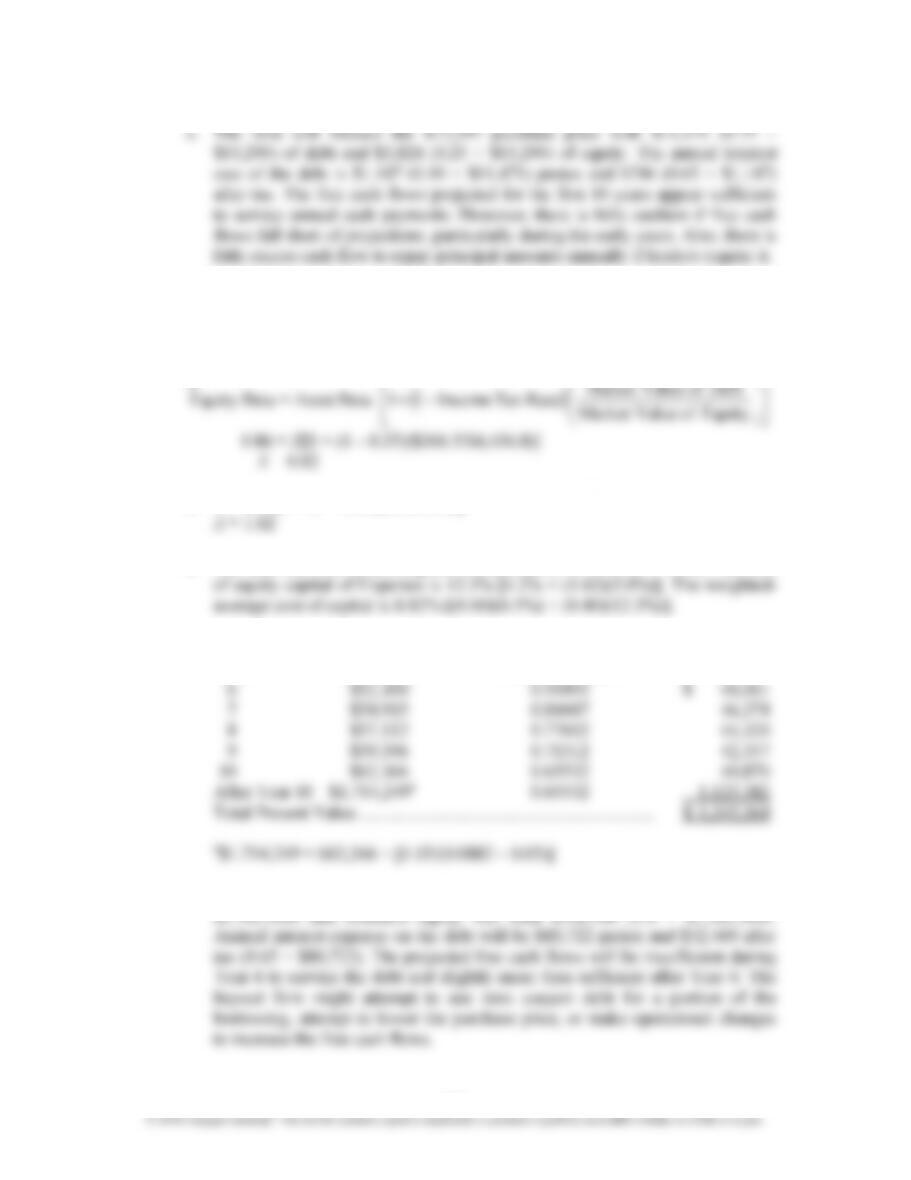
d. Free Present Value Factor Present
Year Cash Flow at 8.175% Value
Chapter 12
Valuation: Cash-Flow-Based Approaches
12-6
© 2018 Cengage Learning®. May not be scanned, copied or duplicated, or posted to a publicly accessible website, in whole or in part.
e. The firm will finance the $15,295 purchase price with $11,471 (0.75 ×
$15,295) of debt and $3,824 (0.25 × $15,295) of equity. The annual interest
cost of the debt is $1,147 (0.10 × $11,471) pretax and $746 (0.65 × $1,147)
after tax. The free cash flows projected for the first 10 years appear sufficient
to service annual cash payments. However, there is little cushion if free cash
flows fall short of projections, particularly during the early years. Also, there is
little excess cash flow to repay principal amounts annually if lenders require it.
12.13 Valuing a Leveraged Buyout Candidate. (dollar amounts in thousands)
Experian:
a.
b. X = 0.82[1 + (1 – 0.35)(0.60/0.40)]
c. The after-tax cost of debt capital of Experian is 6.5% (0.65 × 10%). The cost
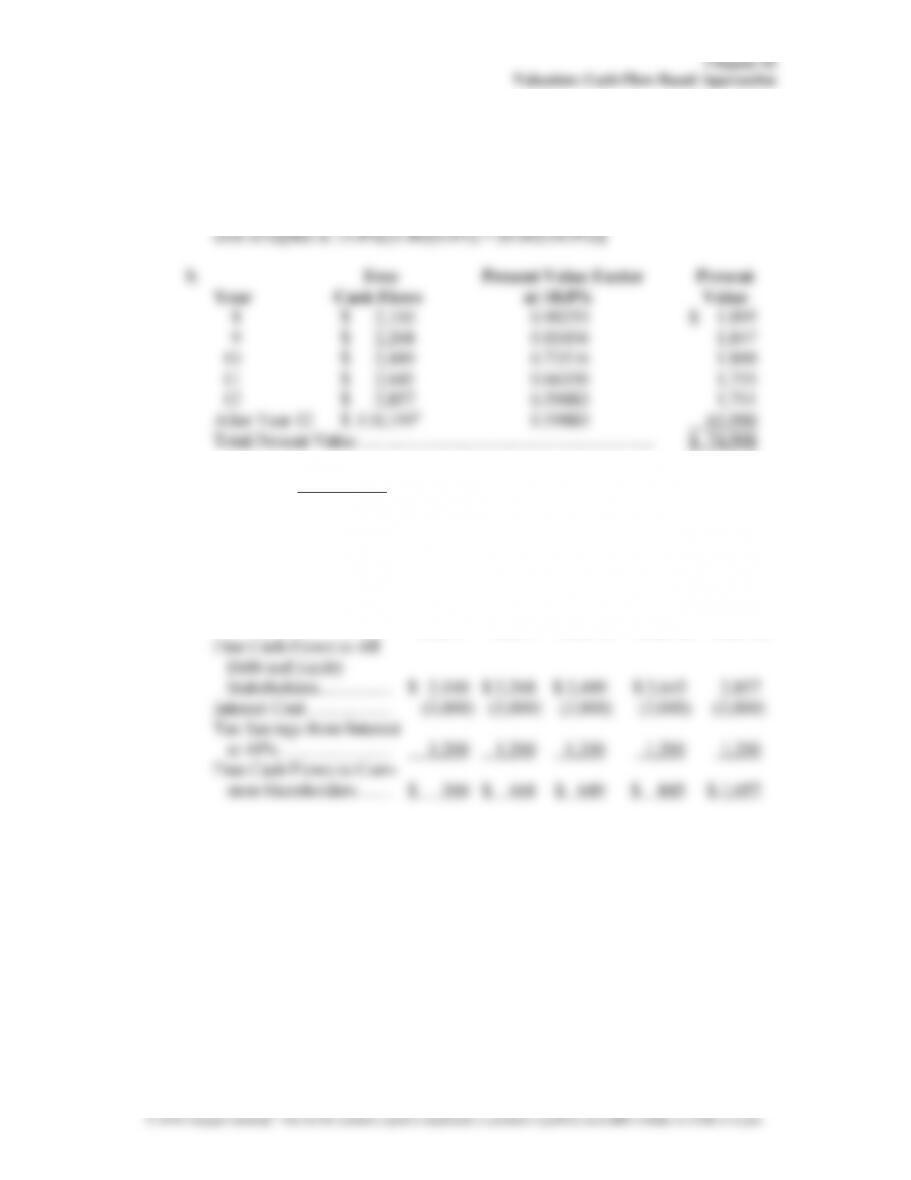
d. Free Present Value Present
Year Cash Flows Factor at 8.82% Value
e. At a total purchase price of $1,345,364, debt will total $807,218 (0.6 ×
$1,345,364) and common equity will total $538,146 (0.4 × $1,345,364).
Annual interest expense on the debt will be $80,722 pretax and $52,469 after
tax (0.65 × $80,722). The projected free cash flows will be insufficient during
Year 6 to service the debt and slightly more than sufficient after Year 6. The
buyout firm might attempt to use zero coupon debt for a portion of the
borrowing, attempt to lower the purchase price, or make operational changes
to increase the free cash flows.
DebtofValueMarket
⎤
⎡⎟
⎞
⎛
12-7
12.14 Applying Various Present Value Approaches to Valuation. (dollar amounts in
millions; allow for rounding)
Wedgewood Products:
a. The after-tax cost of debt is 6.0% [(1 – 0.40)(10.0%)]. The weighted-average
a
c. The $74,998 purchase price will be financed with $29,999 (0.40 × $74,998) of
debt and $44,999 (0.60 × $74,998) of common equity. The pretax interest cost
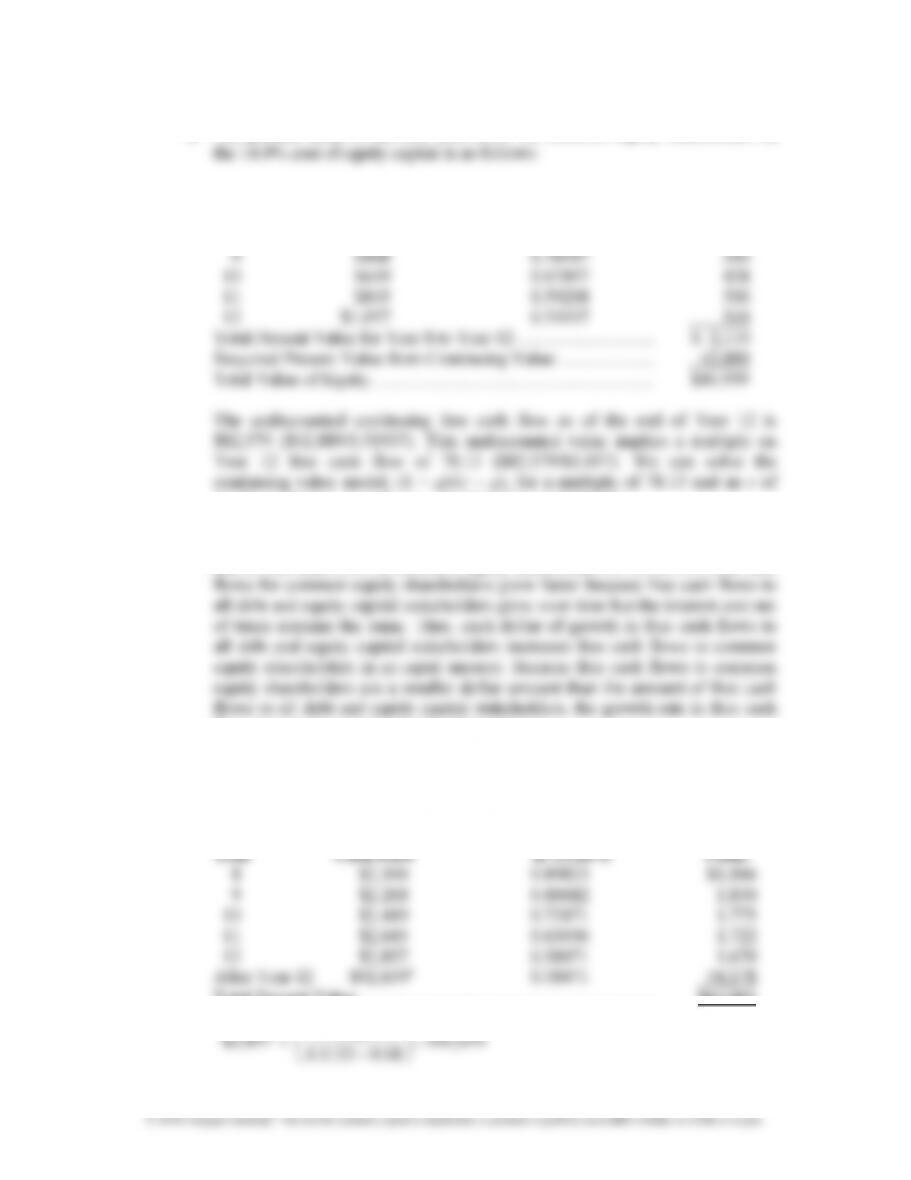
on the debt is $3,000 (0.10 × $29,999). The cash flows are as follows:
Year 8 Year 9 Year 10 Year 11 Year 12
$110,199
0.08 0.108
1.08
$2,857 =
⎟
⎠
⎞
⎜
⎝
⎛
−
×
Chapter 12
Valuation: Cash-Flow-Based Approaches
12-8
d. The present value of the free cash flows for common equity shareholders at
Free Present Value Factor Present
Year Cash Flows at 14.0% Value
8 $300 0.87719 $ 263
14.0% to obtain a growth rate, or value of g, of 12.5616%.
e. The growth in free cash flows to all debt and equity capital stakeholders is 8%
and in free cash flows to common equity shareholders is 12.5616%. Free cash
flows to common equity shareholders is larger.
f. Present Value of Free Cash Flows to All Debt and Equity Capital Stakeholders
at Unlevered Cost of Equity:
Free Present Value Factor Present
Total Present Value …………………………………………………………. $63,061
a
1.08
⎞
⎛
Chapter 12
Valuation: Cash-Flow-Based Approaches
Present Value of Tax Savings from Interest Deductions
12.15 Valuing the Equity of a Privately Held Firm.
Massachusetts Stove Company:
a.
Best Case Likely Case Worst Case No-Gas Case
Cash Present Cash Present Cash Present Cash Present
Year Flow Value Flow Value Flow Value Flow Value
8 $73,967 $65,141 $47,034 $41,421 $3,027 $2,666 $162,455 $143,069
9 52,143 40,441 (3,120) (2,420) (84,800) (65,769) 132,708 102,926
b. The most likely scenario provides a value for MSC that is more than three
12.16 Free-Cash-Flows-Based Valuation. This is an extensive integrated problem
Chapter 12
Valuation: Cash-Flow-Based Approaches
12-10
© 2018 Cengage Learning®. May not be scanned, copied or duplicated, or posted to a publicly accessible website, in whole or in part.
from the book’s website for instructors. Go to instructor’s resources page at
www.cengage.brain.com.
In this problem, you must estimate cost of equity capital for Coca-Cola and
use both free-cash-flows-based valuation approaches to estimate Coca-Cola’s
share value. The problem also requires a bit of sensitivity analysis and making a
recommendation about Coca-Cola stock based on this analysis. The market equity
beta for Coca-Cola at the end of 2015 is 0.75. Coca-Cola has 4,324 million shares
outstanding at the end of 2015, at which time the KO share price was $42.96.
Part I.—Computing Coca-Cola’s Share Value Using Free Cash Flows to
Common Equity Shareholders
a. Following the CAPM, Coca-Cola faces a required rate of return on equity
= 7.50%
b., c., d., and e.
Exhibit 12.A presents the excerpts from FSAP for the valuation of Coca-Cola
based on projected free cash flows to common equity. The first rows of the
Chapter 12
© 2018 Cengage Learning®. May not be scanned, copied or duplicated, or posted to a publicly accessible website, in whole or in part.
Exhibit 12.A
Free-Cash-Flows-Based Valuation of The Coca-Cola Company
(amounts in millions except per share amounts)
(Problem 12.16)
Continuing
1 2 3 4 5 Value
Free Cash Flows for Common Equity Year +1 Year +2 Year +3 Year +4 Year +5 Year +6
Net CFs – Pref. Stock and Noncontrolling Interests (31.5) (31.5) (31.5) (31.5) (31.5) (26.1)
Free Cash Flow for Common Equity $ 6,445.4 $ 6,990.9 $ 7,272.4 $ 7,572.0 $ 7,879.6 $ 7,678.6
Valuation: Cash-Flow-Based Approaches
12-12
b. Projected free cash flows for common equity shareholders in Years +1 to +6
are as follows:
Free Cash Flows for Common Equity Year +1 Year +2 Year +3 Year +4 Year +5 Year +6
Net Cash Flow from Operations $10,884.5 $ 9,902.7 $10,357.3 $ 10,810.3 $11,278.1 $ 9,477.3
Free Cash Flow for Common Equity $ 6,445.4 $ 6,990.9 $ 7,272.4 $ 7,572.0 $ 7,879.6 $ 7,678.6
d. The data in Exhibit 12.A show that the present value at the start of Year +1 of
e. The data in Exhibit 12.A show the following computations:
Chapter 12
Valuation: Cash-Flow-Based Approaches
12-13
Part II—Computing Coca-Cola’s Share Value Using Free Cash Flows to All
Debt and Equity Stakeholders
f. Coca-Cola’s capital structure at the end of 2015 consists of the following
amounts and proportions:
Amount Weight
g., h., i., and j.
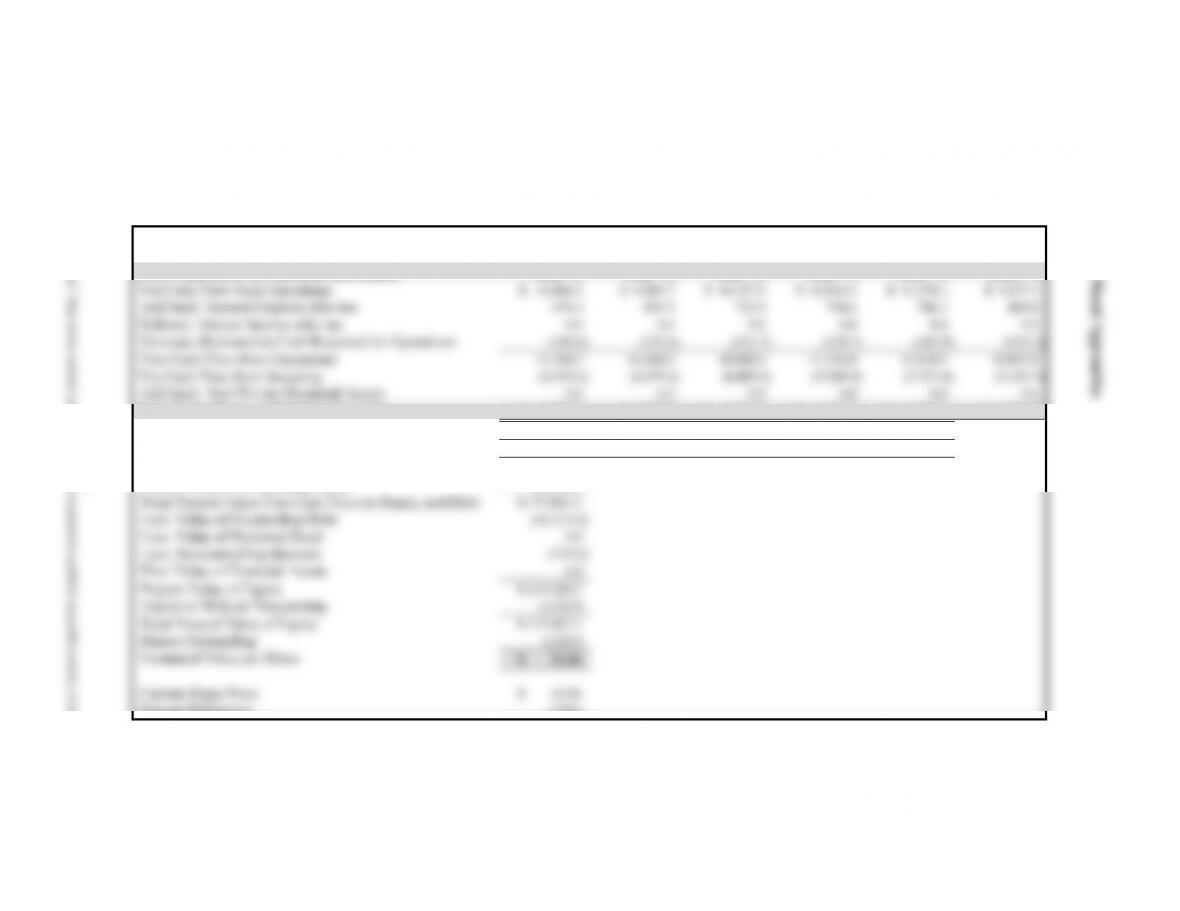
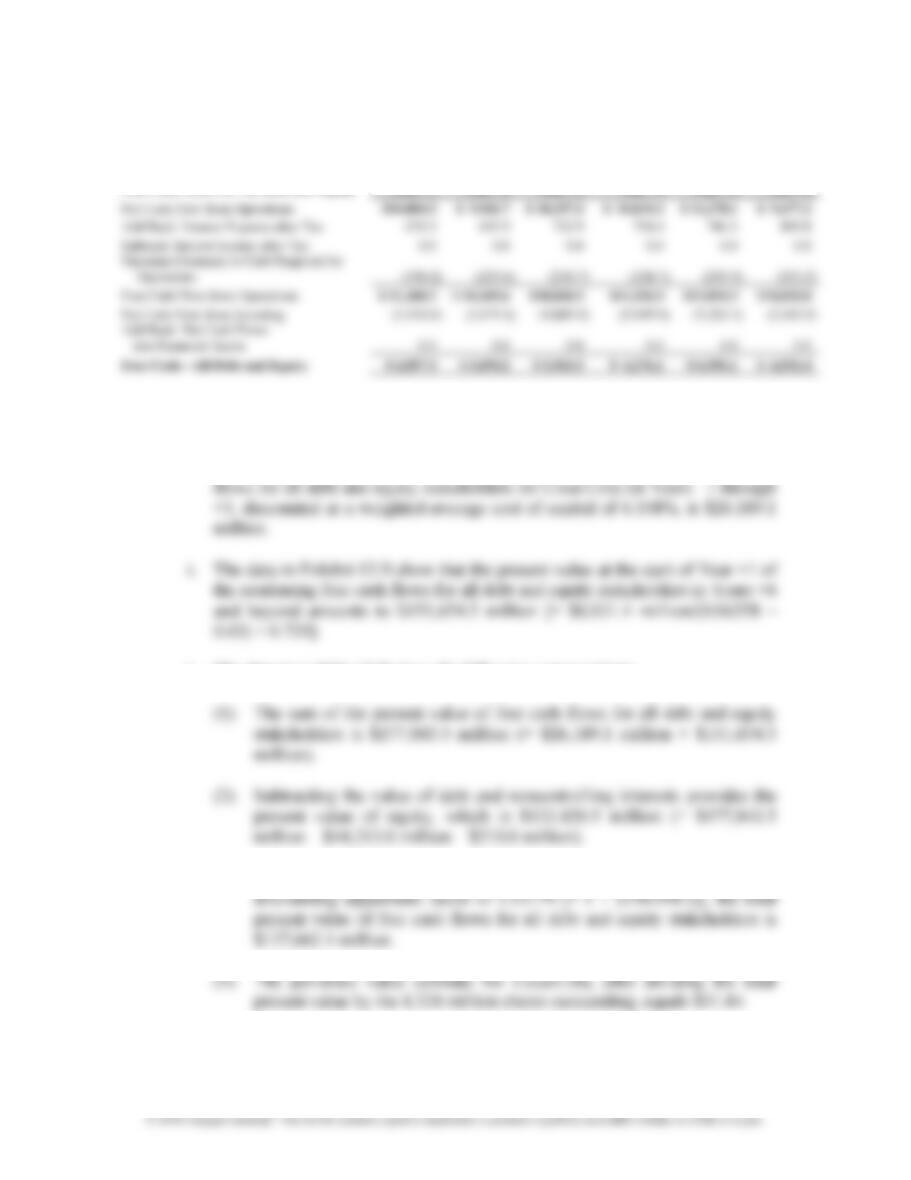
Exhibit 12.B presents the excerpts from FSAP for the valuation of Coca-Cola
In computing weighted average cost of capital in Part f, we determined the
weight of equity using the market price of Coca-Cola’s stock at the time. Our
12-14
© 2018 Cengage Learning®. May not be scanned, copied or duplicated, or posted to a publicly accessible website, in whole or in part.
Chapter 12
Valuation: Cash-Flow-Based Approaches
Exhibit 12.B
Free-Cash-Flows-Based Valuation of The Coca-Cola Company
(amounts in millions except per share amounts)
(Problem 12.16)
Continuing
1 2 3 4 5 Value
Free Cash Flows for All Debt and Equity Year +1 Year +2 Year +3 Year +4 Year +5 Year +6
Free Cash Flows – All Debt and Equity $ 6,857.5 $ 5,694.2 $ 5,963.5 $ 6,276.1 $ 6,596.1 $ 6,931.4
Present Value Factors 0.940 0.884 0.831 0.781 0.735
Present Value Free Cash Flows $ 6,447.6 $ 5,033.7 $ 4,956.6 $ 4,904.6 $ 4,846.5
Sum of Present Value Free Cash Flows $ 26,189.1
Present Value of Continuing Value 151,654.5
Percent Difference (26%)
Chapter 12
Valuation: Cash-Flow-Based Approaches
12-15
g. Projected amounts of free cash flows for all debt and equity stakeholders in
Years +1 through +6 are as follows:
Free Cash Flows for All Debt and Equity Year +1 Year +2 Year +3 Year +4 Year +5 Year +6
As noted above for Part b, the cash flow amounts indicate that Coca-Cola is a
cash cow.
h. The data in Exhibit 12.B show that the sum of the present value of free cash
j. The data in Exhibit 12.B show the following computations:
(3) After adjusting the sum of the present value using the midyear
Chapter 12
Valuation: Cash-Flow-Based Approaches
12-16
Part III—Sensitivity Analysis and Recommendation
k. The data in Exhibit 12.C show the results of various sensitivity analysis
Chapter 12
© 2018 Cengage Learning®. May not be scanned, copied or duplicated, or posted to a publicly accessible website, in whole or in part.
Exhibit 12.C
Free-Cash-Flows-Based Valuation of The Coca-Cola Company
(Problem 12.16)
Free Cash Flows Valuation Sensitivity Analysis:
Long-Run Growth Assumptions
35.49 0.0% 1.0% 2.0% 2.5% 3.0% 3.5% 4.0% 5.0%
Chapter 12
Valuation: Cash-Flow-Based Approaches
12-18
Integrative Case 12.1: Wal-Mart [LOs 2,3,4,5]
Free-Cash-Flows-Based Valuation of Walmart’s Common Equity. This is an
extensive, integrated case that connects all of the topics of the text. In this portion of the
instructor’s resources page at www.cengage.com/accounting/wahlen.
In Integrative Case 10.1, we projected financial statements for Walmart for Years +1
through +5. In this portion of the Integrative Case, we apply the techniques in Chapter 12
Part I—Computing Walmart’s Share Value Using Free Cash Flows to Common
Equity Shareholders
a. Following the CAPM, Walmart faces a required rate of return on equity capital of
9.0% at the end of Year 4. This rate is computed as follows:
= 9.0%
b., c., d., e., and f.
Exhibit 12.D presents the excerpts from FSAP for the valuation of Walmart based on
Chapter 12
Valuation: Cash-Flow-Based Approaches
12-19
b. Projected free cash flows for common equity shareholders in Years +1 to +5 are as
follows:
Year +1 Year +2 Year +3 Year +4 Year +5
c. Projected free cash flows for common equity shareholders in Year +6 are as follows:
Year +6
d. The data in Exhibit 12.D show that the sum of the present value of free cash flows for
12-20
© 2018 Cengage Learning®. May not be scanned, copied or duplicated, or posted to a publicly accessible website, in whole or in part.
Chapter 12
Valuation: Cash-Flow-Based Approaches
Exhibit 12.D
Free-Cash-Flows-Based Valuation of Walmart Stores
(amounts in millions except per share amounts)
(Integrative Case 12.1)
Continuing
1 2 3 4 5 Value
Free Cash Flows for Common Equity Year +1 Year +2 Year +3 Year +4 Year +5 Year +6
Net CFs – Pref. Stock and Noncontrolling Interests (386.2) (386.2) (386.2) (386.2) (386.2) (305.8)
Free Cash Flows for Common Equity $ 15,064.1 $ 16,726.5 $ 17,568.5 $ 18,405.3 $ 19,248.9 $ 14,236.8