© 2018 Cengage Learning®. May not be scanned, copied or duplicated, or posted to a publicly accessible website, in whole or in part.
Exhibit 10.E
Walmart Stores—Revised Balance Sheet Forecasts (Integrative Case 10.1) (amounts in millions)
Actuals Forecasts
2013 2014 2015 Year +1 Year +2 Year +3 Year +4 Year +5 Year +6
BALANCE SHEET
Current Assets 61,185 63,278 60,239 61,383 62,437 63,512 64,608 65,726 67,698
common size 29.9% 31.1% 30.2% 30.5% 30.8% 31.3% 31.8% 32.4% 32.4%
© 2018 Cengage Learning®. May not be scanned, copied or duplicated, or posted to a publicly accessible website, in whole or in part.
Actuals Forecasts
2013 2014 2015 Year +1 Year +2 Year +3 Year +4 Year +5 Year +6
LIABILITIES:
Accounts payable 37,415 38,410 38,487 38,503 39,261 40,047 40,847 41,664 42,914
rate of change (100.0%) Assume no additional discontinued operations.
Current Liabilities 69,345 65,253 64,619 65,218 66,572 67,967 69,392 70,848 72,973
Forecasting Financial Statements
10-23
rate of change (0.6%) (1.9%) 0.9% 0.6% 0.3% 0.1% (0.1%) 3.0%
Check figures: Balance Sheet A=L+OE? 0 0 0 0 0 0 0 0
Initial adjustment needed to balance the balance sheet:
(4,955) (6,501) (7,224) (7,940) (8,660) (3,330)
Dividends and share repurchases forecasts:
Common dividends: (6,172) (6,291) (6,412) (6,535) (6,660) (6,860)
(42.0%) (42.0%) (42.0%) (42.0%) (42.0%)
Assume dividend payout of net income.
Share repurchases (4,000) (4,000) (4,000) (4,000) (4,000) (4,120)
(4,000) (4,000) (4,000) (4,000) (4,000)
© 2018 Cengage Learning®. May not be scanned, copied or duplicated, or posted to a publicly accessible website, in whole or in part.
Exhibit 10.F
Walmart Stores—Revised Statement of Cash Flows Forecasts (Integrative Case 10.1) (amounts in millions)
Actuals Forecasts
Net Cash Flows from Operations 24,176 21,796 24,406 26,032 26,837 27,636 28,440 20,961
<Increase> Decrease in property, plant, & equip. at cost (3,956) (5,420) (10,000) (10,000) (10,000) (10,000) (10,000) (7,142)
Increase <Decrease> in common stock + paid in capital 100 (663) 64 66 68 70 72 74
Increase <Decrease> in accum. OCI (4,172) (4,429) 0 0 0 0 0 0
Increase <Decrease> in treasury stock and other equity adjs. 0 0 0 0 0 0 0 0
Dividends (7,152) (10,450) (15,128) (16,792) (17,636) (18,475) (19,321) (14,311)
Increase <Decrease> in noncontrolling interests (1,277) (1,864) (386) (386) (386) (386) (386) (306)
10-25
© 2018 Cengage Learning®. May not be scanned, copied or duplicated, or posted to a publicly accessible website, in whole or in part.
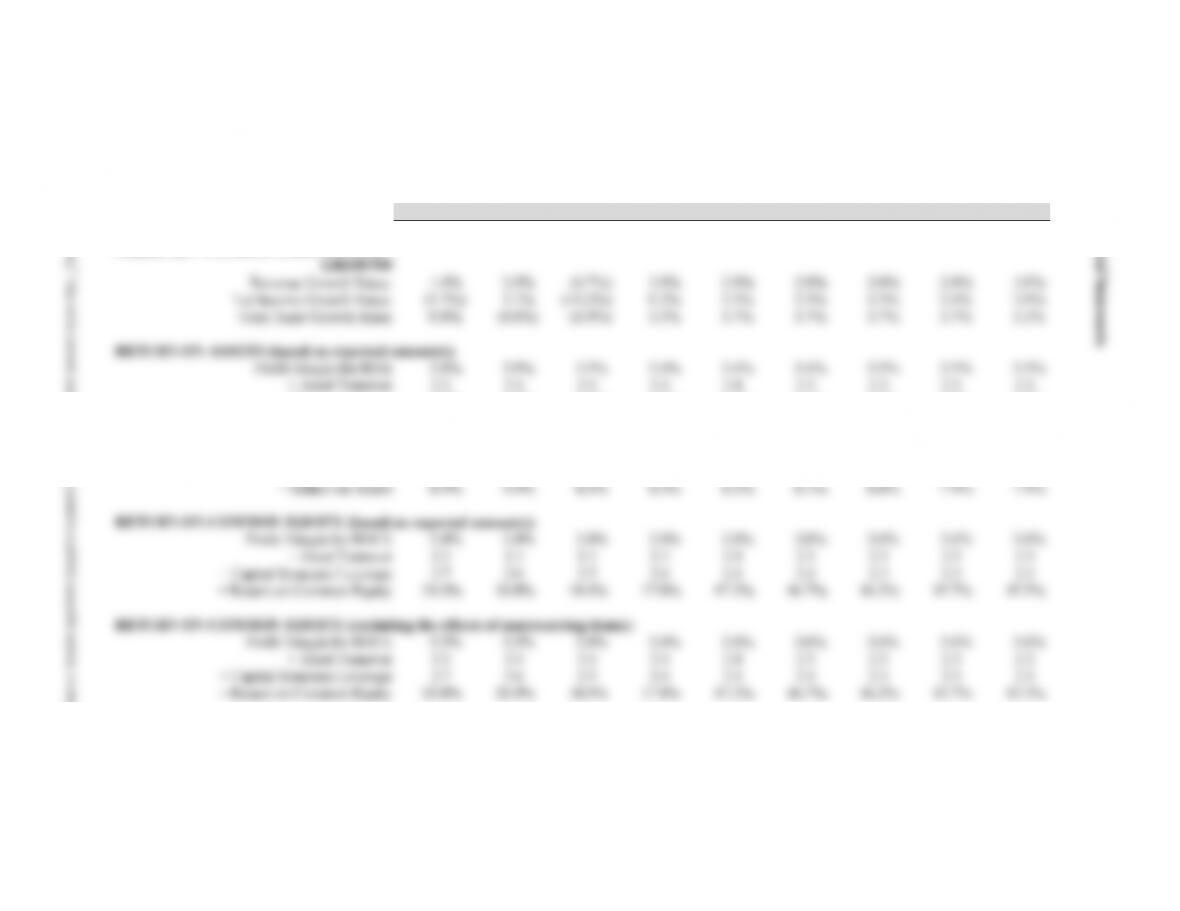
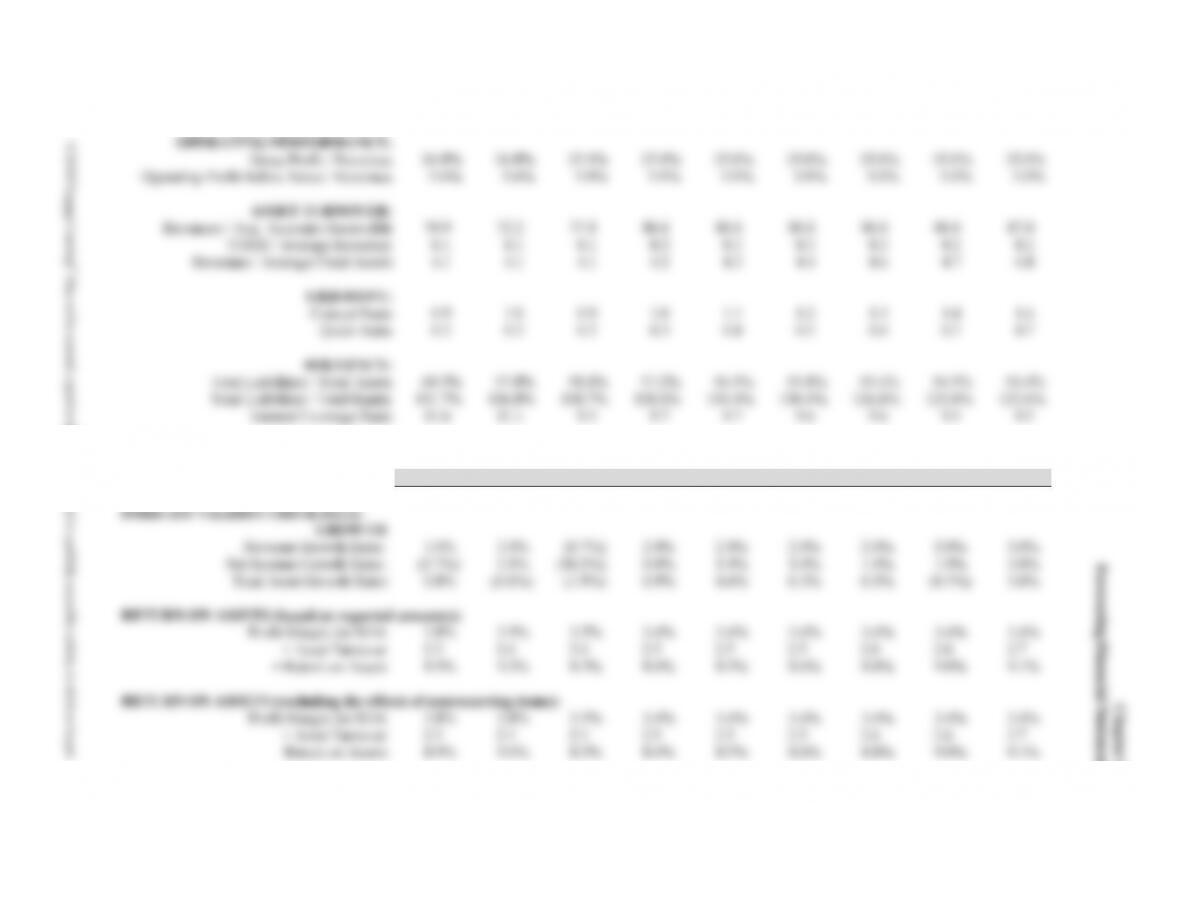
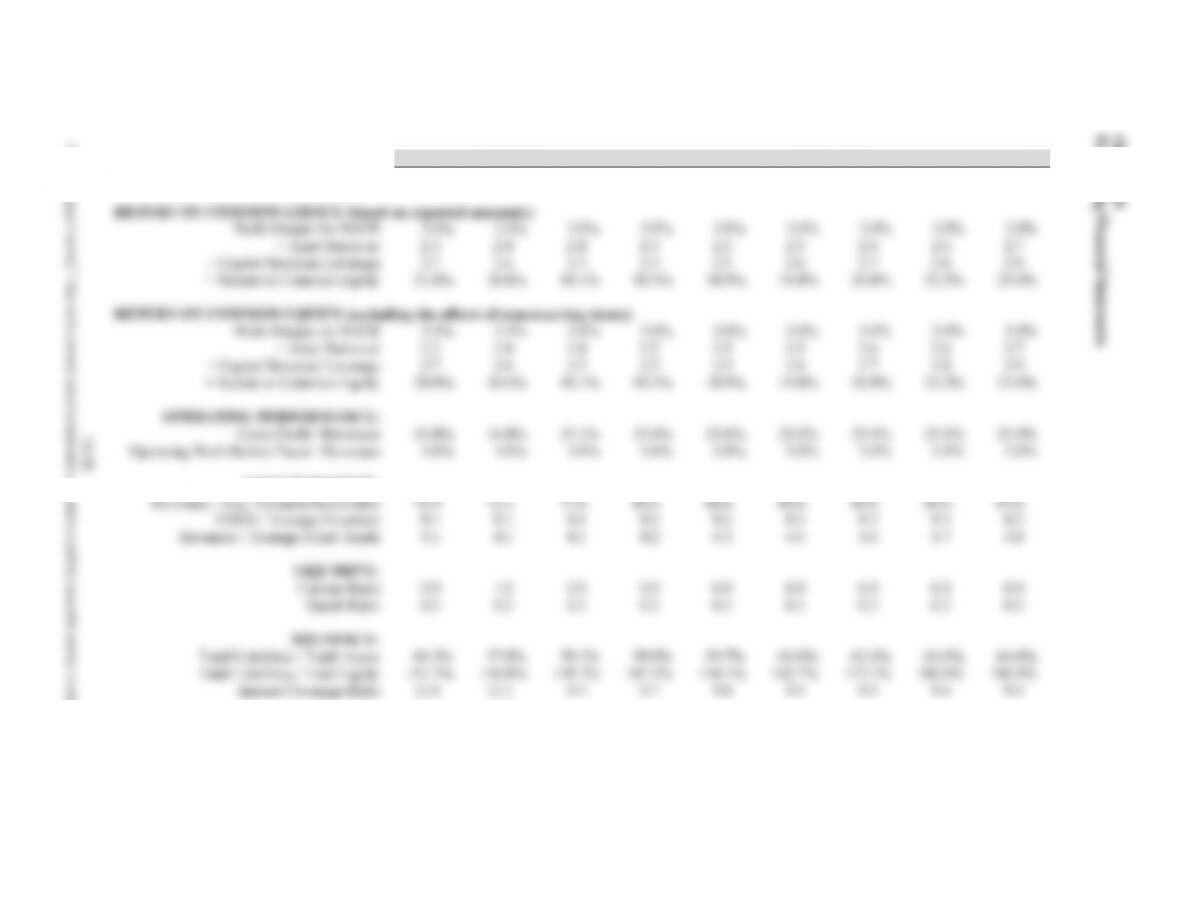
d. Exhibit 10.G presents profitability and risk ratios for Walmart based on the
financial statement forecasts originally developed (with the plug to cash) and
the revised forecasts (with the plug to dividends). The projections indicate a
declining ROCE as well as a declining ROA for Walmart with the plug to cash,
the result of a declining total assets turnover. The ROCE in Year +5 is 22.2%
with the revised forecasts, whereas it is only 15.7% under the original forecasts.
Similarly, the ROA in Year +5 is 9.0% under the revised forecasts and only
7.9% under the original forecasts. Clearly, Walmart shareholders will prefer the
higher rates of return under the increased dividend policy.
10-26
© 2018 Cengage Learning®. May not be scanned, copied or duplicated, or posted to a publicly accessible website, in whole or in part.
Chapter 10
Forecasting Financial Statements
Exhibit 10.G
Walmart Stores—Projected Financial Statement Ratios (Integrative Case 10.1)
Originally Developed Forecasts (with Plug to Cash)
Actuals Forecasts
2013 2014 2015 Year +1 Year +2 Year +3 Year +4 Year +5 Year +6
FORECAST VALIDITY CHECK DATA:
= Return on Assets 8.9% 9.2% 8.3% 8.3% 8.2% 8.1% 8.0% 7.9% 7.9%
RETURN ON ASSETS (excluding the effects of nonrecurring items):
Profit Margin for ROA 3.8% 3.8% 3.5% 3.4% 3.4% 3.4% 3.5% 3.5% 3.5%
× Asset Turnover 2.3 2.4 2.4 2.4 2.4 2.3 2.3 2.3 2.3
10-27
Revised Forecasts (with Plug to Dividends):
Actuals Forecasts
2013 2014 2015 Year +1 Year +2 Year +3 Year +4 Year +5 Year +6
© 2018 Cengage Learning®. May not be scanned, copied or duplicated, or posted to a publicly accessible website, in whole or in part.
Actuals Forecasts
2013 2014 2015 Year +1 Year +2 Year +3 Year +4 Year +5 Year +6
ASSET TURNOVER:
10-29
Case 10.2: Massachusetts Stove Company: Analyzing Strategic Options
I. Case Objectives
business that is approaching maturity.
II. Teaching Strategy
We begin discussion of this case by asking students to identify clues from the
financial statements for Year 3 to Year 7 that Massachusetts Stove Company is in a
years indicate increased margin pressure but cutbacks in asset growth,
particularly capital expenditures.
ii. There is a buildup of cash on the balance sheet even after substantially
reducing debt.
iii. A counter clue is the substantial increase (15.1%) in sales between Year 6
Chapter 10
Forecasting Financial Statements
10-30
end of the period. This preliminary balance in cash was then used to compute
the average balance in cash for the year on which interest income was
spreadsheets, as was done here, so that the assumptions appear at the bottom
and the formulas access these assumptions when students make computations.
c. Projected Financial Statements and Ratios
Exhibits 10.H–10.K of this teaching note present the projected financial
statements and ratios for the best-case scenario. Exhibits 10.L–10.O present
continually as it repays its bank borrowing without adding additional borrowing
to finance capital expenditures or product development. The short-term liquidity
and long-term solvency ratios are strong throughout the five years.
Most Likely Scenario—The most likely scenario results in a declining profit
margin and asset turnover during the phase-in period as a result of incurring
Chapter 10
Forecasting Financial Statements
10-31
Worst-Case Scenario—The profit margin declines even further under the
or negative in Year 9 to Year 12.
d. Assessment of Strategic Options
In evaluating the move into gas stoves, it is helpful to examine the financial
Rate of Return on Assets
Sales Growth Year 7 Year 8 Year 9 Year 10 Year 11 Year 12
+0.04 13.14% 13.56% 13.23% 12.92% 12.60% 12.29%
+0.02 13.14% 13.19% 12.61% 12.11% 11.65% 11.23%
–0.02 13.14% 12.45% 11.37% 10.47% 9.71% 9.06%
–0.10 13.14% 10.94% 8.85% 7.16% 5.74% 4.52%
0.00 32.56% 26.12% 21.34% 18.17% 15.90% 14.28%
–0.04 32.56% 24.36% 18.79% 15.19% 12.66% 10.80%
–0.10 32.56% 21.65% 14.88% 10.56% 7.53% 5.25%
The most likely scenario from moving into the gas stove market provides rates
of return on assets in Year 12 similar to those above when sales of wood stoves
Chapter 10
Forecasting Financial Statements
10-32
The most compelling arguments for adding gas stoves to the product line are
as follows: