CHAPTER 8 Receivables
8–20
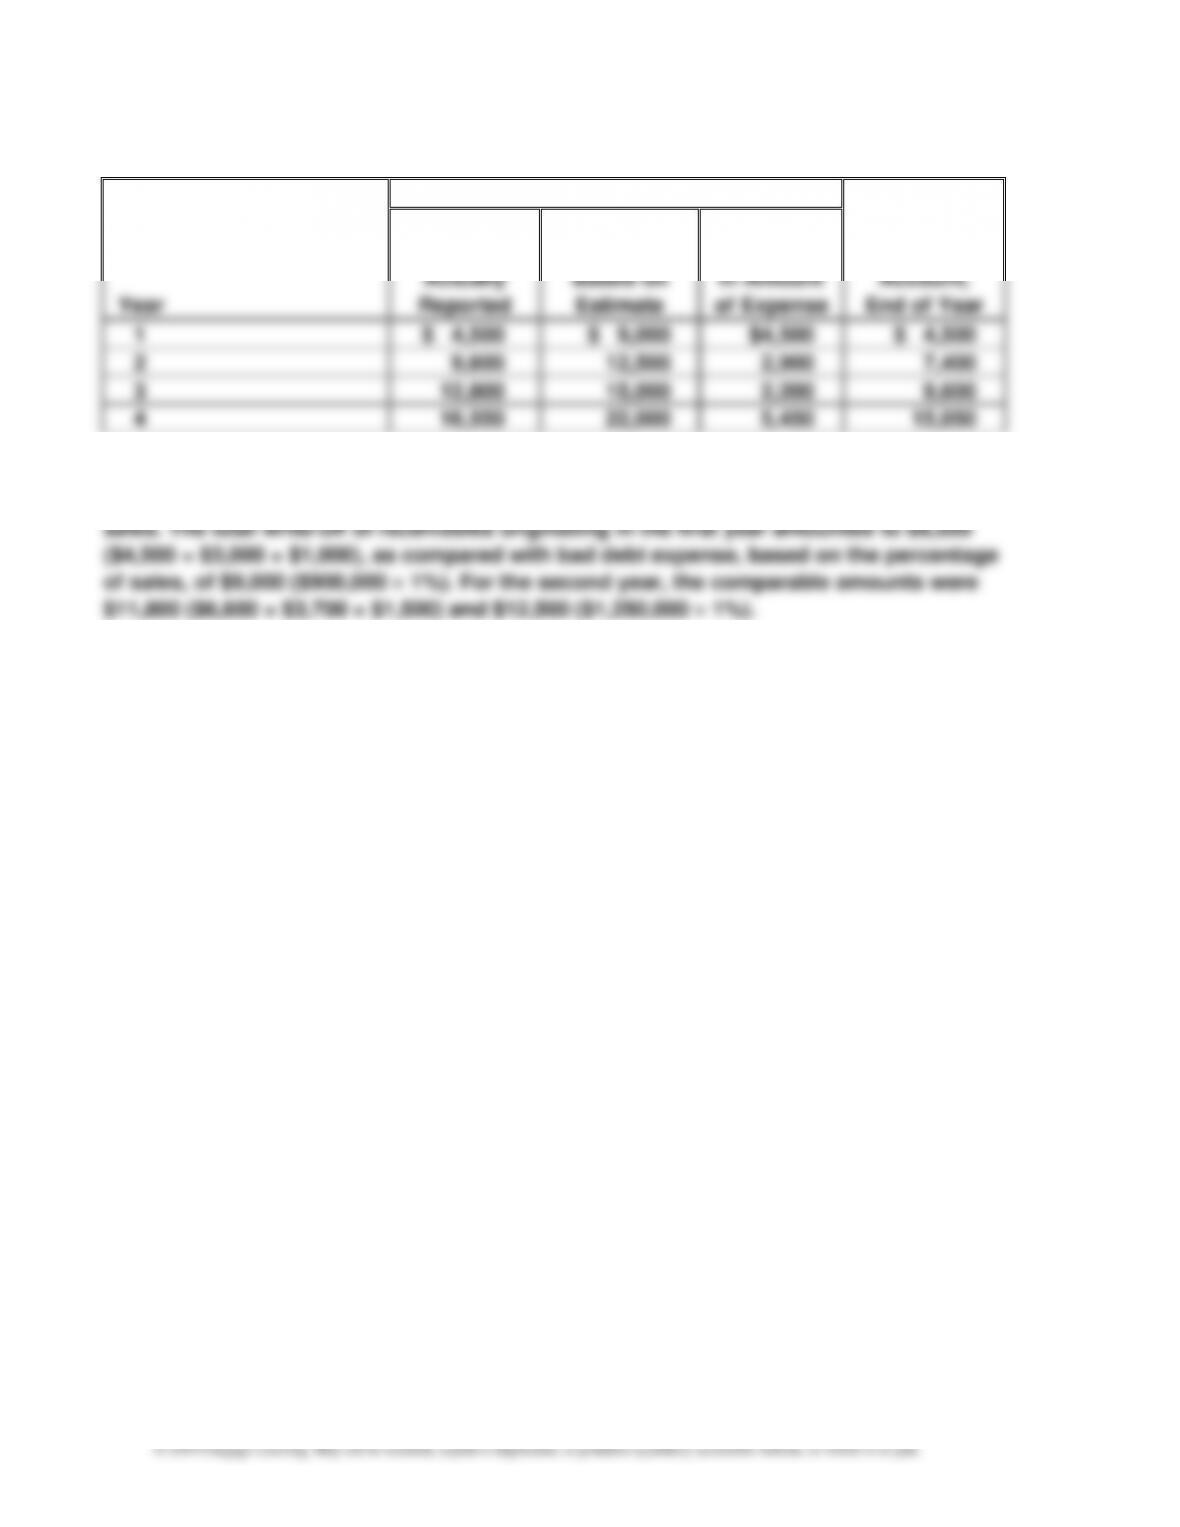
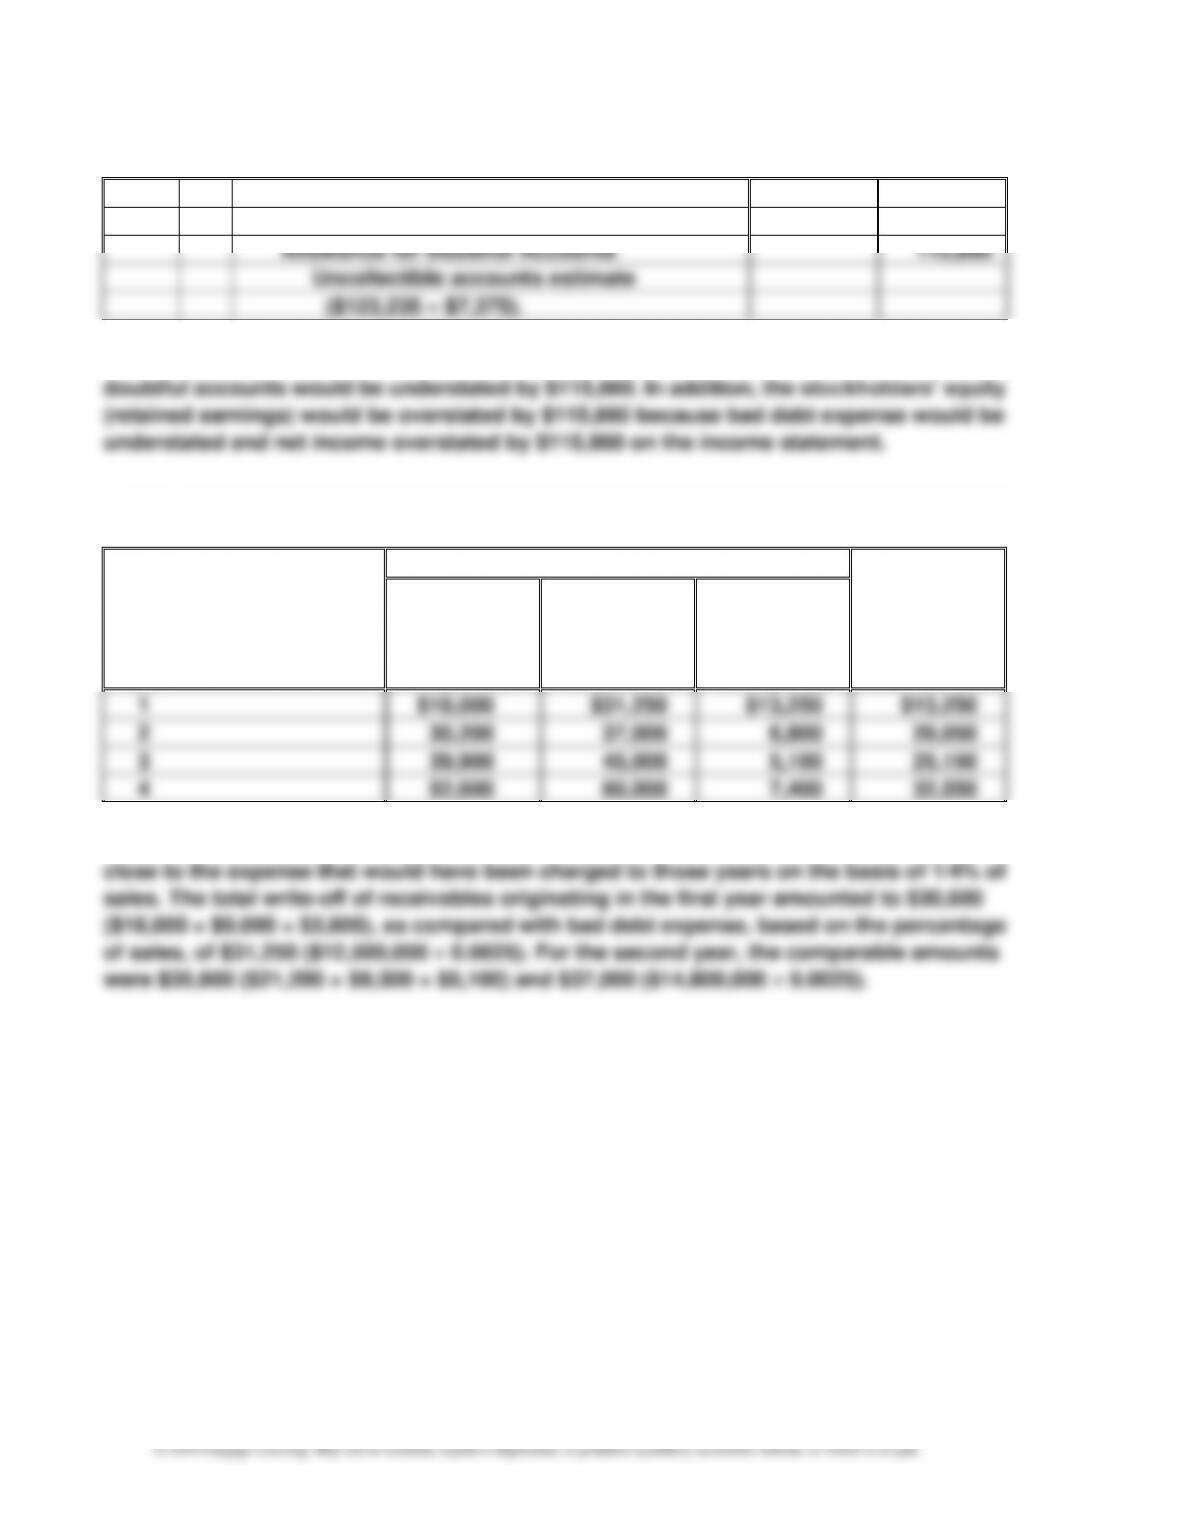
Prob. 8–3A
1.
Year
Bad Debt Expense
Balance of
Allowance
Account,
End of Year
Expense
Actually
Reported
Expense
Based on
Estimate
Increase
(Decrease)
in Amount
of Expense
1
$ 4,500
$ 9,000
$4,500
$ 4,500
2
9,600
12,500
2,900
7,400
3
12,800
15,000
2,200
9,600
4
16,550
22,000
5,450
15,050
2. Yes. The actual write-offs of accounts originating in the first two years are reasonably
close to the expense that would have been charged to those years on the basis of 1% of
CHAPTER 8 Receivables
8–21
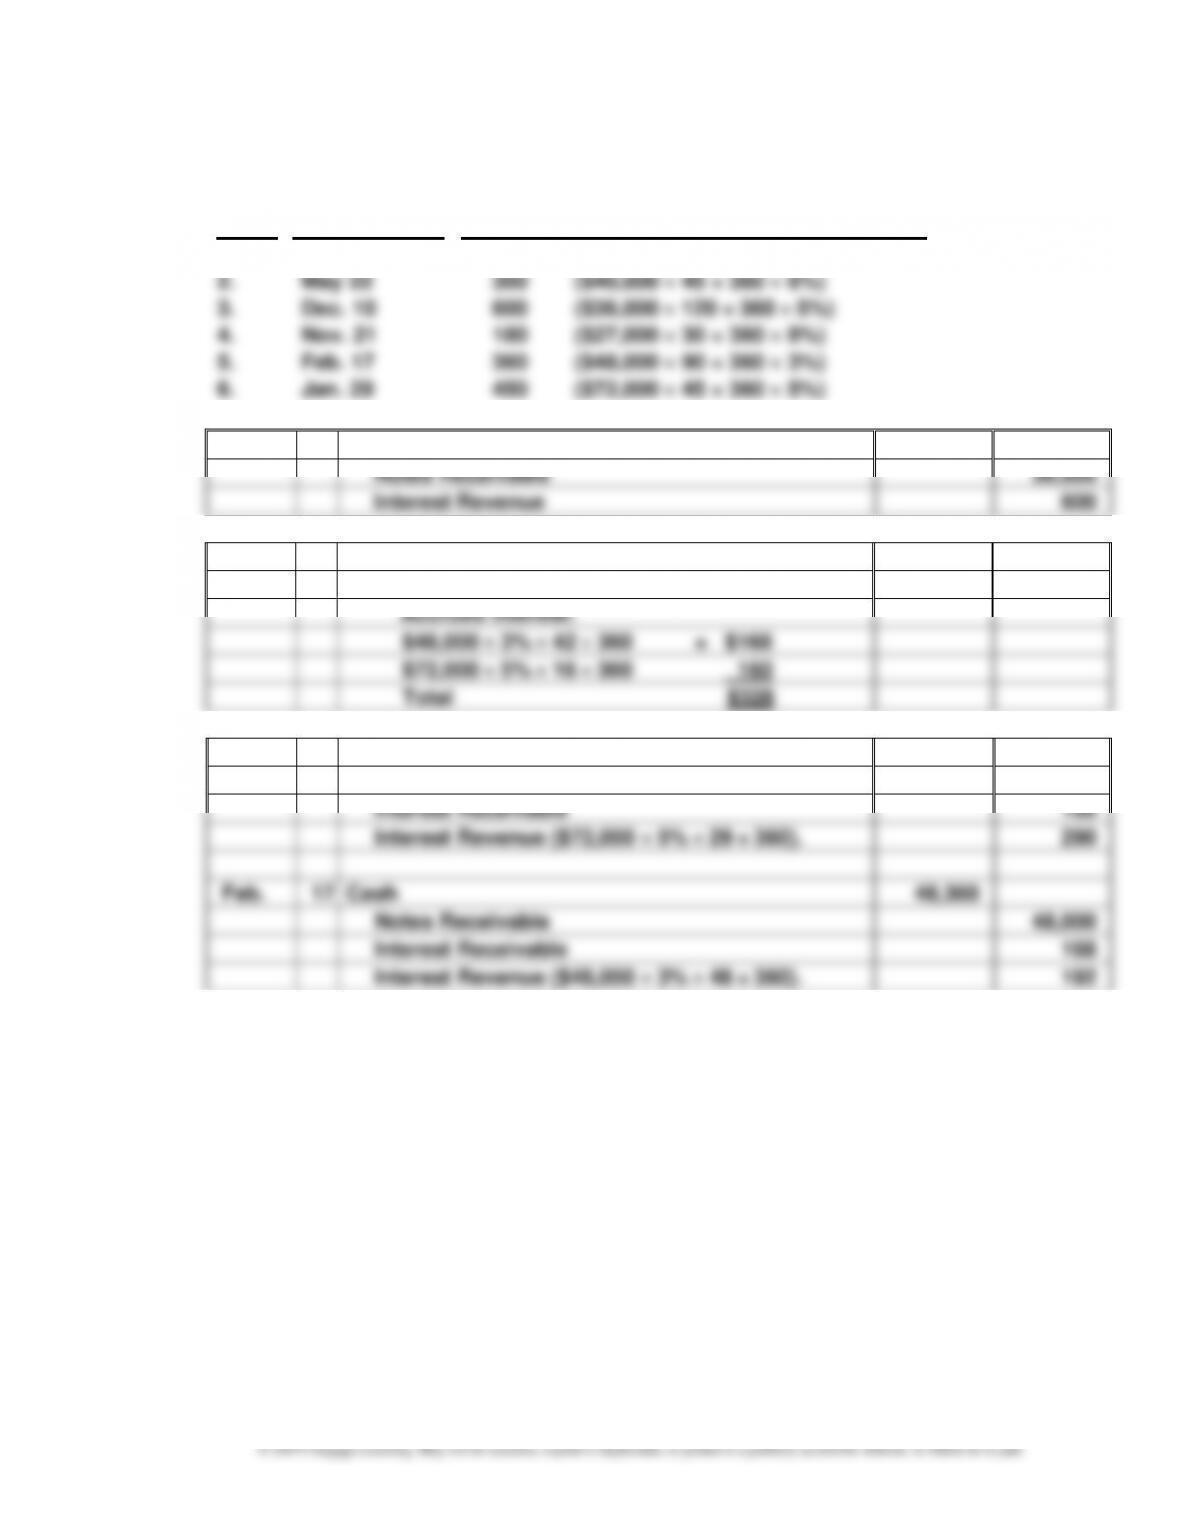
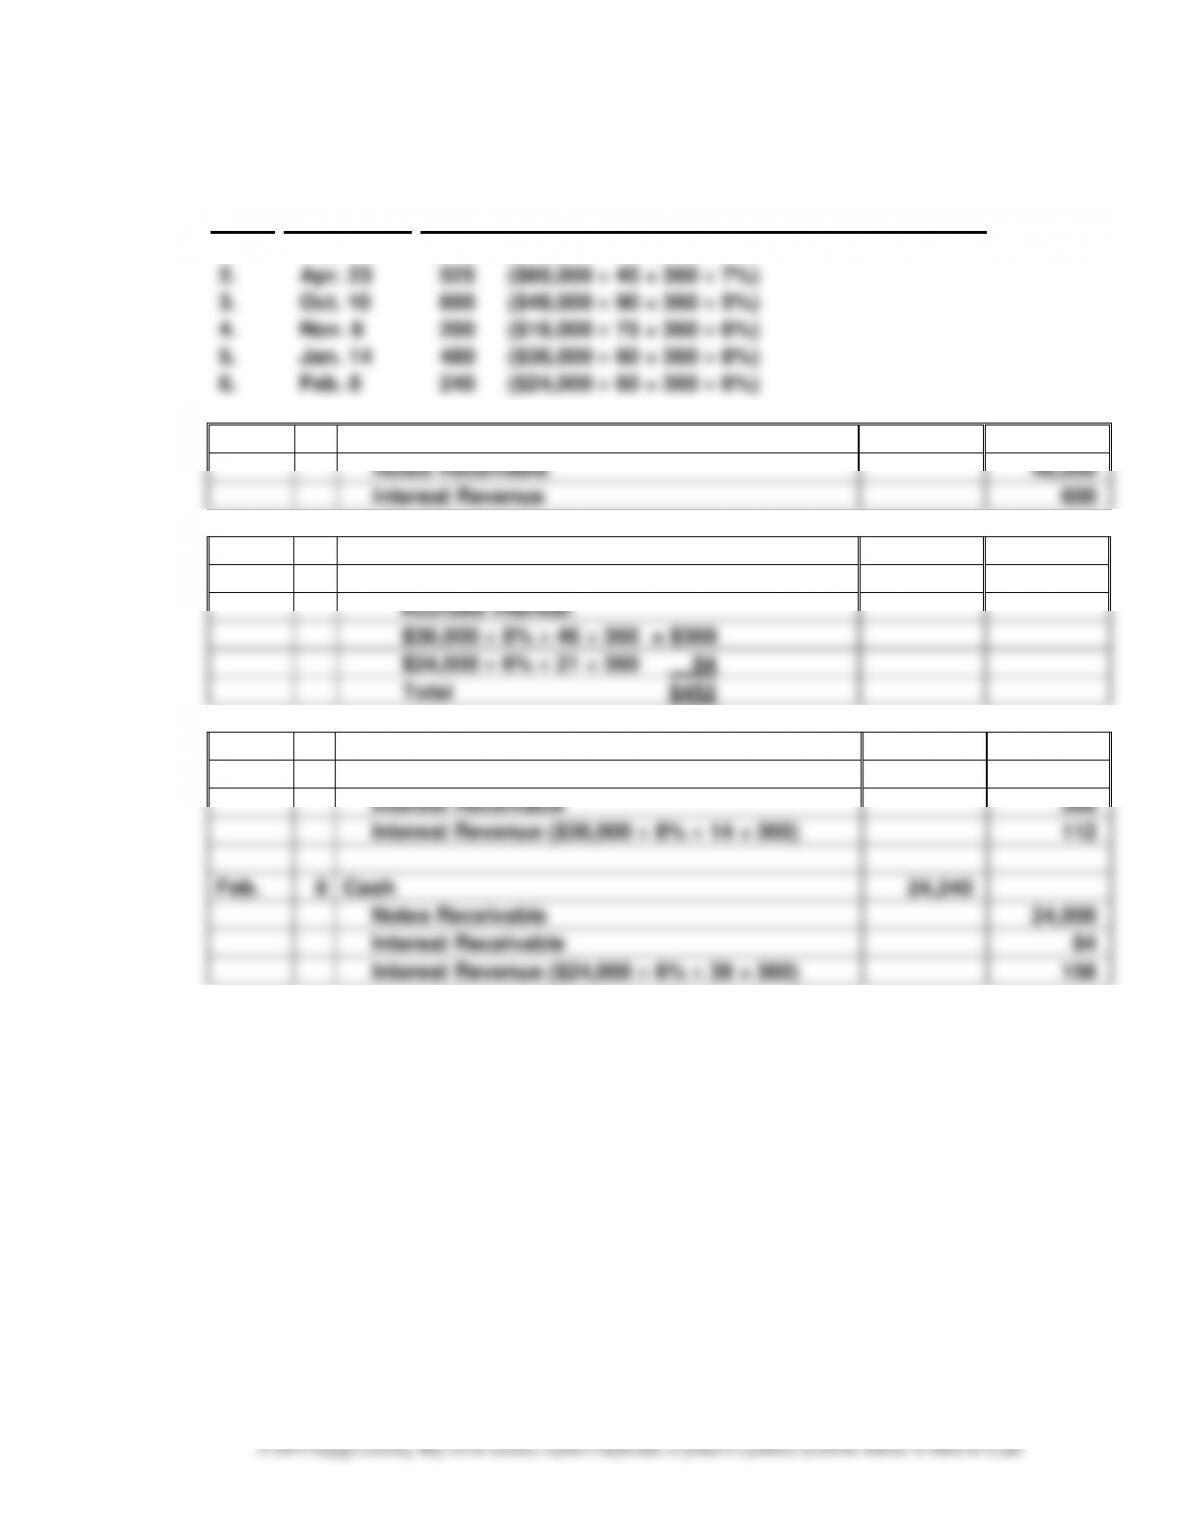
Prob. 8–4A
1. (a) (b)
Note
Due Date
Interest Due at Maturity
1.
May 5
$500
($75,000 60 ÷ 360 4%)
2.
May 22
300
($40,000 45 ÷ 360 6%)
3.
Dec. 10
600
($36,000 120 ÷ 360 5%)
4.
Nov. 21
180
($27,000 30 ÷ 360 8%)
5.
Feb. 17
360
($48,000 90 ÷ 360 3%)
6.
Jan. 29
450
($72,000 45 ÷ 360 5%)
2.
Dec.
10
Accounts Receivable
36,600
Notes Receivable
36,000
Interest Revenue
600
3.
Dec.
31
Interest Receivable
328
Interest Revenue
328
Accrued interest:
$48,000 3% 42 360
= $168
$72,000 5% 16 360
160
Total
$328
4.
Jan.
29
Cash
72,450
Notes Receivable
72,000
Interest Receivable
160
Interest Revenue ($72,000 5% 29 ÷ 360).
290
Feb.
17
Cash
48,360
Notes Receivable
48,000
Interest Receivable
168
Interest Revenue ($48,000 3% 48 ÷ 360).
192
CHAPTER 8 Receivables
8–22
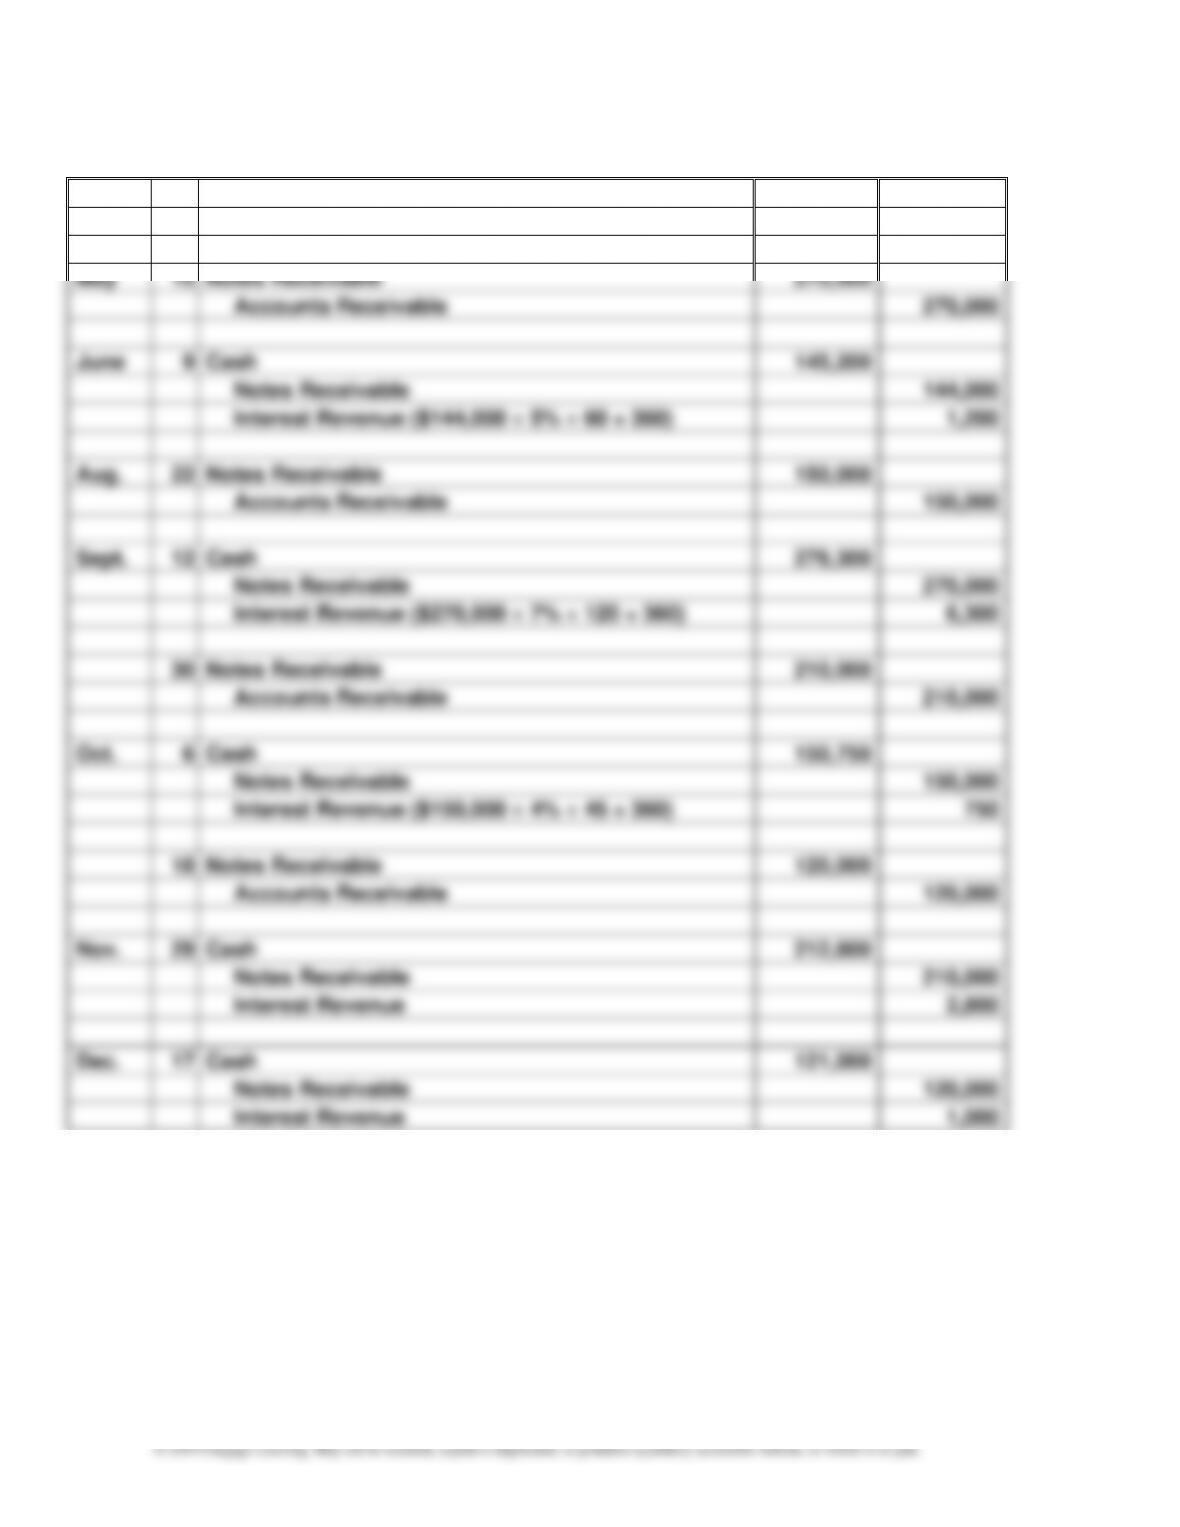
Prob. 8–5A
Apr.
10
Notes Receivable
144,000
Accounts Receivable
144,000
May
15
Notes Receivable
270,000
Accounts Receivable
270,000
June
9
Cash
145,200
Notes Receivable
144,000
Interest Revenue ($144,000 5% 60 ÷ 360)
1,200
Aug.
22
Notes Receivable
150,000
Accounts Receivable
150,000
Sept.
12
Cash
276,300
Notes Receivable
270,000
Interest Revenue ($270,000 7% 120 ÷ 360)
6,300
30
Notes Receivable
210,000
Accounts Receivable
210,000
Oct.
6
Cash
150,750
Notes Receivable
150,000
Interest Revenue ($150,000 4% 45 ÷ 360)
750
18
Notes Receivable
120,000
Accounts Receivable
120,000
Nov.
29
Cash
212,800
Notes Receivable
210,000
Interest Revenue
2,800
Dec.
17
Cash
121,000
Notes Receivable
120,000
Interest Revenue
1,000
CHAPTER 8 Receivables
8–23
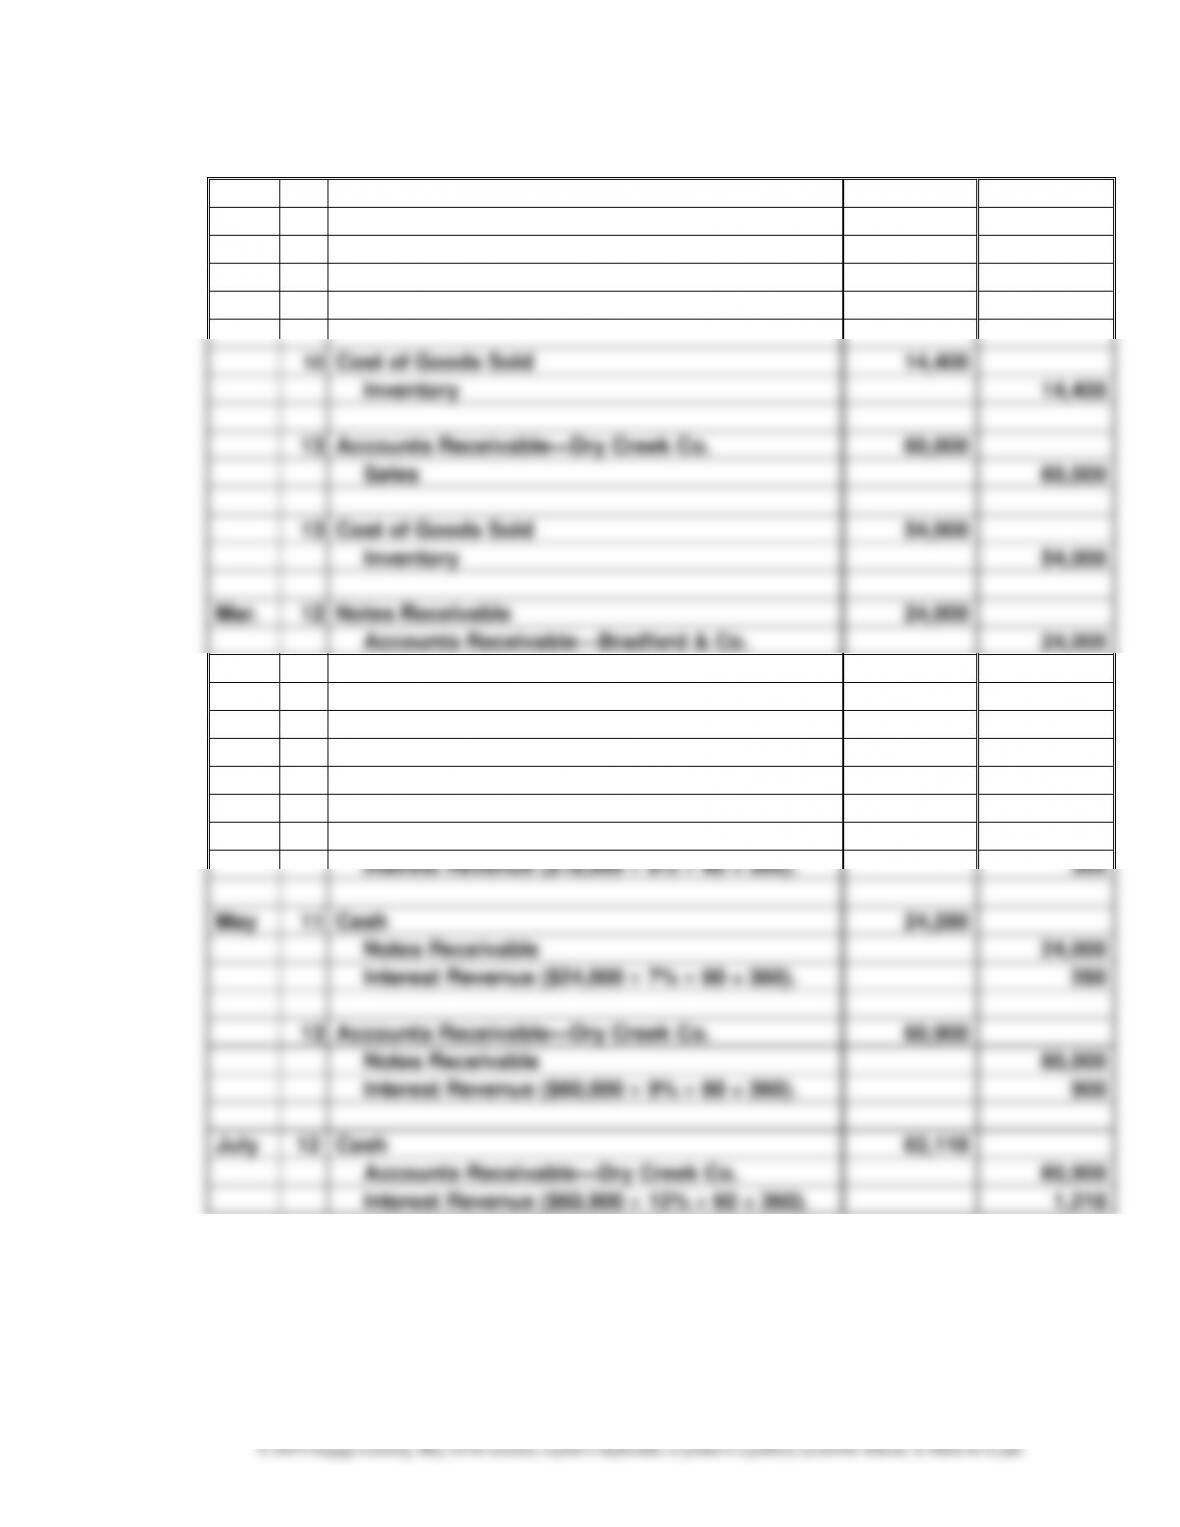
Prob. 8–6A
Jan.
3
Notes Receivable
18,000
Cash
18,000
Feb.
10
Accounts Receivable—Bradford & Co.
24,000
Sales
24,000
10
Cost of Goods Sold
14,400
Inventory
14,400
13
Accounts Receivable—Dry Creek Co.
60,000
Sales
60,000
13
Cost of Goods Sold
54,000
Inventory
54,000
Mar.
12
Notes Receivable
24,000
Accounts Receivable—Bradford & Co.
24,000
14
Notes Receivable
60,000
Accounts Receivable—Dry Creek Co.
60,000
Apr.
3
Notes Receivable
18,000
Cash
360
Notes Receivable
18,000
Interest Revenue ($18,000 8% 90 ÷ 360).
360
May
11
Cash
24,280
Notes Receivable
24,000
Interest Revenue ($24,000 7% 60 ÷ 360).
280
13
Accounts Receivable—Dry Creek Co.
60,900
Notes Receivable
60,000
Interest Revenue ($60,000 9% 60 ÷ 360).
900
July
12
Cash
62,118
Accounts Receivable—Dry Creek Co.
60,900
Interest Revenue ($60,900 12% 60 ÷ 360).
1,218
CHAPTER 8 Receivables
8–24
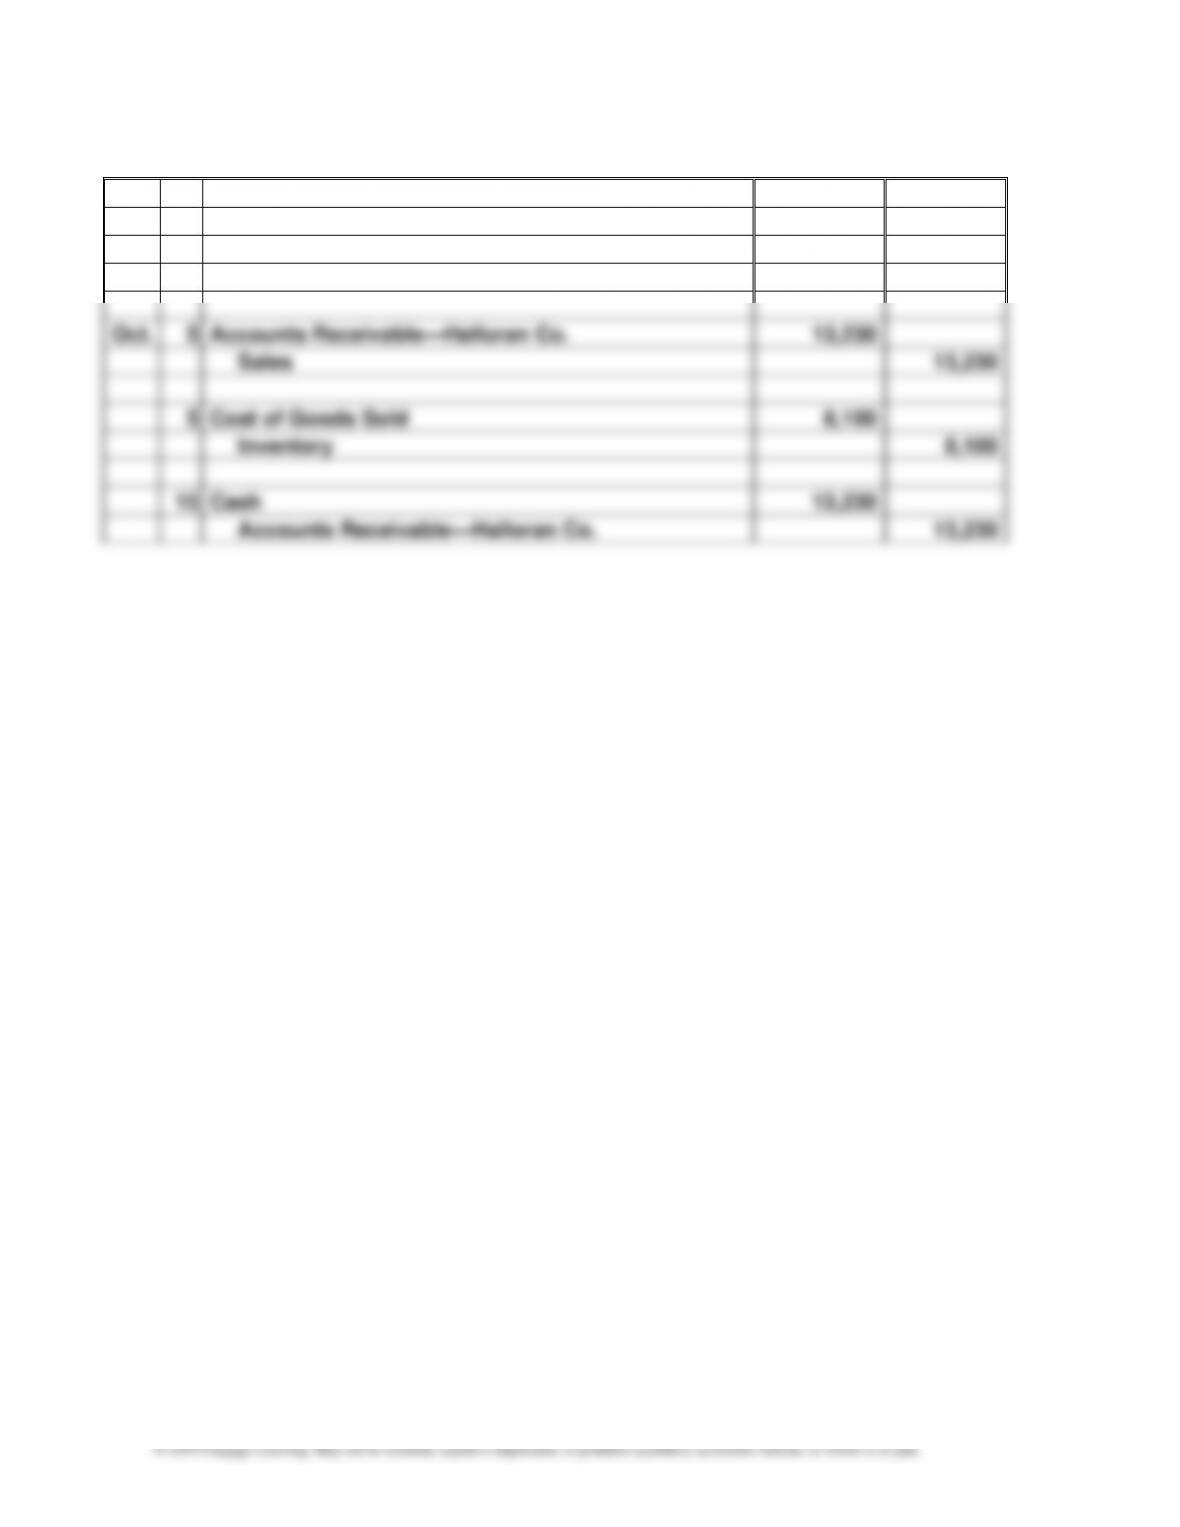
Prob. 8–6A (Concluded)
Aug.
1
Cash
18,540
Notes Receivable
18,000
Interest Revenue ($18,000 9% 120 ÷ 360).
540
Oct.
5
Accounts Receivable—Halloran Co.
13,230
Sales
13,230
5
Cost of Goods Sold
8,100
Inventory
8,100
15
Cash
13,230
Accounts Receivable—Halloran Co.
13,230
CHAPTER 8 Receivables
8–25
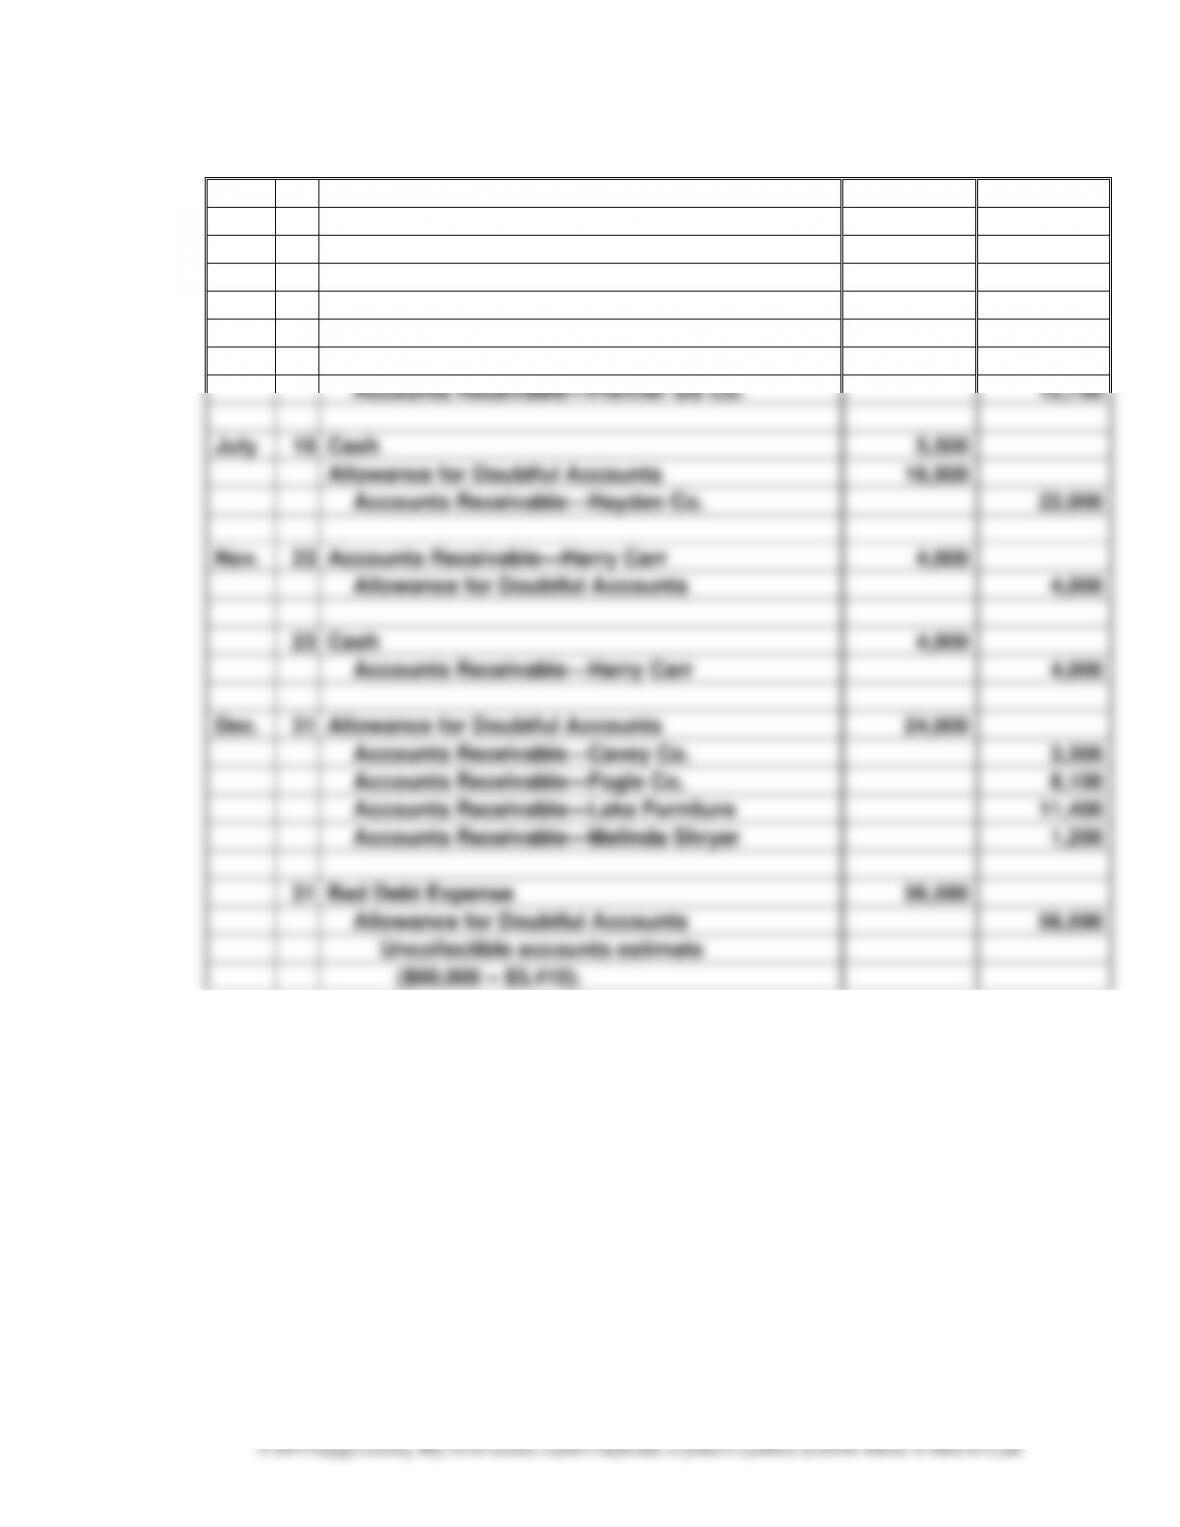
Prob. 8–1B
2.
Jan.
19
Accounts Receivable—Arlene Gurley
2,660
Allowance for Doubtful Accounts
2,660
19
Cash
2,660
Accounts Receivable—Arlene Gurley
2,660
Apr.
3
Allowance for Doubtful Accounts
12,750
Accounts Receivable—Premier GS Co.
12,750
July
16
Cash
5,500
Allowance for Doubtful Accounts
16,500
Accounts Receivable—Hayden Co.
22,000
Nov.
23
Accounts Receivable—Harry Carr
4,000
Allowance for Doubtful Accounts
4,000
23
Cash
4,000
Accounts Receivable—Harry Carr
4,000
Dec.
31
Allowance for Doubtful Accounts
24,000
Accounts Receivable—Cavey Co.
3,300
Accounts Receivable—Fogle Co.
8,100
Accounts Receivable—Lake Furniture
11,400
Accounts Receivable—Melinda Shryer
1,200
31
Bad Debt Expense
56,590
Allowance for Doubtful Accounts
56,590
Uncollectible accounts estimate
($60,000 – $3,410).
CHAPTER 8 Receivables
8–26
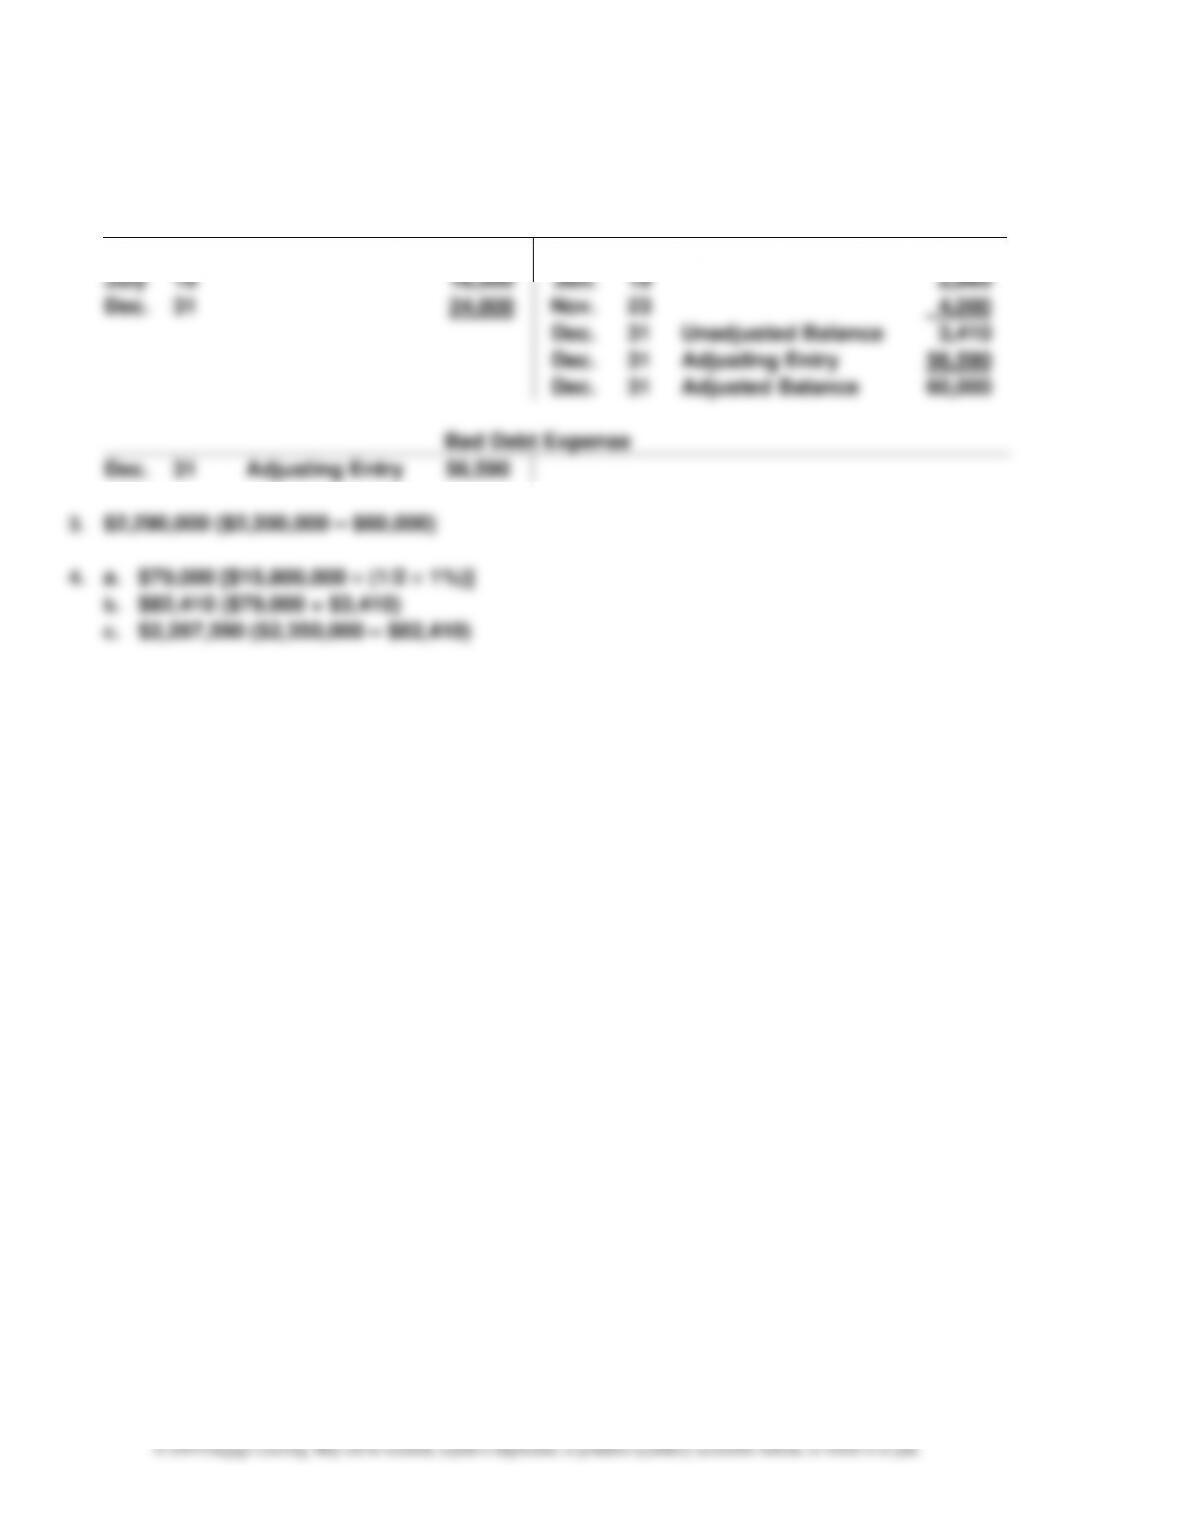
Prob. 8–1B (Concluded)
1. and 2.
Allowance for Doubtful Accounts
Apr.
3
12,750
Jan.
1
Balance
50,000
July
16
16,500
Jan.
19
2,660
Dec.
31
24,000
Nov.
23
4,000
Dec.
31
Unadjusted Balance
3,410
Dec.
31
Adjusting Entry
56,590
Dec.
31
Adjusted Balance
60,000
Dec.
31
Adjusting Entry 56,590
3. $2,290,000 ($2,350,000 – $60,000)
4. a. $79,000 [$15,800,000 (1/2 1%)]
b. $82,410 ($79,000 + $3,410)
c. $2,267,590 ($2,350,000 – $82,410)
CHAPTER 8 Receivables
8–27
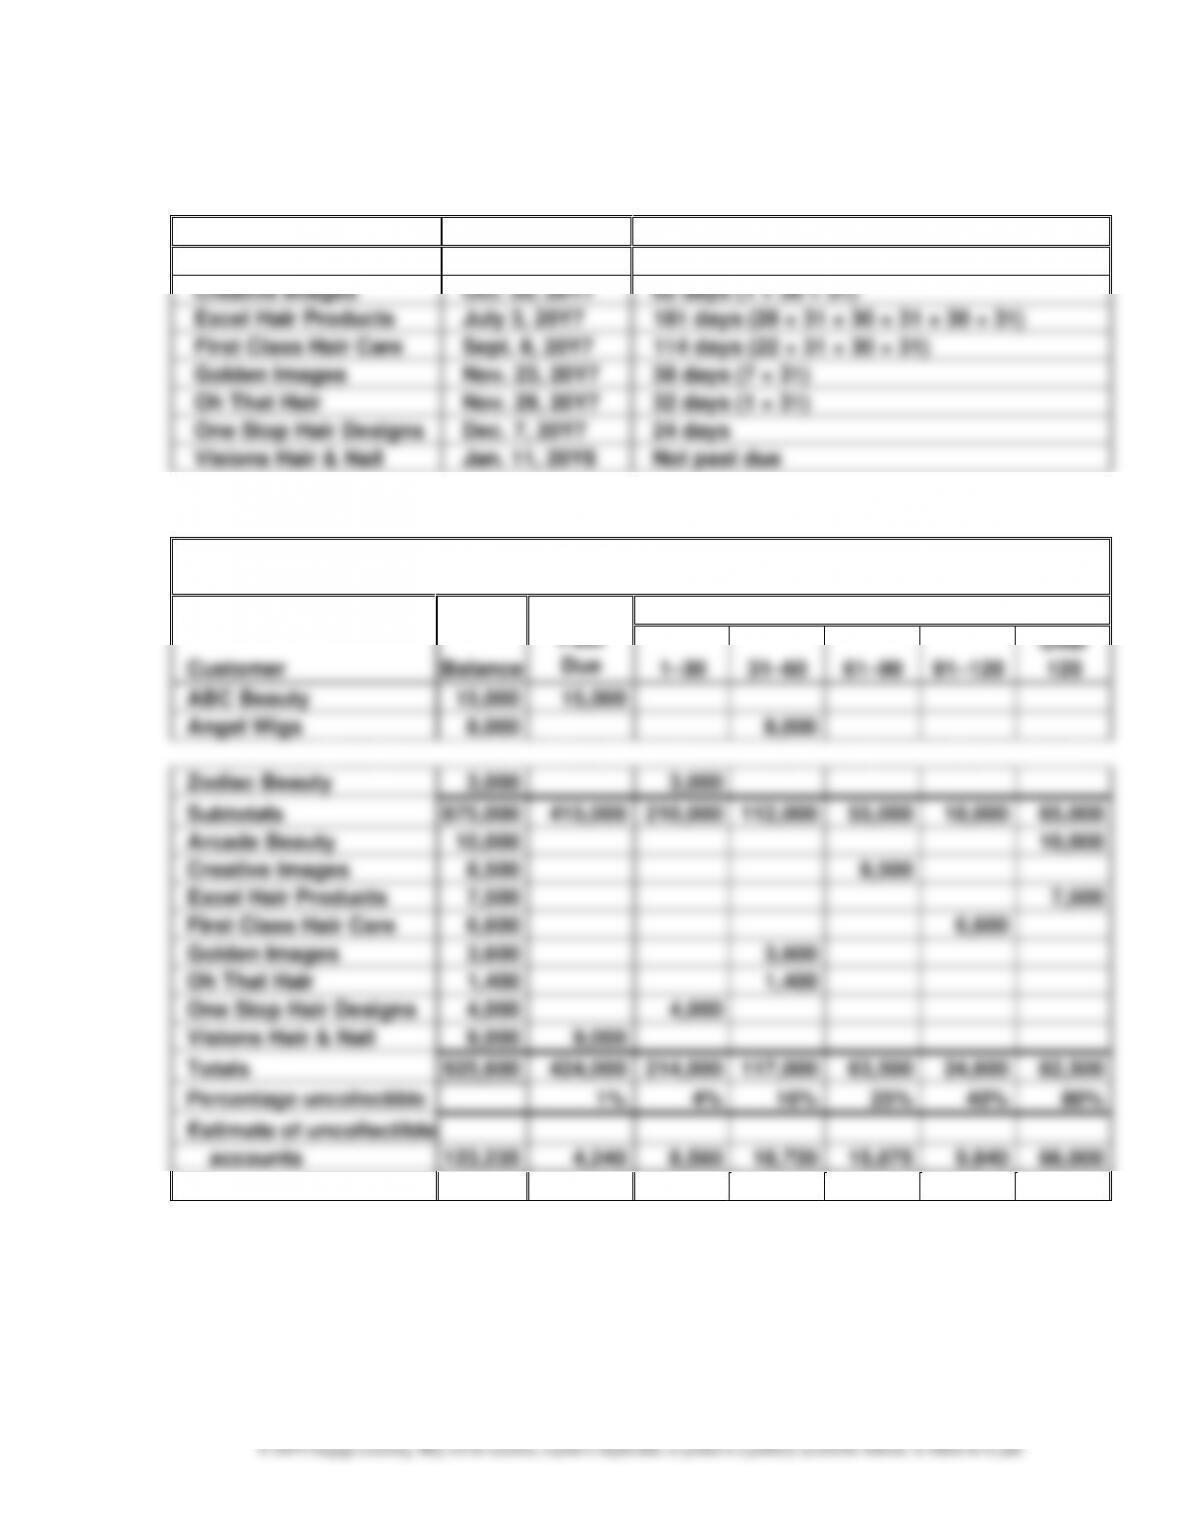
Prob. 8–2B
1.
Customer
Due Date
Number of Days Past Due
Arcade Beauty
Aug. 17, 20Y7
136 days (14 + 30 + 31 + 30 + 31)
Creative Images
Oct. 30, 20Y7
62 days (1 + 30 + 31)
Excel Hair Products
July 3, 20Y7
181 days (28 + 31 + 30 + 31 + 30 + 31)
First Class Hair Care
Sept. 8, 20Y7
114 days (22 + 31 + 30 + 31)
Golden Images
Nov. 23, 20Y7
38 days (7 + 31)
Oh That Hair
Nov. 29, 20Y7
32 days (1 + 31)
One Stop Hair Designs
Dec. 7, 20Y7
24 days
Visions Hair & Nail
Jan. 11, 20Y8
Not past due
2. and 3.
Aging of Receivables Schedule
December 31, 20Y7
Customer
Balance
Not
Past
Due
Days Past Due
1–30
31–60
61–90
91–120
Over
120
ABC Beauty
15,000
15,000
Angel Wigs
8,000
8,000
Zodiac Beauty
3,000
3,000
Subtotals
875,000
415,000
210,000
112,000
55,000
18,000
65,000
Arcade Beauty
10,000
10,000
Creative Images
8,500
8,500
Excel Hair Products
7,500
7,500
First Class Hair Care
6,600
6,600
Golden Images
3,600
3,600
Oh That Hair
1,400
1,400
One Stop Hair Designs
4,000
4,000
Visions Hair & Nail
9,000
9,000
Totals
925,600
424,000
214,000
117,000
63,500
24,600
82,500
Percentage uncollectible
1%
4%
16%
25%
40%
80%
Estimate of uncollectible
accounts
123,235
4,240
8,560
18,720
15,875
9,840
66,000
CHAPTER 8 Receivables
8–28
Prob. 8–2B (Concluded)
4.
20Y7
Dec.
31
Bad Debt Expense
115,860
Allowance for Doubtful Accounts
115,860
Uncollectible accounts estimate
($123,235 – $7,375).
5. On the balance sheet, assets would be overstated by $115,860 because the allowance for
Prob. 8–3B
1.
Year
Bad Debt Expense
Balance of
Allowance
Account,
End of Year
Expense
Actually
Reported
Expense
Based on
Estimate
Increase
(Decrease)
in Amount
of Expense
1
$18,000
$31,250
$13,250
$13,250
2
30,200
37,000
6,800
20,050
3
39,900
45,000
5,100
25,150
4
52,600
60,000
7,400
32,550
2. Yes. The actual write-offs of accounts originating in the first two years are reasonably
CHAPTER 8 Receivables
8–29
Prob. 8–4B
1. (a) (b)
Note
Due Date
Interest Due at Maturity
1.
Feb. 13
$110
($33,000 30 ÷ 360 4%)
2.
Apr. 23
525
($60,000 45 ÷ 360 7%)
3.
Oct. 10
600
($48,000 90 ÷ 360 5%)
4.
Nov. 6
200
($16,000 75 ÷ 360 6%)
5.
Jan. 14
480
($36,000 60 ÷ 360 8%)
6.
Feb. 8
240
($24,000 60 ÷ 360 6%)
2.
Oct.
10
Accounts Receivable
48,600
Notes Receivable
48,000
Interest Revenue
600
3.
Dec.
31
Interest Receivable
452
Interest Revenue
452
Accrued interest:
$36,000 8% 46 ÷ 360
= $368
$24,000 6% 21 ÷ 360
84
Total
$452
4.
Jan.
14
Cash
36,480
Notes Receivable
36,000
Interest Receivable
368
Interest Revenue ($36,000 8% 14 ÷ 360)
112
Feb.
8
Cash
24,240
Notes Receivable
24,000
Interest Receivable
84
Interest Revenue ($24,000 6% 39 ÷ 360)
156
CHAPTER 8 Receivables
8–30
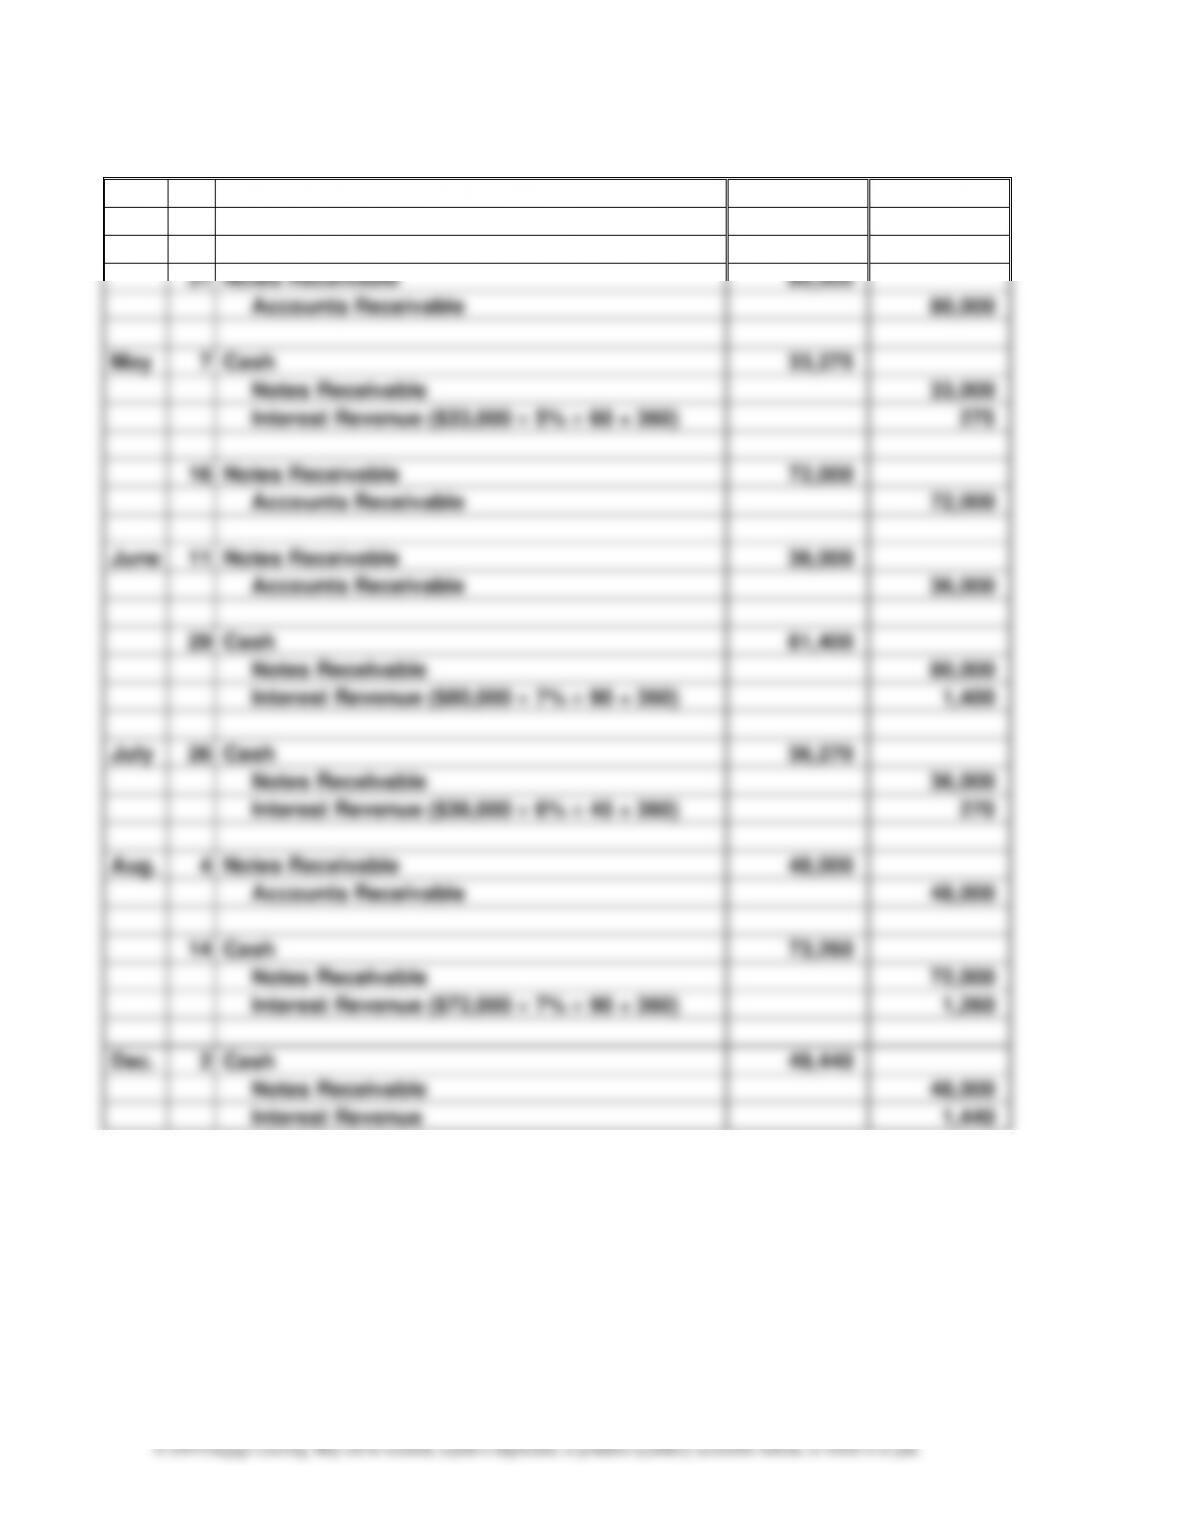
Prob. 8–5B
Mar.
8
Notes Receivable
33,000
Accounts Receivable
33,000
31
Notes Receivable
80,000
Accounts Receivable
80,000
May
7
Cash
33,275
Notes Receivable
33,000
Interest Revenue ($33,000 5% 60 ÷ 360)
275
16
Notes Receivable
72,000
Accounts Receivable
72,000
June
11
Notes Receivable
36,000
Accounts Receivable
36,000
29
Cash
81,400
Notes Receivable
80,000
Interest Revenue ($80,000 7% 90 ÷ 360)
1,400
July
26
Cash
36,270
Notes Receivable
36,000
Interest Revenue ($36,000 6% 45 ÷ 360)
270
Aug.
4
Notes Receivable
48,000
Accounts Receivable
48,000
14
Cash
73,260
Notes Receivable
72,000
Interest Revenue ($72,000 7% 90 ÷ 360)
1,260
Dec.
2
Cash
49,440
Notes Receivable
48,000
Interest Revenue
1,440
CHAPTER 8 Receivables
8–31
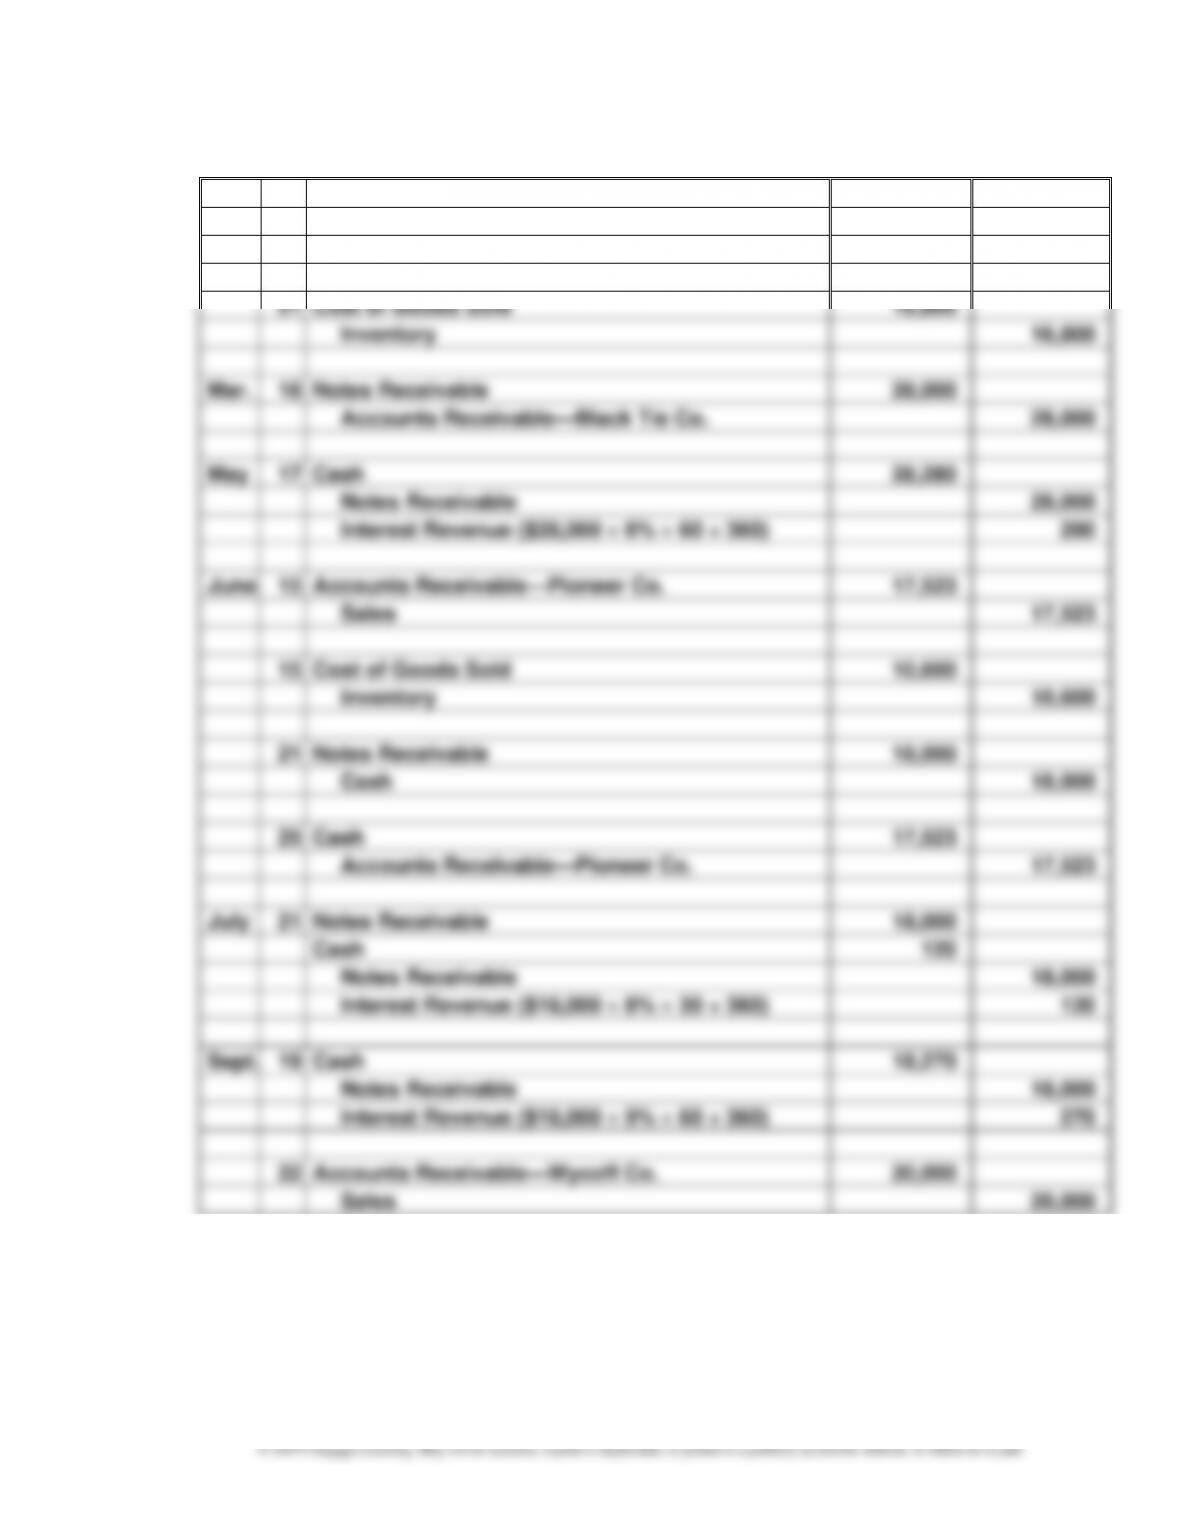
Prob. 8–6B
Jan.
21
Accounts Receivable—Black Tie Co.
28,000
Sales
28,000
21
Cost of Goods Sold
16,800
Inventory
16,800
Mar.
18
Notes Receivable
28,000
Accounts Receivable—Black Tie Co.
28,000
May
17
Cash
28,280
Notes Receivable
28,000
Interest Revenue ($28,000 6% 60 ÷ 360)
280
June
15
Accounts Receivable—Pioneer Co.
17,523
Sales
17,523
15
Cost of Goods Sold
10,600
Inventory
10,600
21
Notes Receivable
18,000
Cash
18,000
25
Cash
17,523
Accounts Receivable—Pioneer Co.
17,523
July
21
Notes Receivable
18,000
Cash
120
Notes Receivable
18,000
Interest Revenue ($18,000 8% 30 ÷ 360)
120
Sept.
19
Cash
18,270
Notes Receivable
18,000
Interest Revenue ($18,000 9% 60 ÷ 360)
270
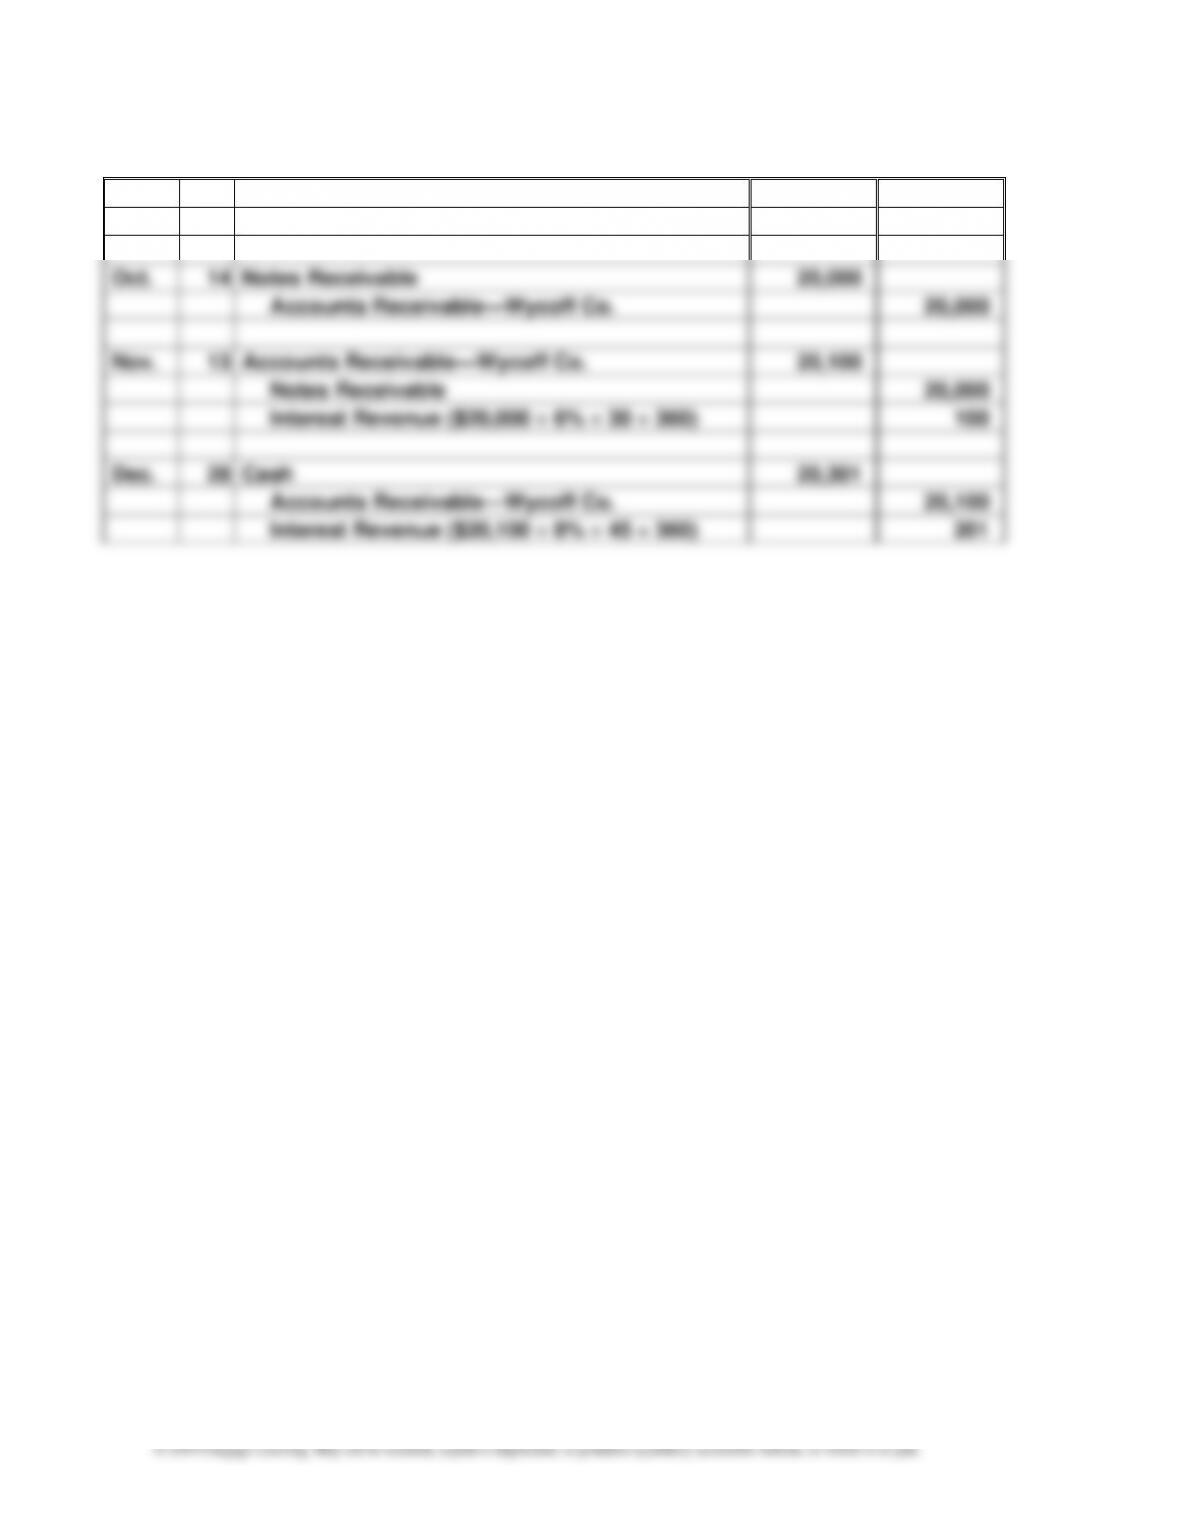
22
Accounts Receivable—Wycoff Co.
20,000
Sales
20,000
CHAPTER 8 Receivables
8–32
Prob. 8–6B (Concluded)
Sept.
22
Cost of Goods Sold
12,000
Inventory
12,000
Oct.
14
Notes Receivable
20,000
Accounts Receivable—Wycoff Co.
20,000
Nov.
13
Accounts Receivable—Wycoff Co.
20,100
Notes Receivable
20,000
Interest Revenue ($20,000 6% 30 360)
100
Dec.
28
Cash
20,301
Accounts Receivable—Wycoff Co.
20,100
Interest Revenue ($20,100 8% 45 360)
201
CHAPTER 8 Receivables
8–33
MAKE A DECISION
MAD 8–1
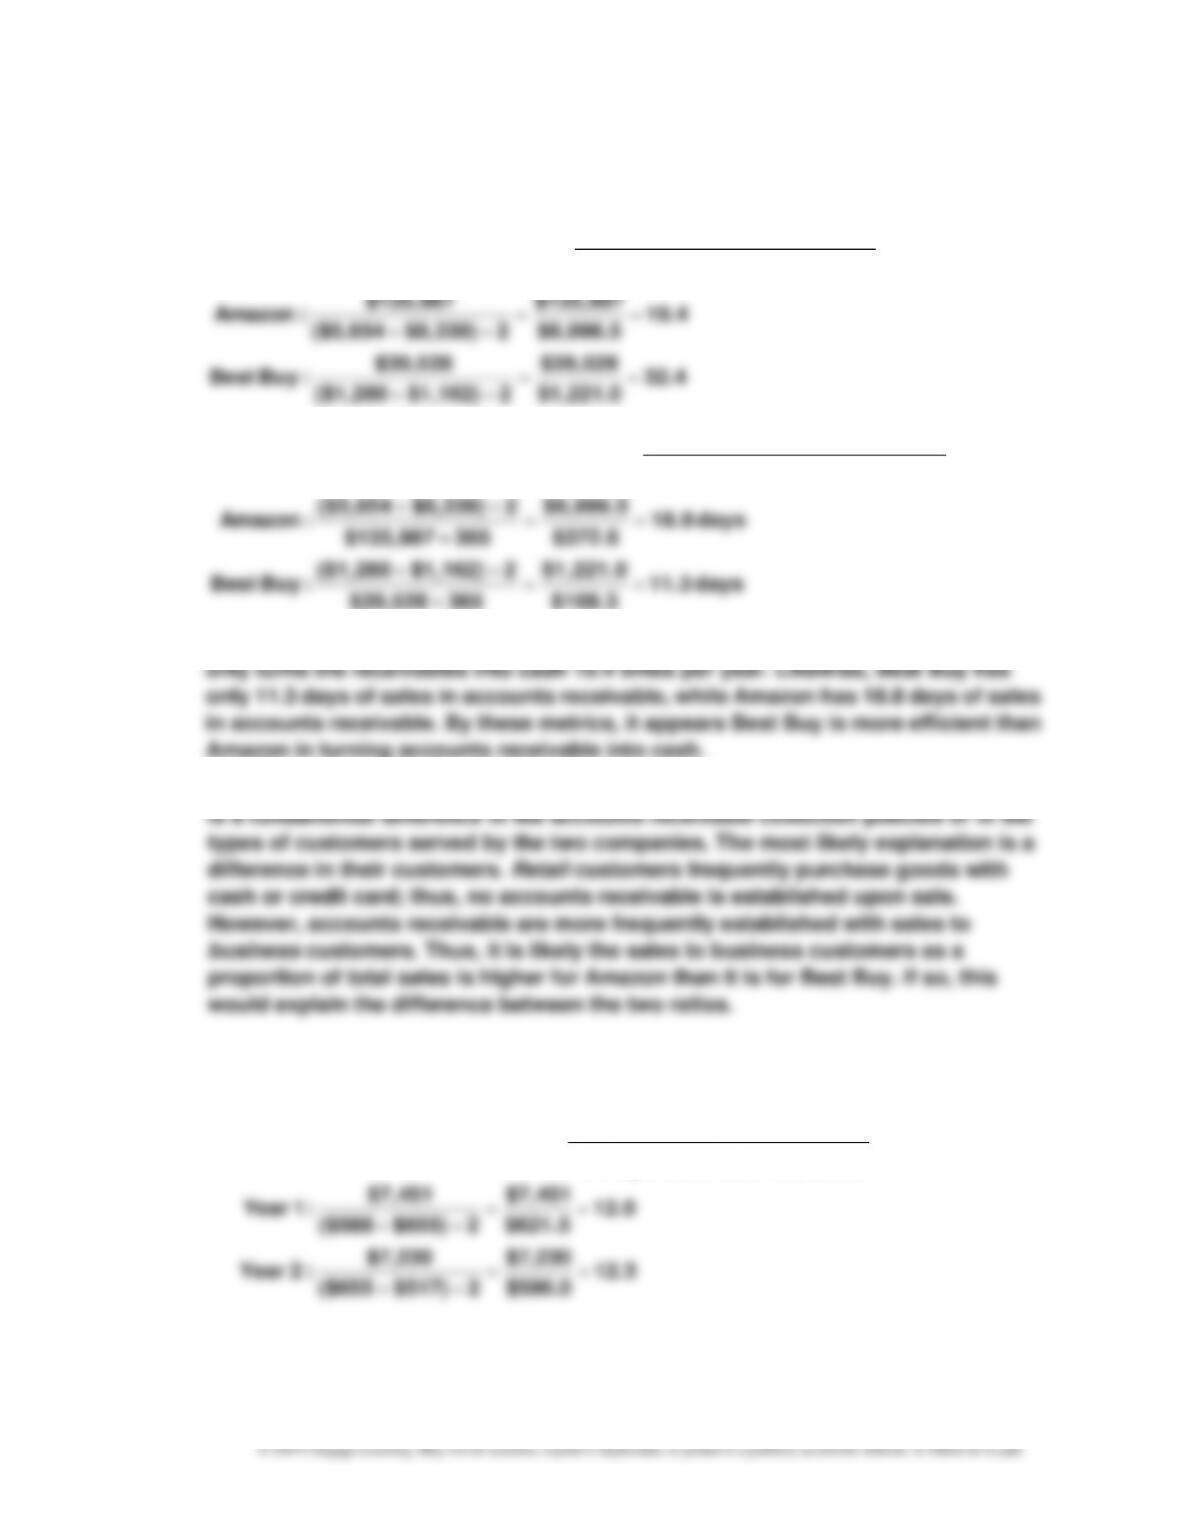
a.
Receivable AccountsAverage
Sales
Turnover Receivable Accounts =
32.4
$1,221.0
$39,528
2 $1,162) ($1,280
$39,528
:BuyBest
19.4
$6,996.5
$135,987
2 $8,339) ($5,654
$135,987
:Amazon
==
+
==
+
b.
Sales Daily Average
Receivable AccountsAverage
sReceivable in Sales Days’ of Number =
days 11.3
$108.3
$1,221.0
365 $39,528
2 $1,162) ($1,280
:BuyBest
days 18.8
$372.6
$6,996.5
365 $135,987
2 $8,339) ($5,654
:Amazon
==
+
==
+
c. Best Buy turns accounts receivable into cash 32.4 times per year, while Amazon
d. The large difference in the ratios between these two companies suggests that there
MAD 8–2
a.
Receivable AccountsAverage
Sales
Turnover Receivable Accounts =
12.3
$586.0
$7,230
2 $517) ($655
$7,230
:2 Year
12.0
$621.5
$7,451
2$655)($588
$7,451
:1 Year
==
+
==
CHAPTER 8 Receivables
MAD 8–2 (Concluded)
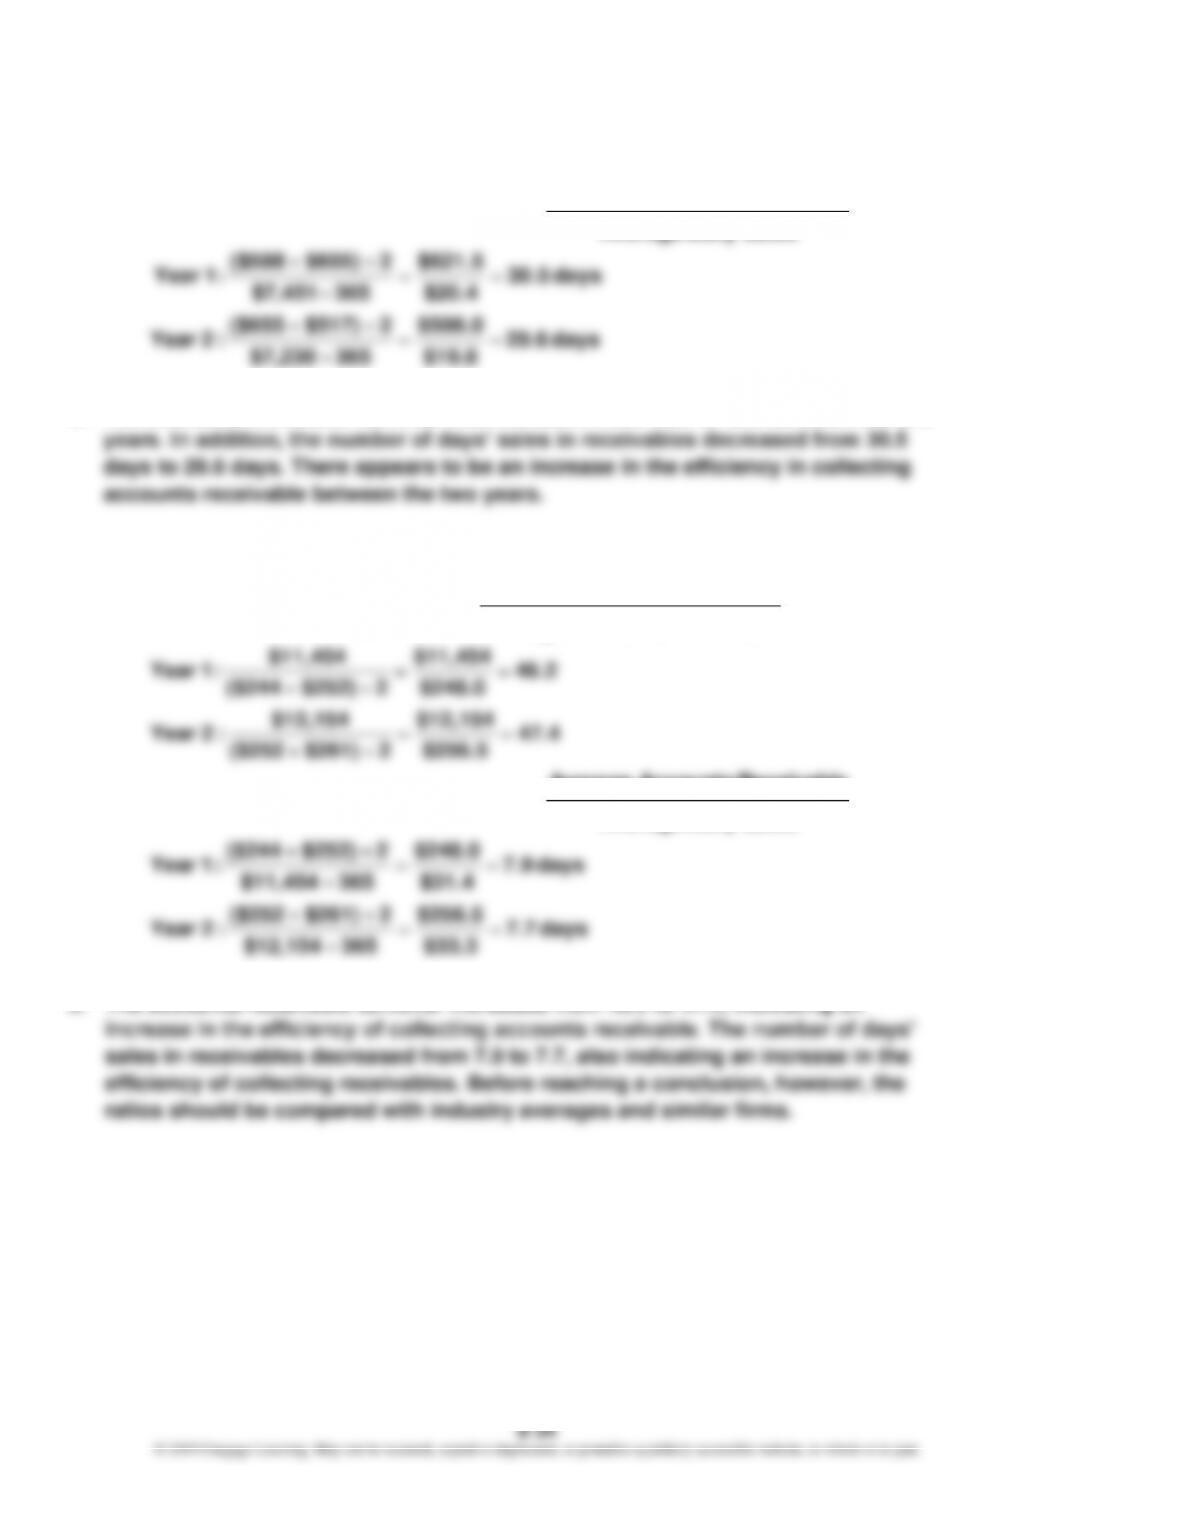
b.
Sales Daily Average
Receivable AccountsAverage
sReceivable in Sales Days’ of Number =
days 29.6
$19.8
$586.0
365 $7,230
2 $517) ($655
:2 Year
days 30.5
$20.4
$621.5
365 $7,451
2 $655) ($588
:1 Year
==
+
==
+
c. The accounts receivable turnover has increased from 12.0 to 12.3 between the two
MAD 8–3
a.
Receivable AccountsAverage
Sales
Turnover Receivable Accounts =
47.4
$256.5
$12,154
2 $261) ($252
$12,154
:2 Year
46.2
$248.0
$11,454
2 $252) ($244
$11,454
:1 Year
==
+
==
+
b.
Sales Daily Average
Receivable AccountsAverage
sReceivable in Sales Days’ of Number =
days 7.7
$33.3
$256.5
365 $12,154
2 $261) ($252
:2 Year
days 7.9
$31.4
$248.0
365 $11,454
2 $252) ($244
:1 Year
==
+
==
+
c. The accounts receivable turnover increased from 46.2 to 47.4, indicating an
8–35
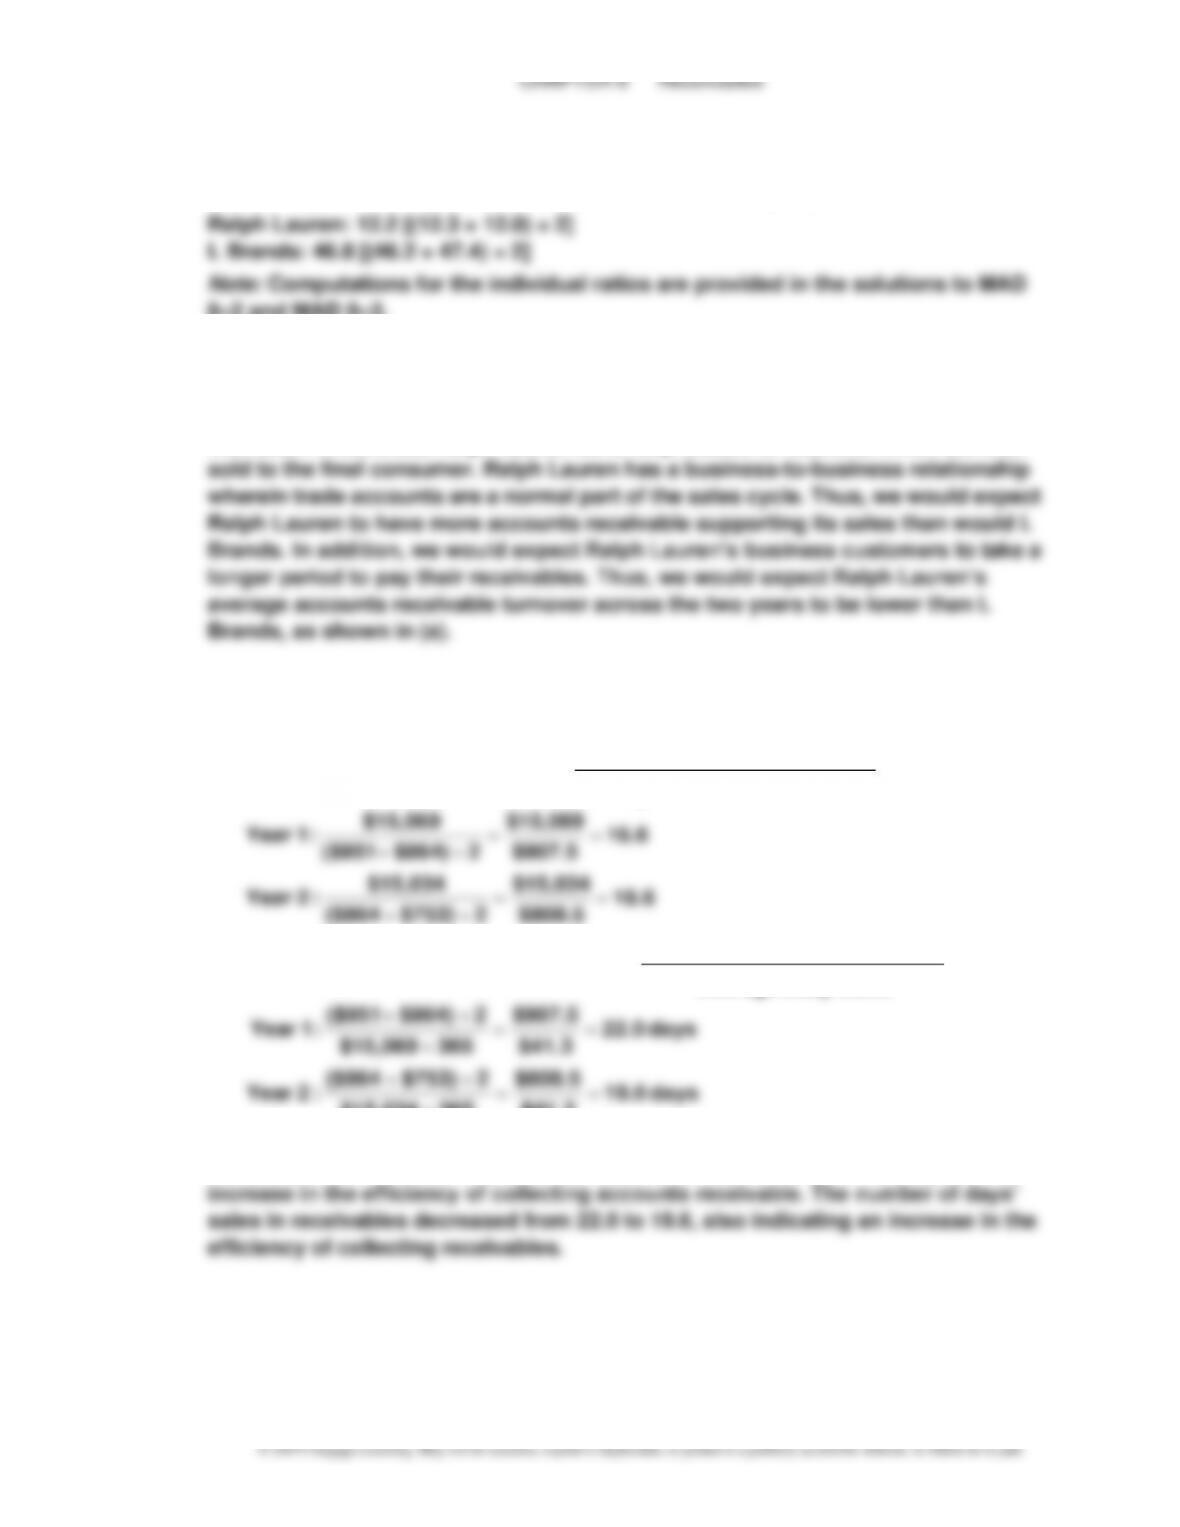
MAD 8–4
a. The average accounts receivable turnover for each company follows:
8–2 and MAD 8–3.
b. L Brands has the higher average accounts receivable turnover.
c. L Brands operates a specialty retail chain of stores that sell directly to individual
consumers. Many of these consumers (retail customers) pay with credit cards or
with cash. In contrast, Ralph Lauren sells its products to retailers, which are then
MAD 8–5
a.
Receivable AccountsAverage
Sales
Turnover Receivable Accounts =
18.6
$808.5
$15,034
2 $753) ($864
$15,034
:2 Year
16.6
$907.5
$15,069
2 $864) ($951
$15,069
:1 Year
==
+
==
+
b.
Sales Daily Average
Receivable AccountsAverage
sReceivable in Sales Days’ of Number =
days 19.6
$41.2
$808.5
365 $15,034
2 $753) ($864
:2 Year
days 22.0
$41.3
$907.5
365 $15,069
2 $864) ($951
:1 Year
==
+
==
+
c. The accounts receivable turnover increased from 16.6 to 18.6, indicating an
CHAPTER 8 Receivables
TAKE IT FURTHER
TIF 8–1
Estimates of uncollectible accounts receivable create a unique financial reporting
challenge. Because the company does not know with certainty the amount of accounts
receivable that will be uncollectible, there is no “correct” estimate. The company must
TIF 8–2
By computing interest using a 365-day year for depository accounts (liabilities), Bev is
TIF 8–3
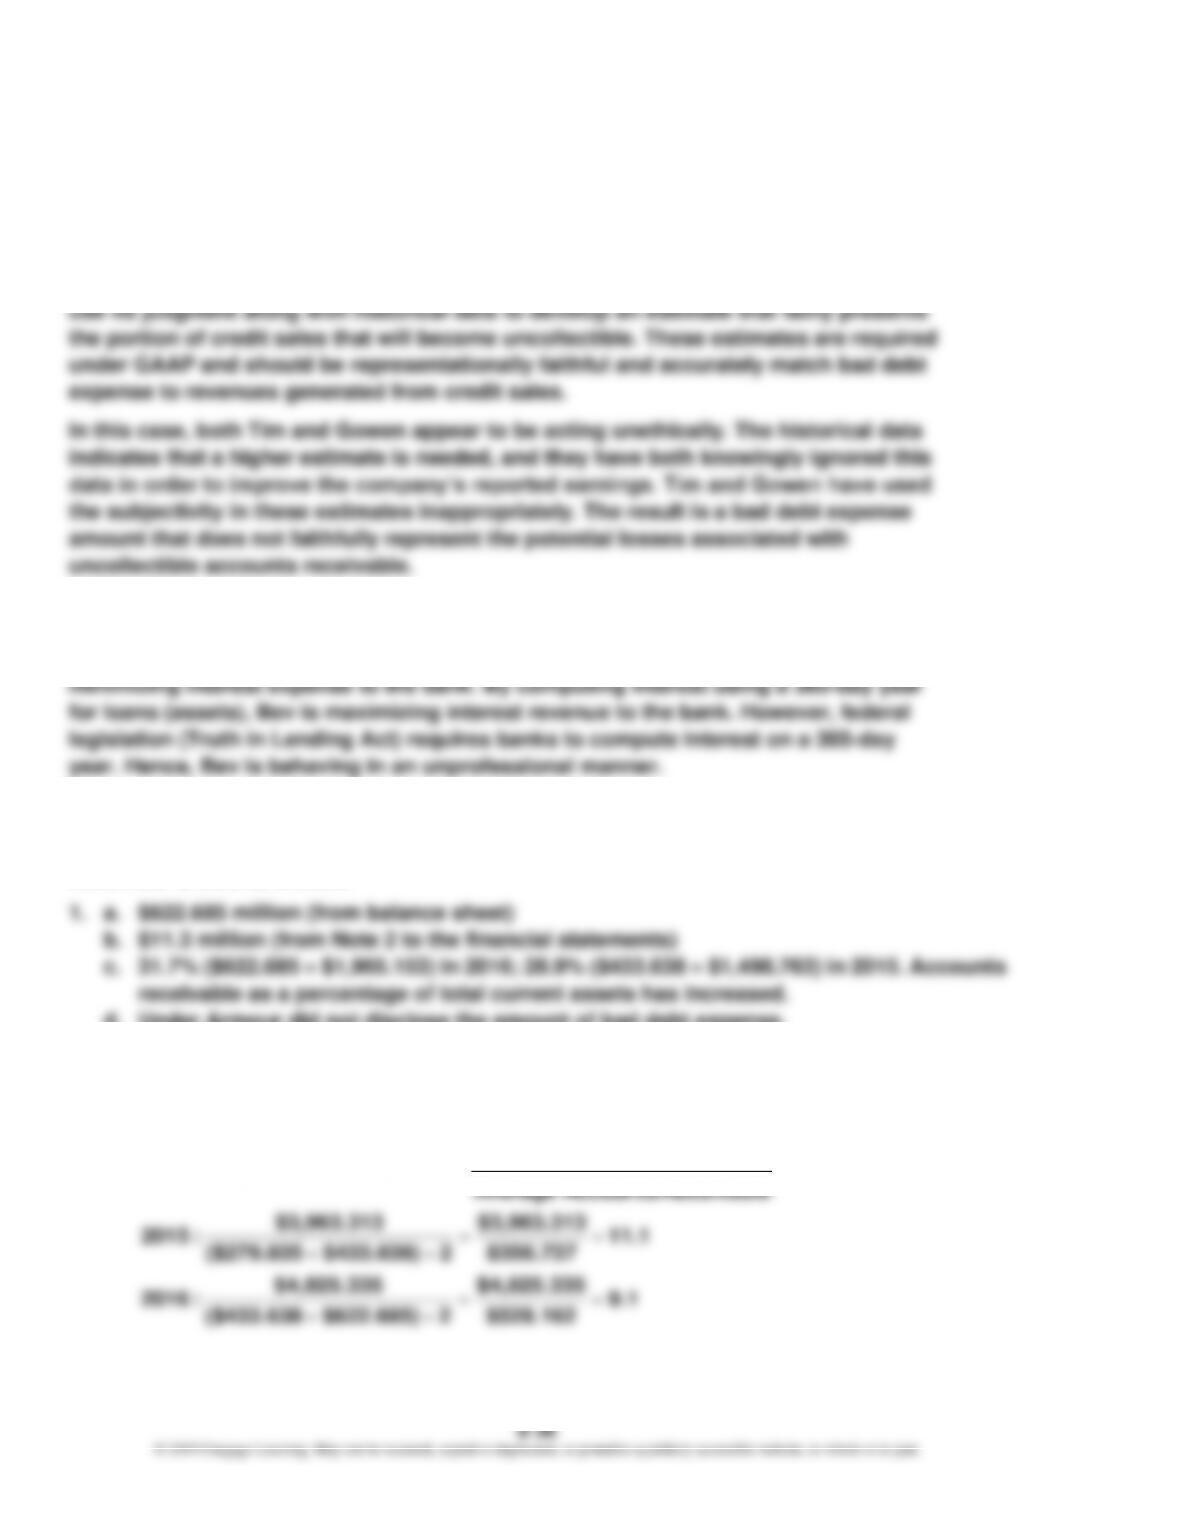
A sample solution based on Under Armour’s Form 10-K for the fiscal year ended
December 31, 2016, follows:
d. Under Armour did not disclose the amount of bad debt expense.
2. The company’s accounts receivable turnover has decreased between 2015 and 2016, as
shown below.
Amount in thousands
Receivable AccountsAverage
Sales
Turnover Receivable Accounts =
9.1
$528.162
$4,825.335
2 $622.685) ($433.638
$4,825.335
:2016
11.1
$356.737
$3,963.313
2 $433.638) ($279.835
$3,963.313
:2015
==
+
==
+
8–37
TIF 8–4
To: Todd Hurley, CEO
From: A+ Student
Re: Allowance Method for Uncollectible Accounts
Accounts receivable result from the sale of goods to customers on account. Because
Bad Debt Expense
XXX
Allowance for Doubtful Accounts
XXX
This adjusting entry affects both the income statement and balance sheet. On the
income statement, bad debt expense is matched against the revenues generated by
the accounts receivable. On the balance sheet, the accounts receivable balance is
CHAPTER 8 Receivables
8–38
© 2019 Cengage Learning. May not be scanned, copied or duplicated, or posted to a publicly accessible website, in whole or in part.
TIF 8–5
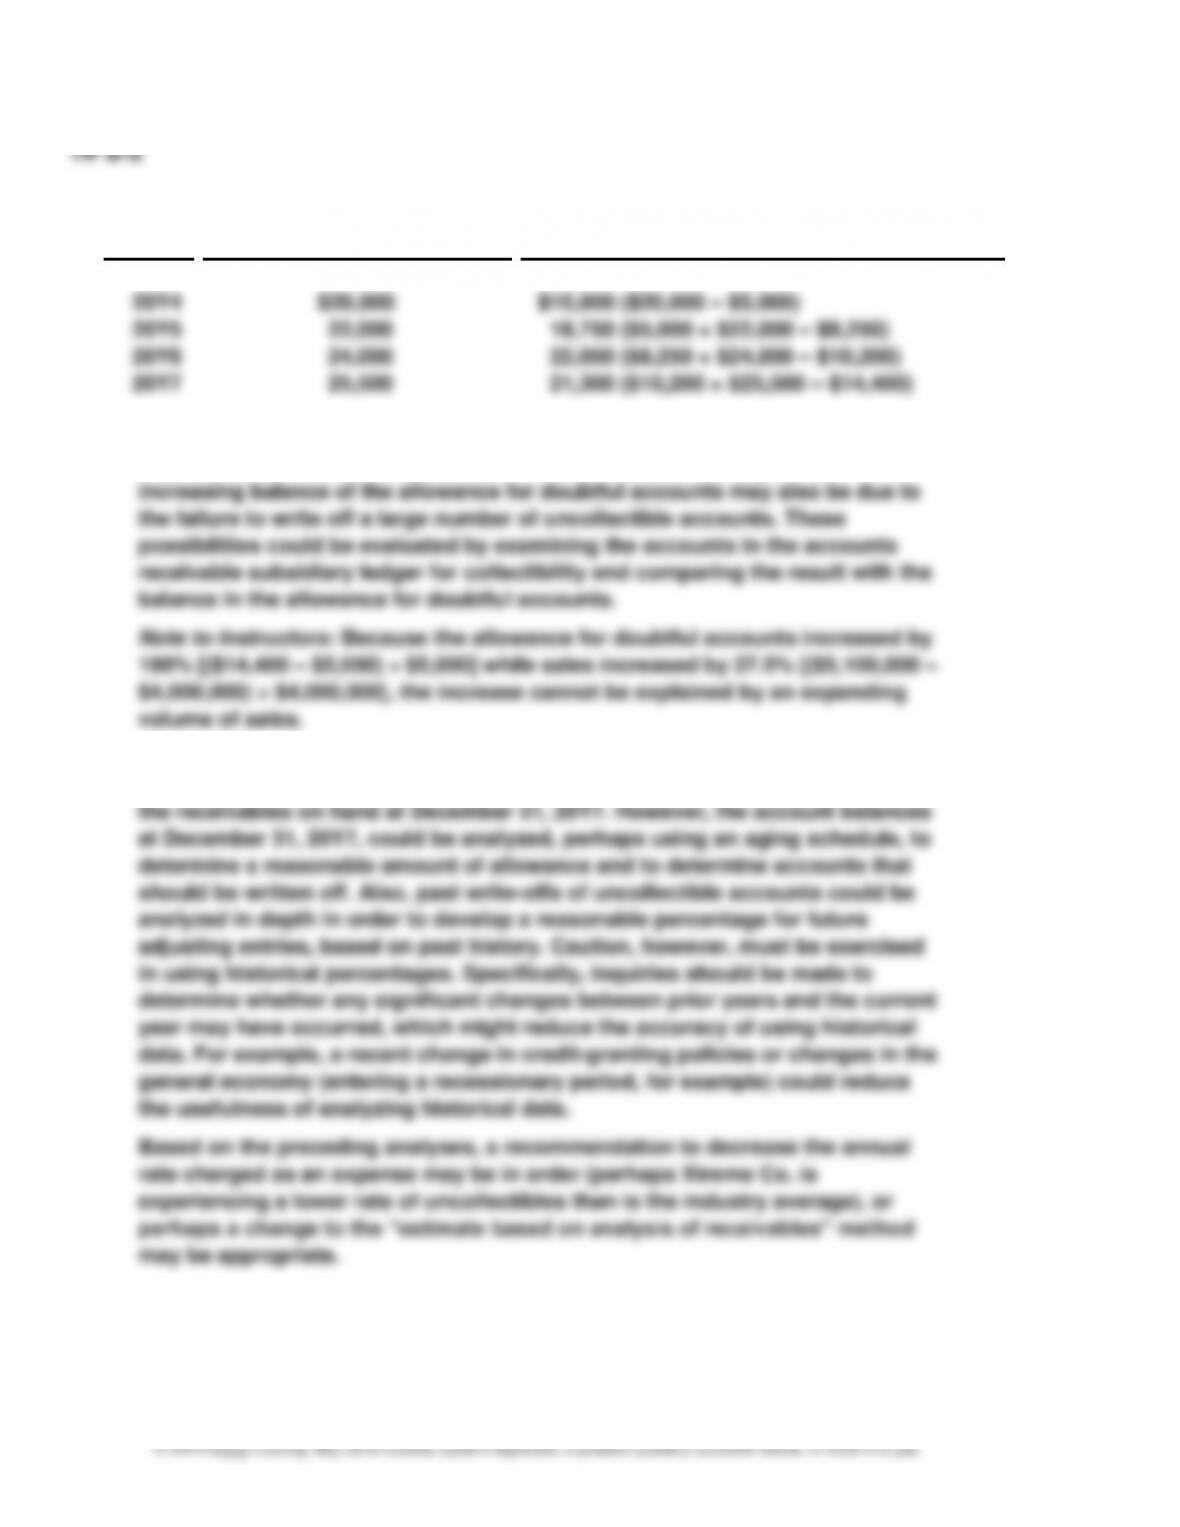
1. a. b.
Year
Addition to Allowance
for Doubtful Accounts
Accounts Written
Off During Year
20Y4
$20,000
$15,000 ($20,000 – $5,000)
20Y5
22,000
18,750 ($5,000 + $22,000 – $8,250)
20Y6
24,000
22,050 ($8,250 + $24,000 – $10,200)
20Y7
25,500
21,300 ($10,200 + $25,500 – $14,400)
2. a. The estimate of 1/2 of 1% of credit sales may be too large because the
allowance for doubtful accounts has steadily increased each year. The
b. The balance of Allowance for Doubtful Accounts that should exist at December
31, 20Y7, can only be determined after all attempts have been made to collect