CHAPTER 6 Inventories
6–34
Prob. 6–5B
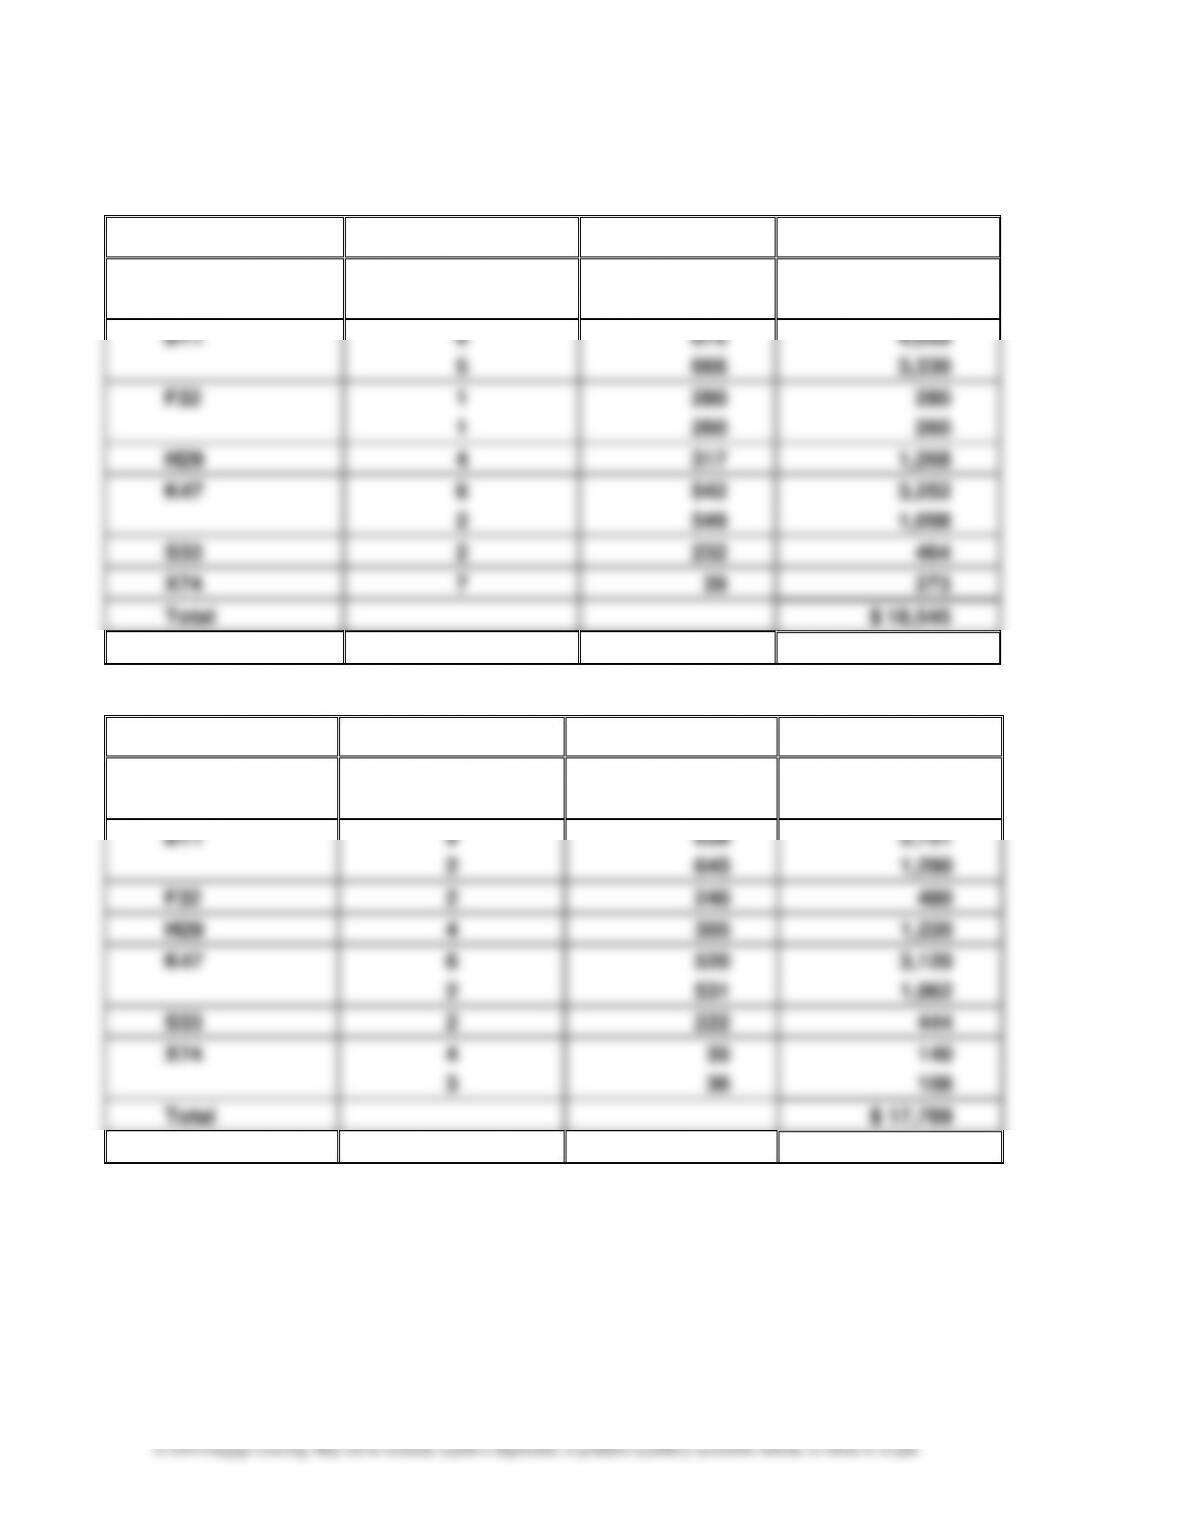
1. First-In, First-Out Method
Model
Quantity
Unit Cost
Total Cost
C55
3
$1,070
$ 3,210
1
1,060
1,060
D11
6
675
4,050
5
666
3,330
F32
1
280
280
1
260
260
H29
4
317
1,268
K47
6
542
3,252
2
549
1,098
S33
2
232
464
X74
7
39
273
Total
$ 18,545
2. Last-In, First-Out Method
Model
Quantity
Unit Cost
Total Cost
C55
3
$1,040
$ 3,120
1
1,054
1,054
D11
9
639
5,751
2
645
1,290
F32
2
240
480
H29
4
305
1,220
K47
6
520
3,120
2
531
1,062
S33
2
222
444
X74
4
35
140
3
36
108
Total
$ 17,789
CHAPTER 6 Inventories
6–35
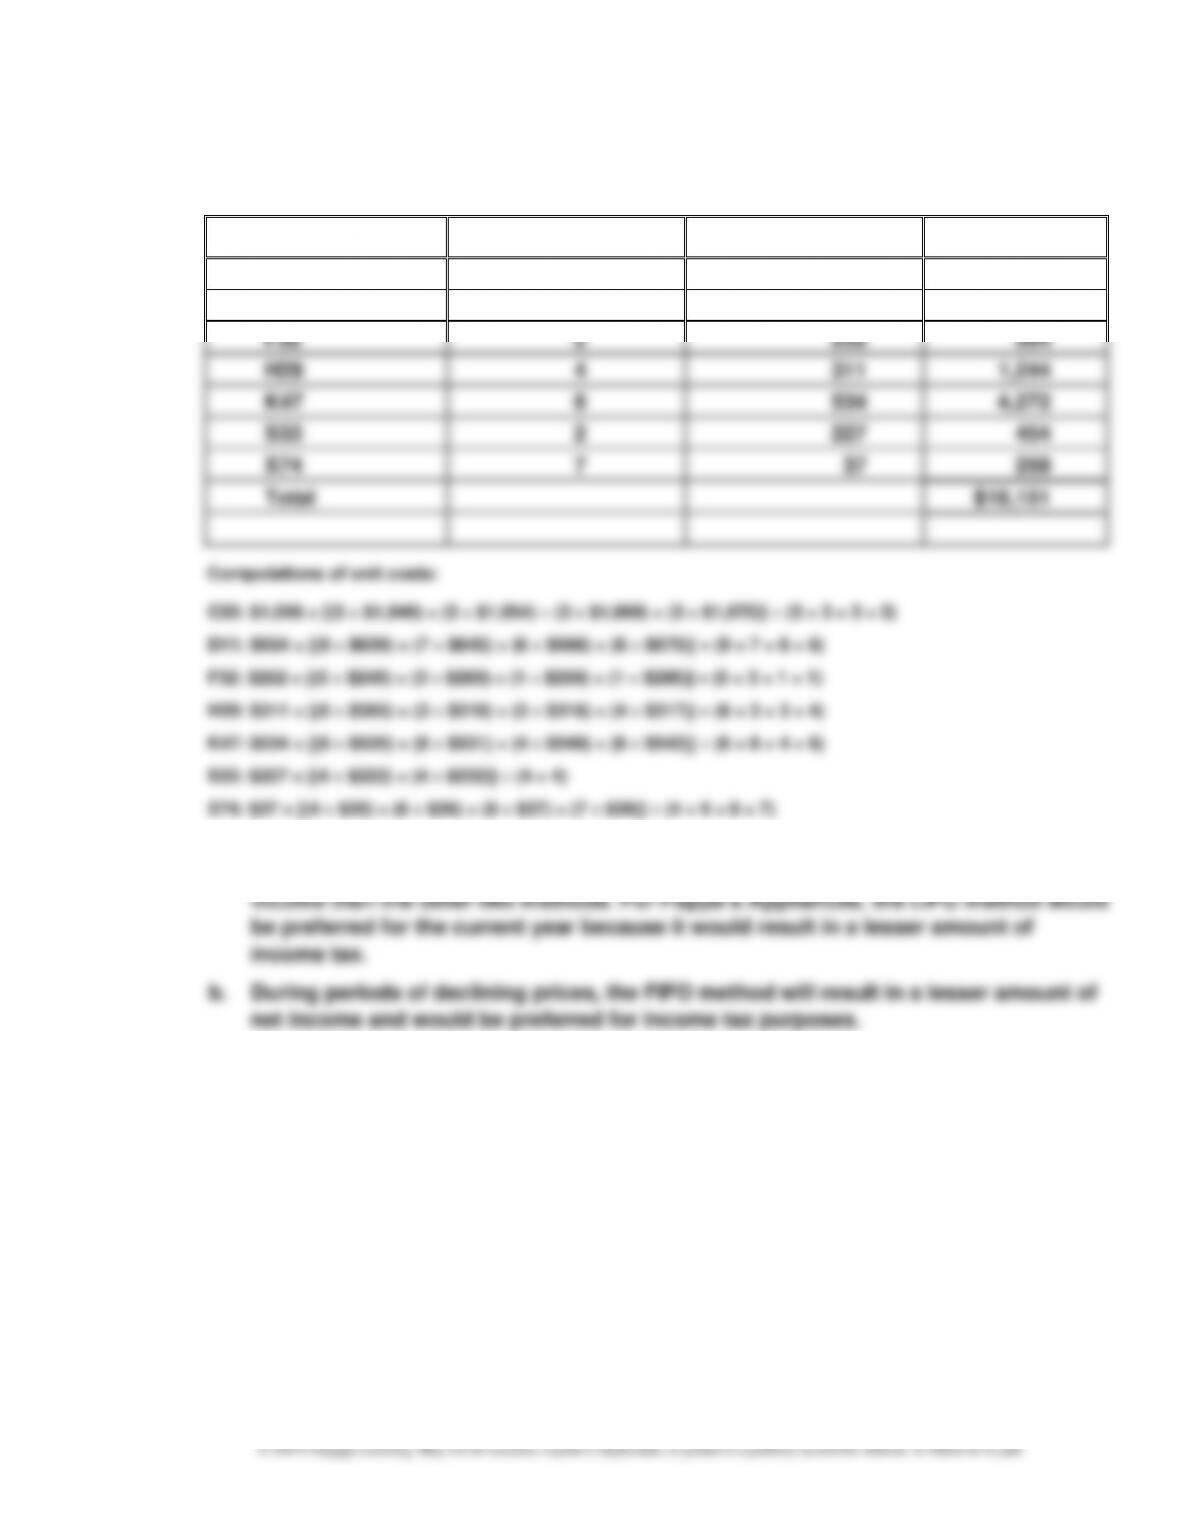
Prob. 6–5B (Concluded)
3. Weighted Average Cost Method
Model
Quantity
Unit Cost
Total Cost
C55
4
$1,056
$ 4,224
D11
11
654
7,194
F32
2
252
504
H29
4
311
1,244
K47
8
534
4,272
S33
2
227
454
X74
7
37
259
Total
$18,151
4. a. During periods of rising prices, the LIFO method will result in a lower cost of
inventory, a greater amount of cost of goods sold, and a lesser amount of net
CHAPTER 6 Inventories
6–36
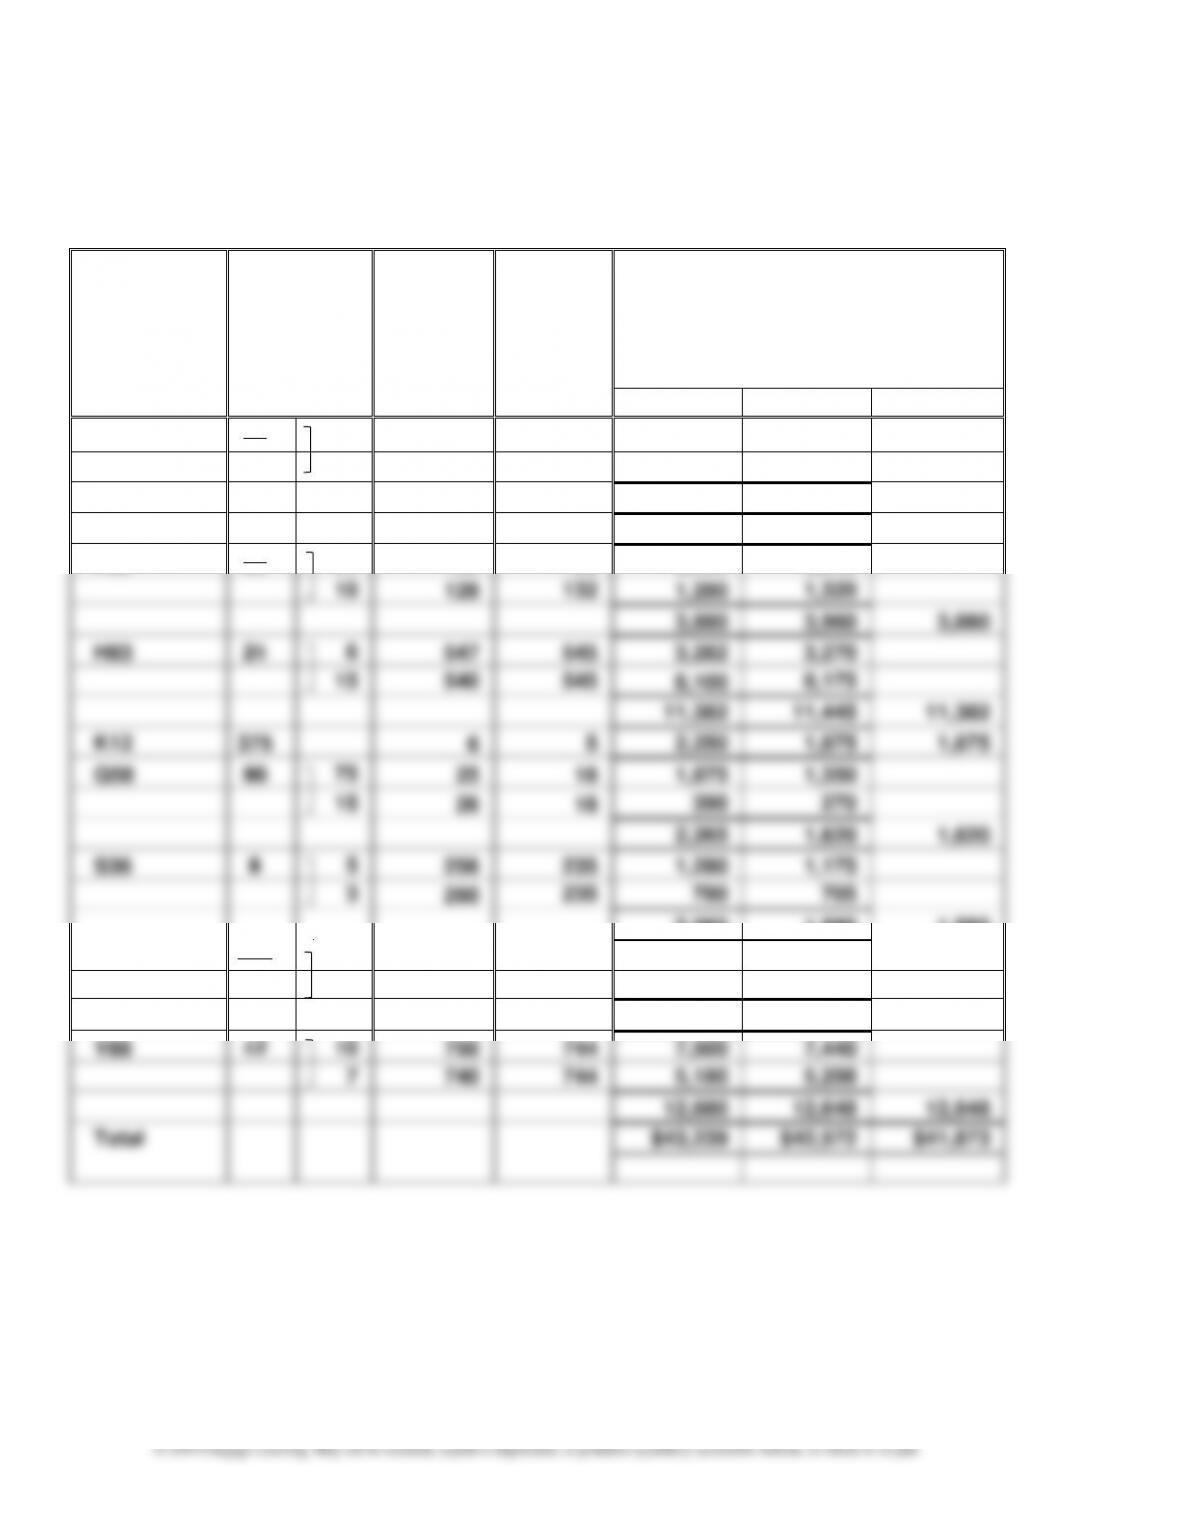
Prob. 6–6B
Inventory Sheet
December 31
Description
Inventory
Quantity
Cost
per
Unit
Market
Value per
Unit (Net
Realizable
Value)
Total
Cost
Market
LCM
A54
37
30
$ 60
$ 56
$ 1,800
$ 1,680
7
58
56
406
392
2,206
2,072
$ 2,072
C77
24
174
178
4,176
4,272
4,176
F66
30
20
130
132
2,600
2,640
10
128
132
1,280
1,320
3,880
3,960
3,880
H83
21
6
547
545
3,282
3,270
15
540
545
8,100
8,175
11,382
11,445
11,382
K12
375
6
5
2,250
1,875
1,875
Q58
90
75
25
18
1,875
1,350
15
26
18
390
270
2,265
1,620
1,620
S36
8
5
256
235
1,280
1,175
3
260
235
780
705
2,060
1,880
1,880
V97
140
100
17
20
1,700
2,000
40
16
20
640
800
2,340
2,800
2,340
Y88
17
10
750
744
7,500
7,440
7
740
744
5,180
5,208
12,680
12,648
12,648
Total
$43,239
$42,572
$41,873
CHAPTER 6 Inventories
6–37
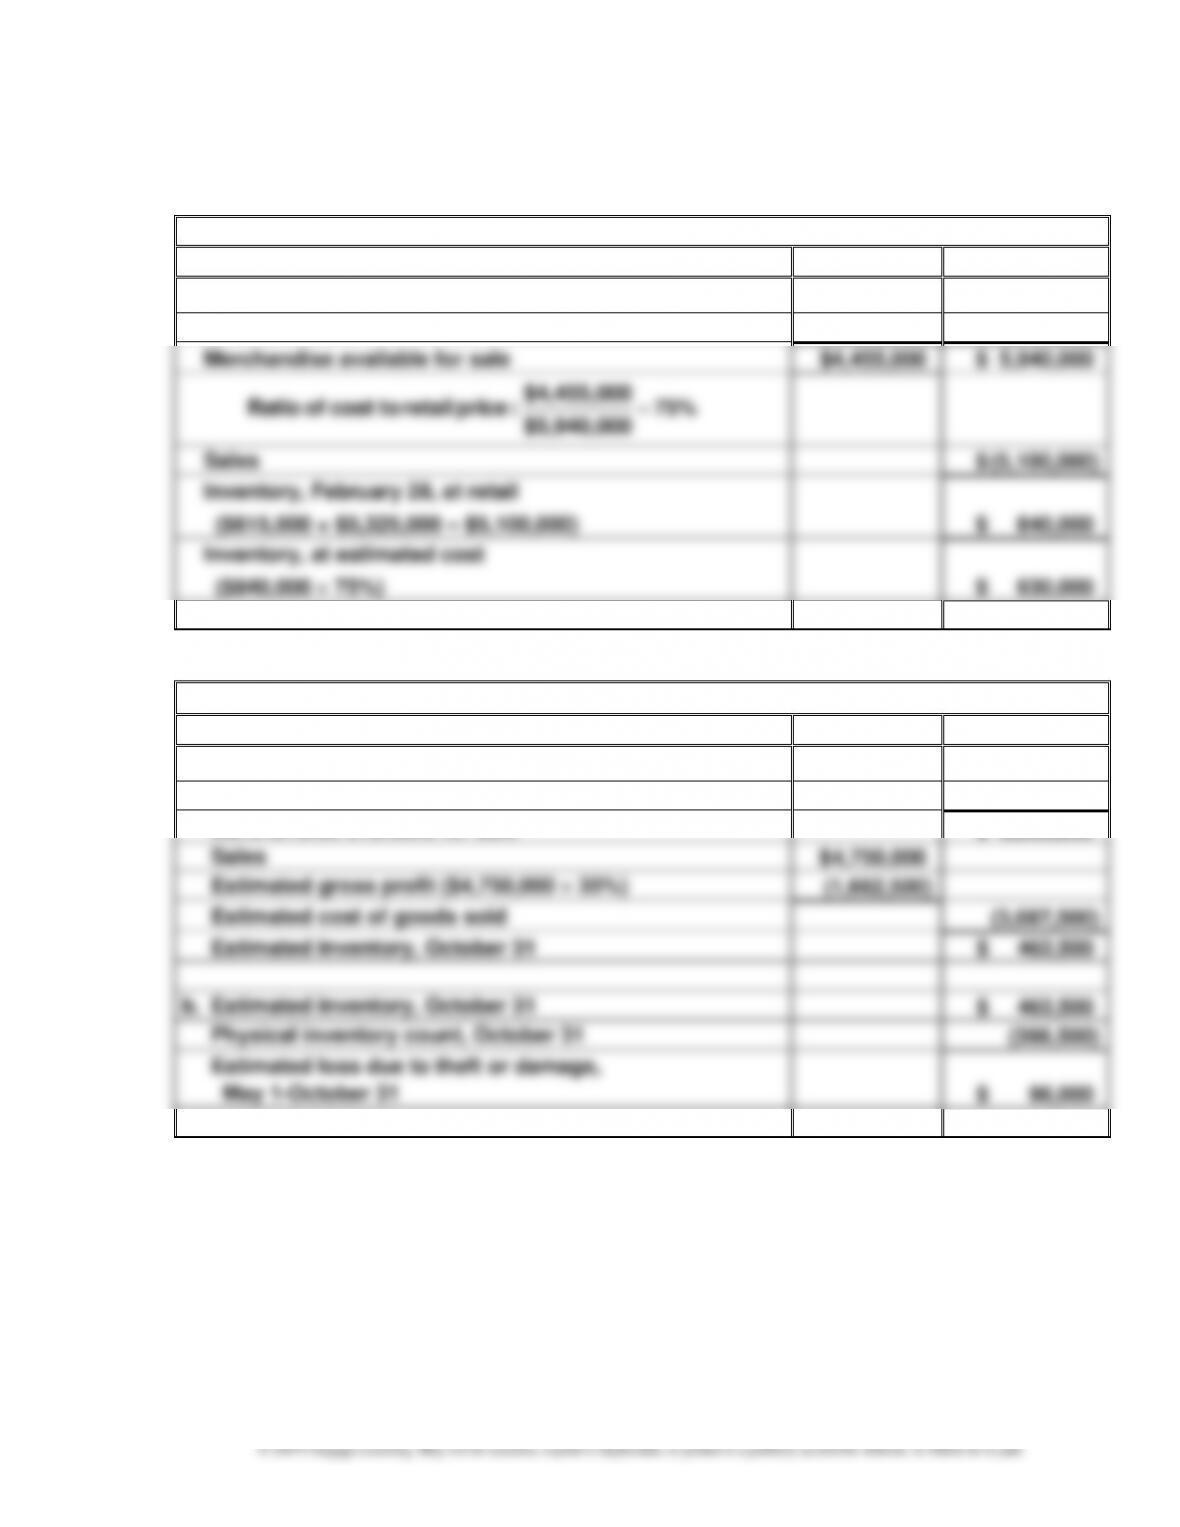
Appendix Prob. 6–7B
1.
Jaffe Co.
Cost
Retail
Inventory, February 1
$ 400,000
$ 615,000
Net purchases
4,055,000
5,325,000
Merchandise available for sale
$4,455,000
$ 5,940,000
75%
$5,940,000
$4,455,000
:price retail tocost of Ratio =
Sales
$ (5,100,000)
Inventory, February 28, at retail
($615,000 + $5,325,000 – $5,100,000)
$ 840,000
Inventory, at estimated cost
($840,000 75%)
$ 630,000
2.
Coronado Co.
Cost
a. Inventory, May 1
$ 400,000
Net purchases
3,150,000
Merchandise available for sale
$ 3,550,000
Sales
$ 4,750,000
Estimated gross profit ($4,750,000 35%)
(1,662,500)
Estimated cost of goods sold
(3,087,500)
Estimated inventory, October 31
$ 462,500
b. Estimated inventory, October 31
$ 462,500
Physical inventory count, October 31
(366,500)
Estimated loss due to theft or damage,
May 1-October 31
$ 96,000
CHAPTER 6 Inventories
6–38
MAKE A DECISION
MD 6–1
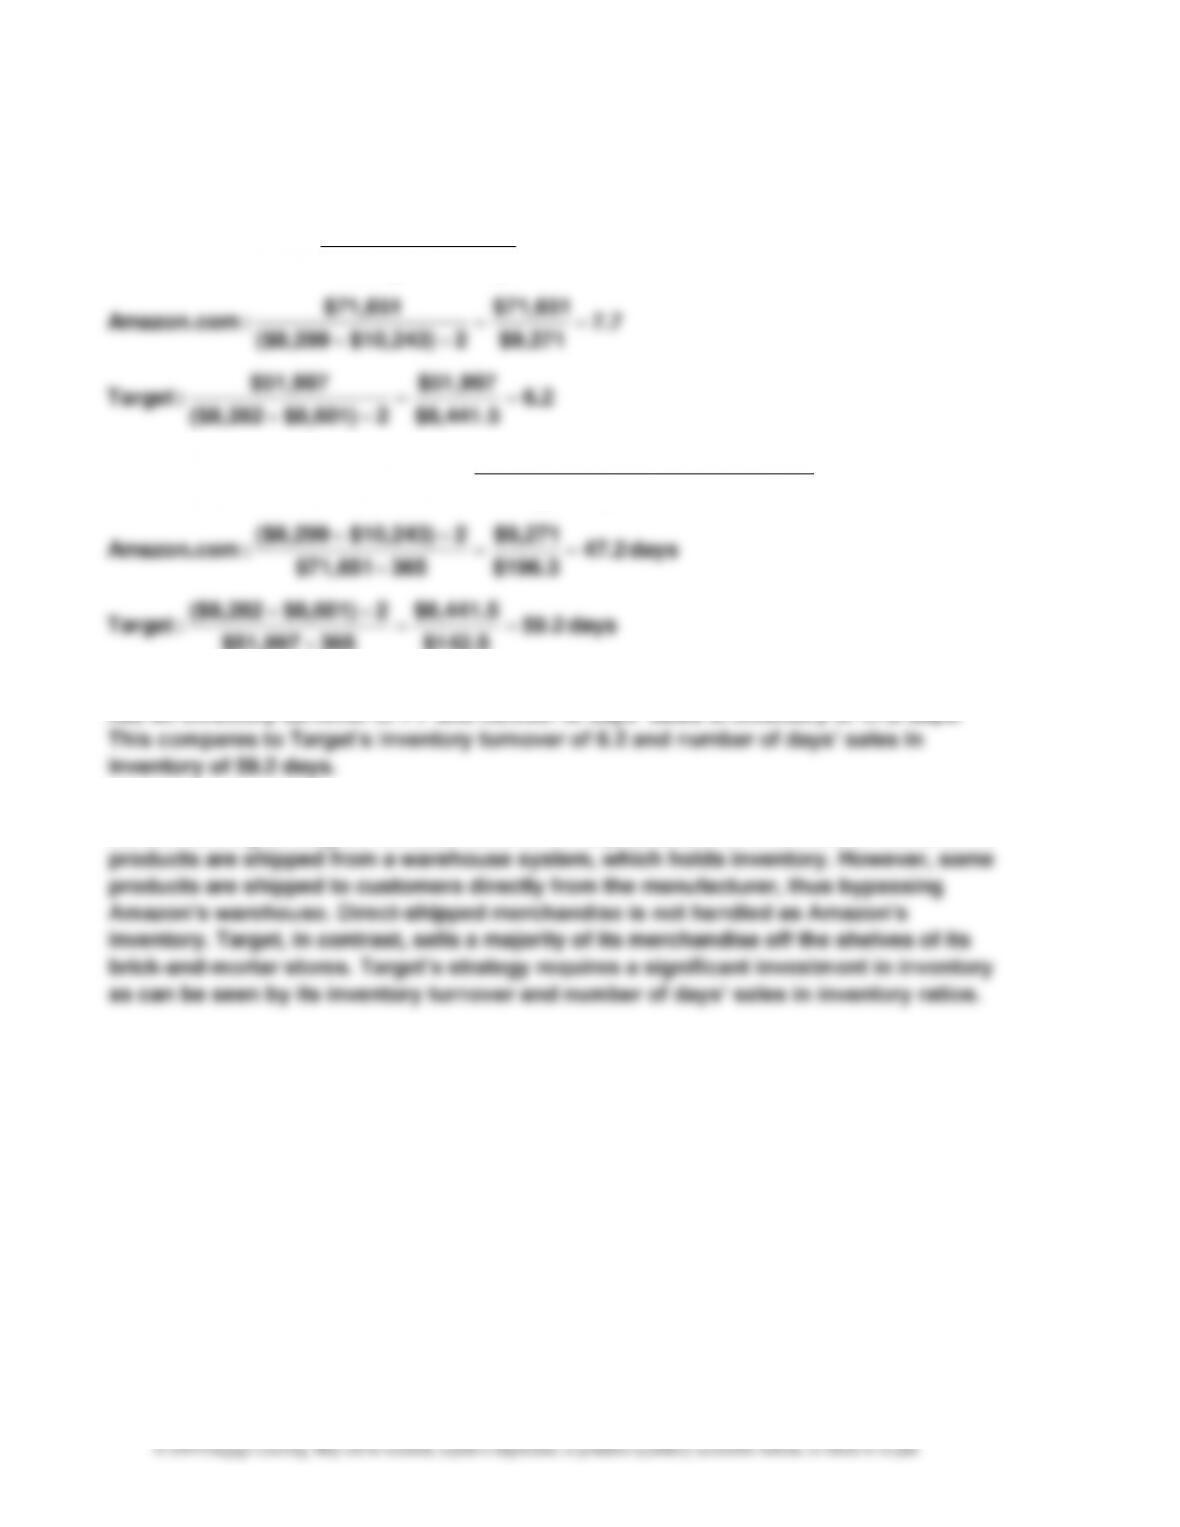
a.
Inventory Average
Sold Goods ofCost
Turnover Inventory =
7.7
$9,271
$71,651
2 $10,243) ($8,299
$71,651
:Amazon.com ==
+
6.2
$8,441.5
$51,997
2 $8,601) ($8,282
$51,997
:Target ==
+
b.
Sold Goods ofCost Daily Average
Inventory Average
Inventory in Sales Days’ of Number =
days 47.2
$196.3
$9,271
365 $71,651
2 $10,243) ($8,299
:Amazon.com ==
+
days 59.2
$142.5
$8,441.5
365 $51,997
2 $8,601) ($8,282
:Target ==
+
c. Amazon appears to more efficiently manage its inventories compared to Target. Amazon
has an inventory turnover of 7.7 and number of days’ sales in inventory of 47.2 days.
d. The difference in inventory efficiency is likely due to the difference in the companies’
merchandising strategies. Amazon sells all of its products over the Internet. Some of its
CHAPTER 6 Inventories
MD 6–2
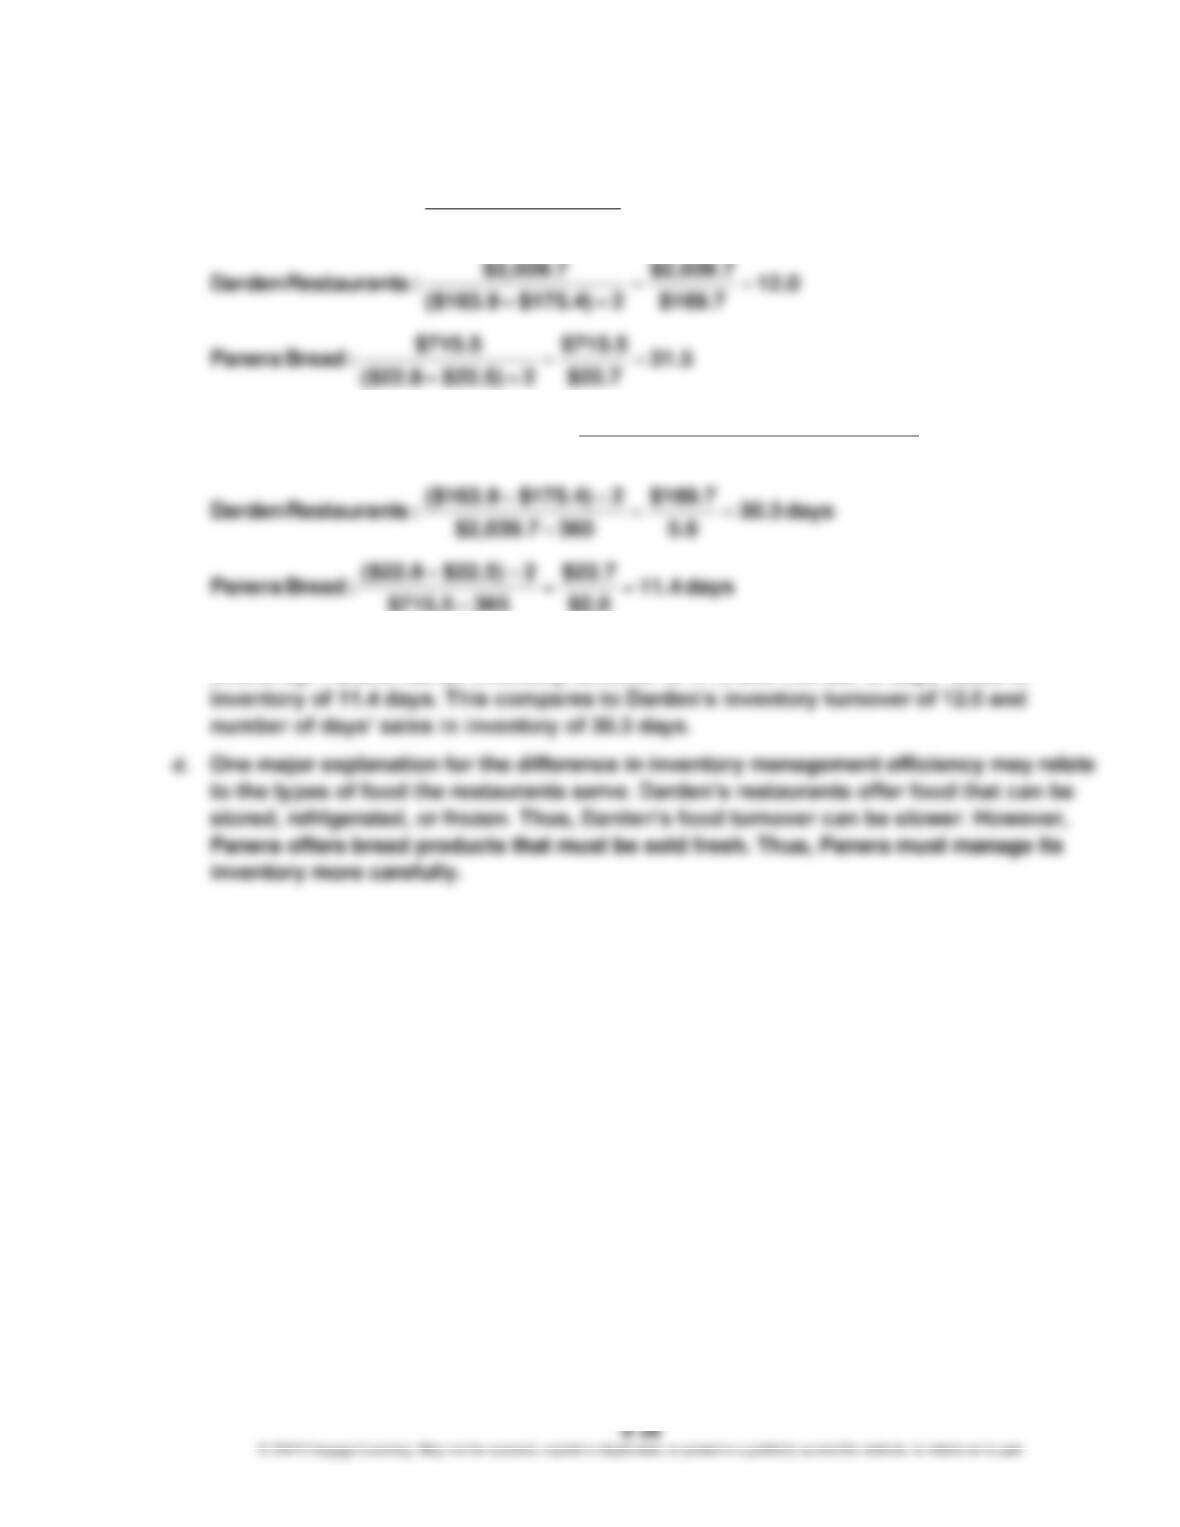
a.
Inventory Average
Sold Goods ofCost
Turnover Inventory =
12.0
$169.7
$2,039.7
2 $175.4) ($163.9
$2,039.7
:sRestaurant Darden ==
+
31.5
$22.7
$715.5
2 $22.5) ($22.8
$715.5
:Bread Panera ==
+
b.
Sold Goods ofCost Daily Average
Inventory Average
Inventory in Sales Days’ of Number =
days 30.3
5.6
$169.7
365 $2,039.7
2 $175.4) ($163.9
:sRestaurant Darden ==
+
days 11.4
$2.0
$22.7
365 $715.5
2 $22.5) ($22.8
:Bread Panera ==
+
c. Panera appears to manage its food, beverage, and packaging inventories more
efficiently. Panera has an inventory turnover of 31.5 and number of days’ sales in
6–40
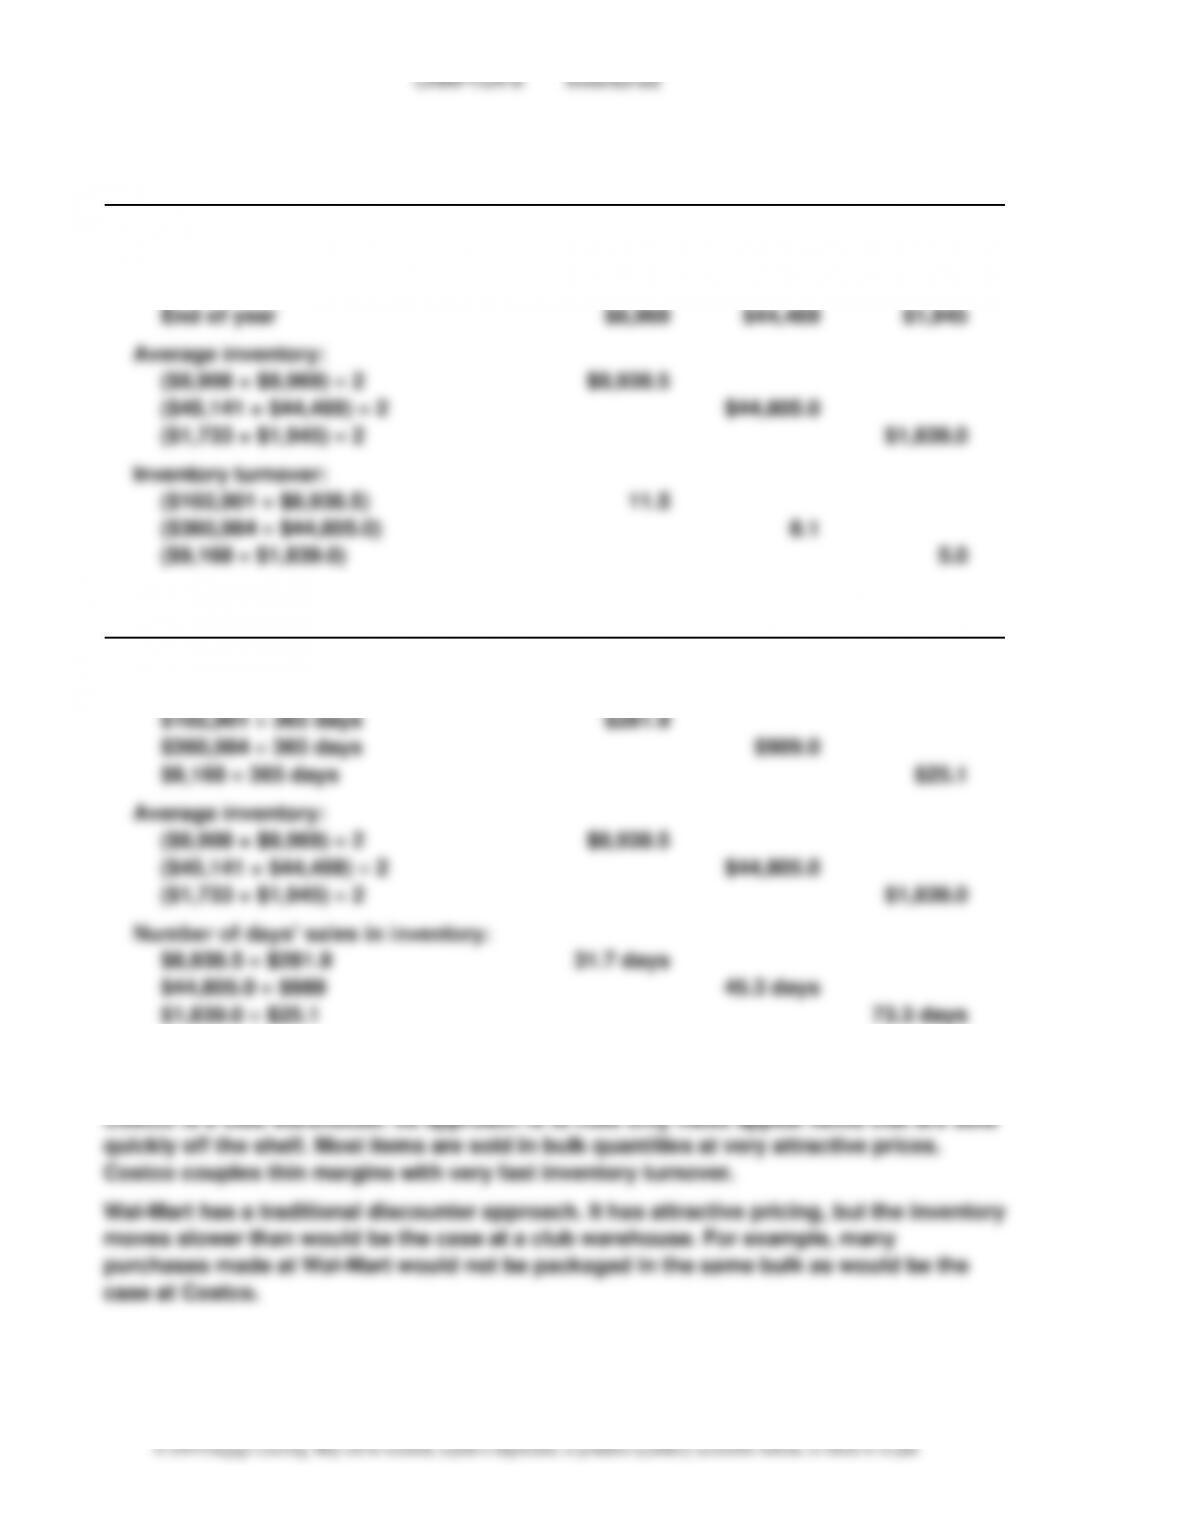
MD 6–3
a.
(In millions)
Costco
Wal-Mart
Nordstrom
Cost of goods sold
$102,901
$360,984
$9,168
Inventories:
Beginning of year
$8,908
$45,141
$1,733
End of year
$8,969
$44,469
$1,945
Average inventory:
($8,908 + $8,969) 2
$8,938.5
($45,141 + $44,469) 2
$44,805.0
($1,733 + $1,945) 2
$1,839.0
Inventory turnover:
($102,901 $8,938.5)
11.5
($360,984 $44,805.0)
8.1
($9,168 $1,839.0)
5.0
b.
(In millions)
Costco
Wal-Mart
Nordstrom
Cost of goods sold
$102,901
$360,984
$9,168
Average daily cost of goods sold:
$102,901 365 days
$281.9
$360,984 365 days
$989.0
$9,168 365 days
$25.1
Average inventory:
($8,908 + $8,969) 2
$8,938.5
($45,141 + $44,469) 2
$44,805.0
($1,733 + $1,945) 2
$1,839.0
Number of days’ sales in inventory:
$8,938.5 $281.9
31.7 days
$44,805.0 $989
45.3 days
$1,839.0 $25.1
73.3 days
c. Both the inventory turnover ratio and the number of days’ sales in inventory reflect the
merchandising approaches of the three companies.
CHAPTER 6 Inventories
6–41
MAD 6–3 (Concluded)
Nordstrom is a high-end fashion retailer. It provides a wide assortment of specialty and
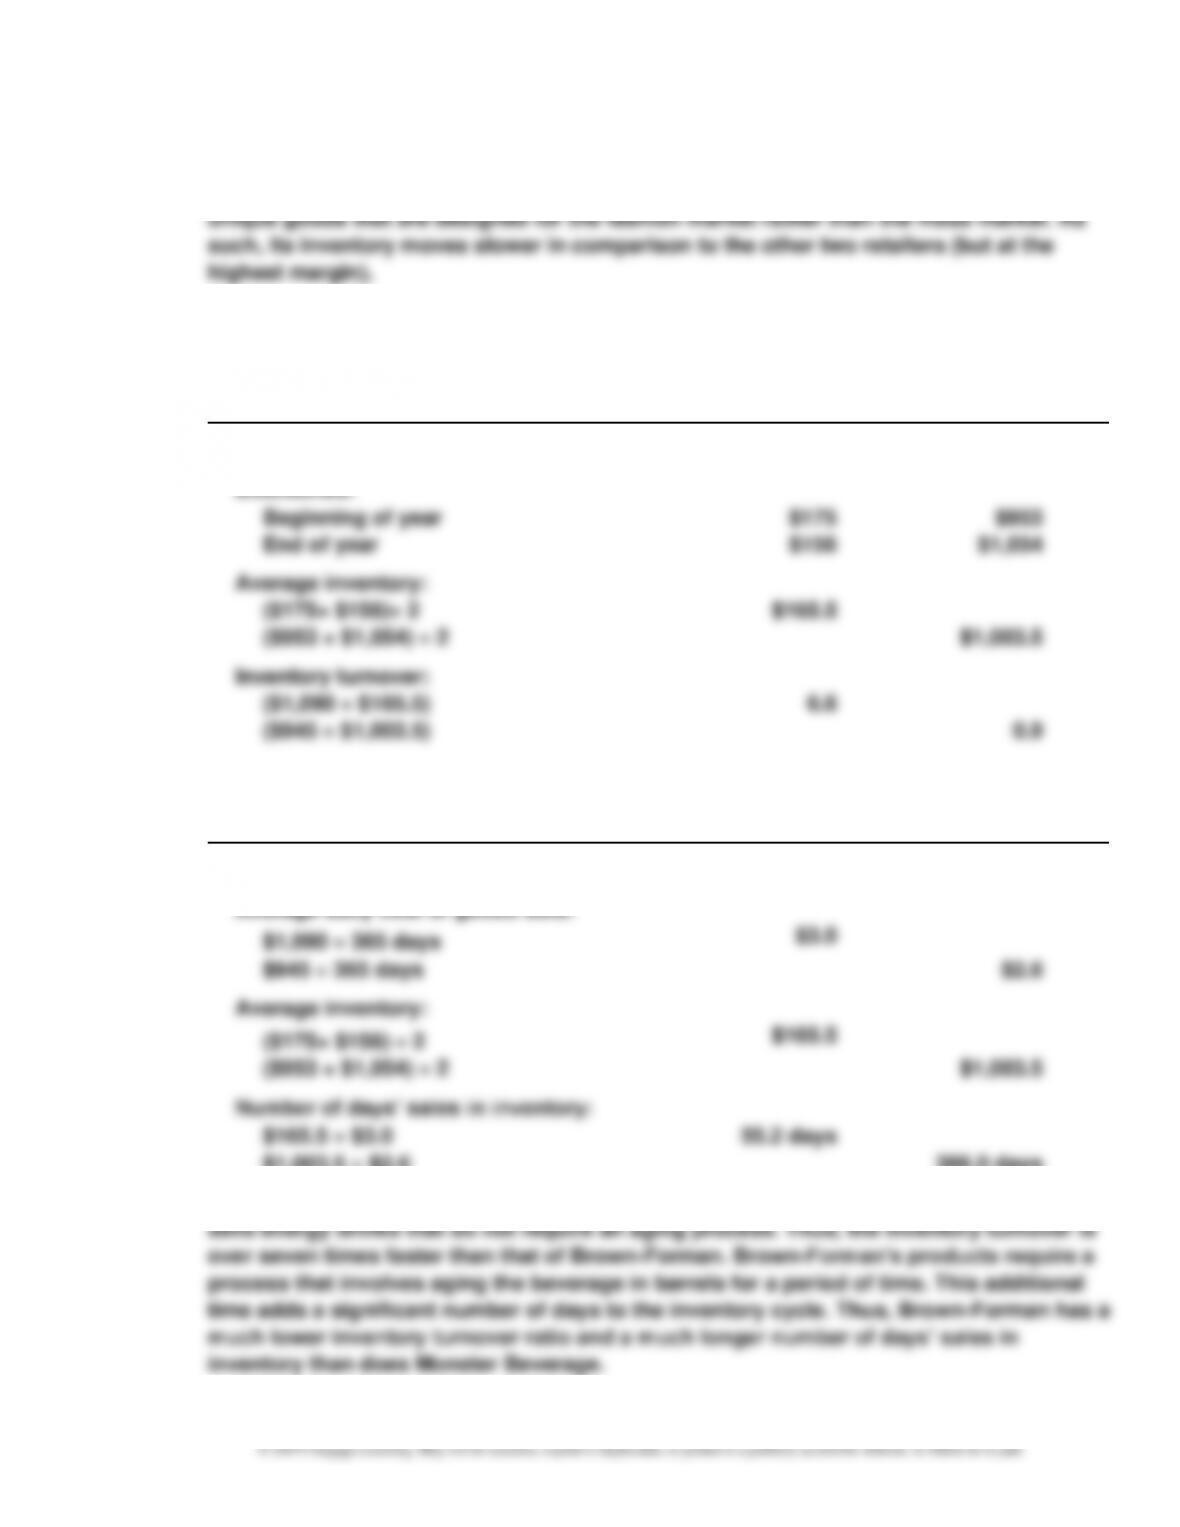
MAD 6–4
a.
Monster
Brown-
(In millions)
Beverage
Forman
Cost of goods sold
$1,090
$945
Inventories:
Beginning of year
$175
$953
End of year
$156
$1,054
Average inventory:
($175+ $156) 2
$165.5
($953 + $1,054) 2
$1,003.5
Inventory turnover:
($1,090 $165.5)
6.6
($945 $1,003.5)
0.9
b.
Monster
Brown-
(In millions)
Beverage
Forman
Cost of goods sold
$1,090
$945
Average daily cost of goods sold:
$1,090 365 days
$3.0
$945 365 days
$2.6
Average inventory:
($175+ $156) 2
$165.5
($953 + $1,054) 2
$1,003.5
Number of days’ sales in inventory:
$165.5 $3.0
55.2 days
$1,003.5 $2.6
386.0 days
c. Both companies produce beverage products. However, Monster Beverage produces and
CHAPTER 6 Inventories
6–42
TAKE IT FURTHER
TIF 6–1
1. In the short run, Sizemo Electroniks may benefit slightly from the inflated inventory
values and higher earnings. However, at some point in the future, the inventory will either
2. The users of Sizemo’s financial statements are harmed by this decision, as it does not
result in financial statements that fairly present the company’s financial results.
3. No. Tina is acting unethically by instructing Jay to intentionally ignore a lower- of–cost–
or–market adjustment. As Jay’s supervisor, Tina has a responsibility to ensure her
TIF 6–2
Because the title to merchandise shipped FOB shipping point passes to the buyer
CHAPTER 6 Inventories
TIF 6–3
A sample solution based on Best Buy’s Form 10-K for the fiscal year ended May 31, 2016,
follows:
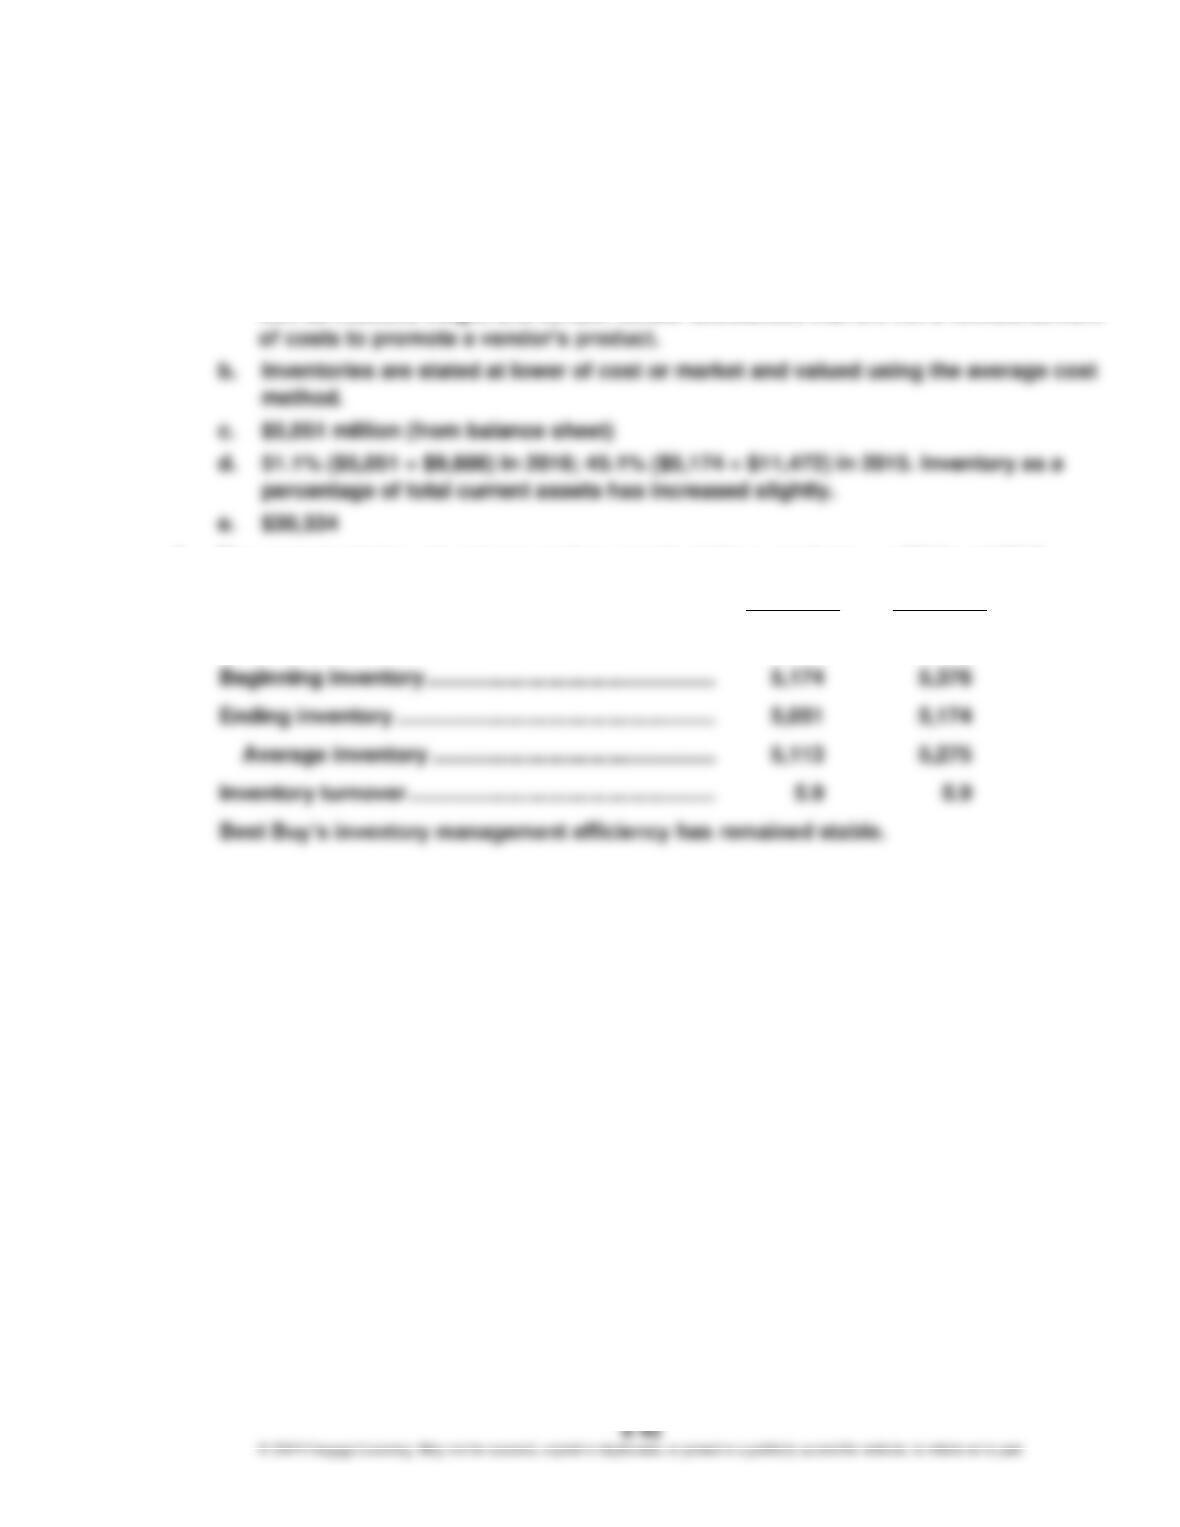
1. a. Inventory costs primarily consist of product cost from the company’s suppliers as
well as inbound freight and certain vendor allowances that are not a reimbursement
2. The company’s inventory turnover has remained the same between 2015 and 2016.
2016 2015
Cost of goods sold ………………………………………….. $30,334 $31,292
6–44
TIF 6–4
Memo
To: Ms. Connie Kilmer
President, Golden Eagle Company
From: A+ Student
Re: Comparison of LIFO and FIFO inventory methods
LIFO and FIFO are alternative methods of applying unit cost to the units that are sold during
the year and those units that remain in ending inventory at the end of the year. The LIFO
method is often viewed as the best basis for reflecting income from operations. This is
because the LIFO method matches the most current cost of merchandise purchases against
CHAPTER 6 Inventories
TIF 6–4 (Concluded)
Supporting computations:
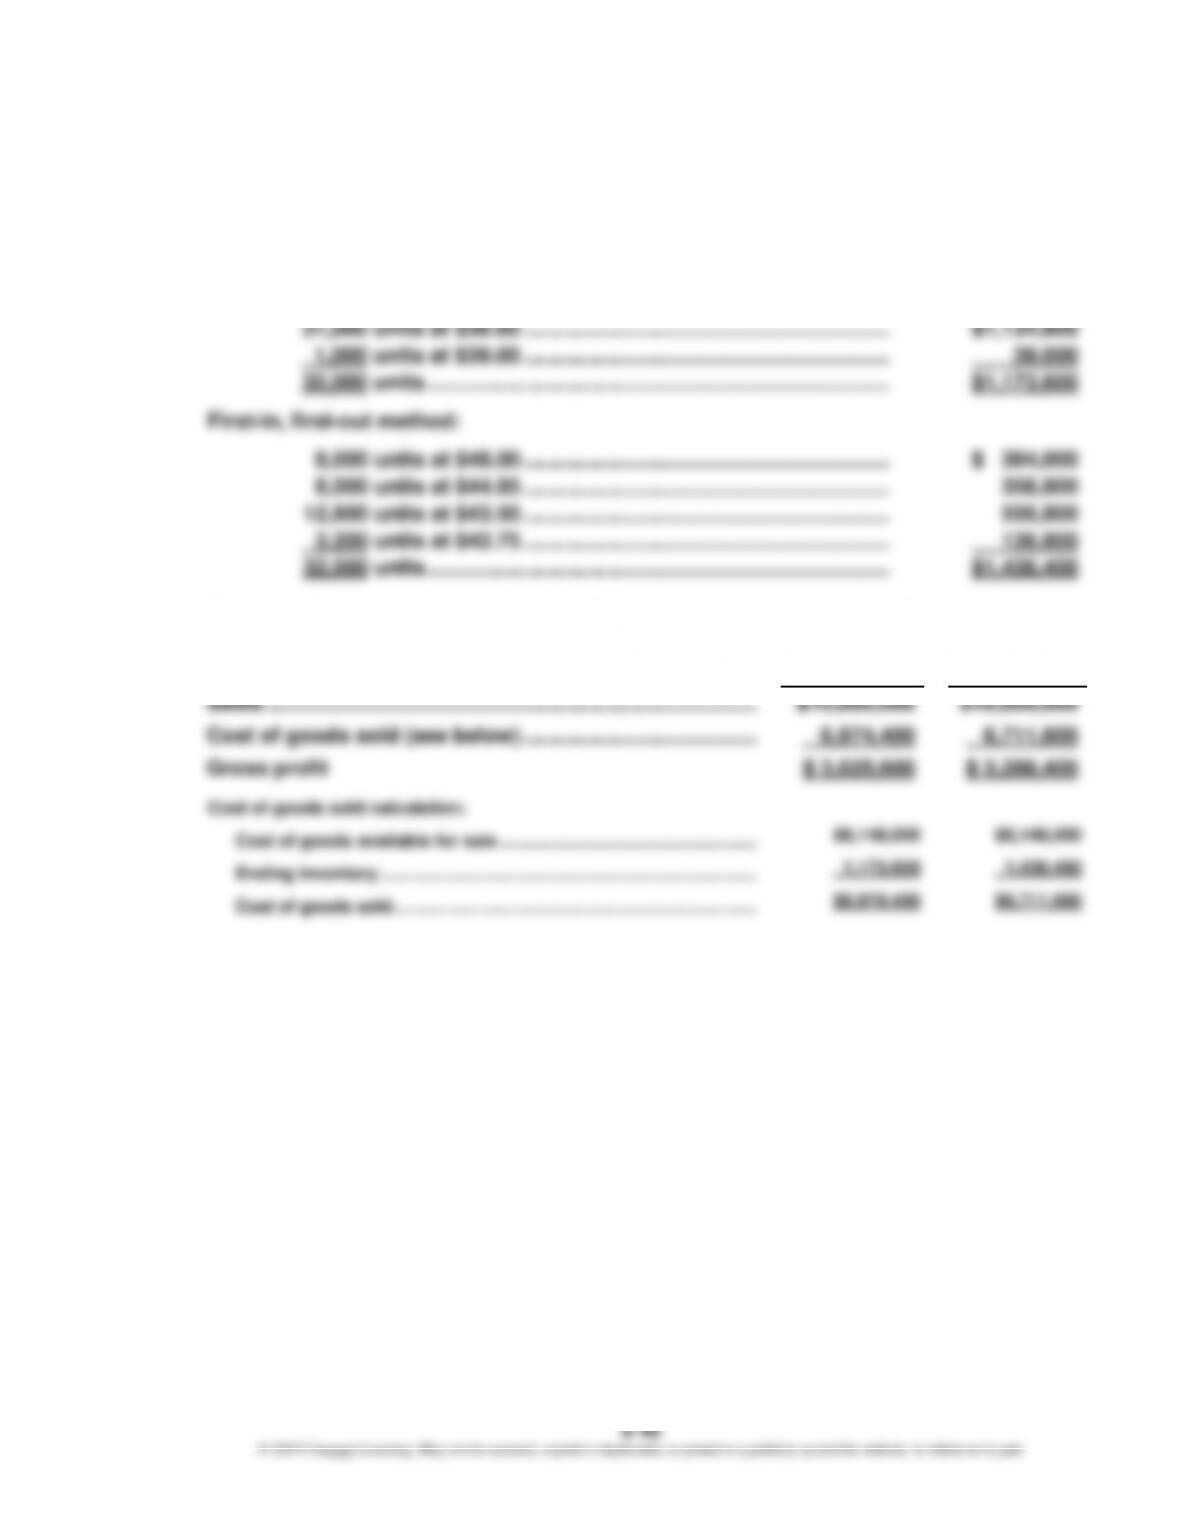
The cost of ending inventory under the last-in, first-out and first-in, first-out methods is as
follows:
Last-in, first-out method:
The cost of goods sold and gross profit under each method are as follows:
FIFO
LIFO
Sales ……………………………………………………………………….
Cost of goods sold (see below) …………………………………
Gross profit
Cost of goods sold calculation:
Cost of goods available for sale ……………………………………………..
Ending inventory ……………………………………………………………………
Cost of goods sold …………………………………………………………………
$10,000,000
6,974,400
$ 3,025,600
$8,148,000
1,173,600
$6,974,400
$10,000,000
6,711,600
$ 3,288,400
$8,148,000
1,436,400
$6,711,600