CHAPTER 6 Inventories
6–21
Prob. 6–2A (Concluded)
2. Total sales …………………………………………………………………… $ 19,875,000
= $562,500 + $318,750
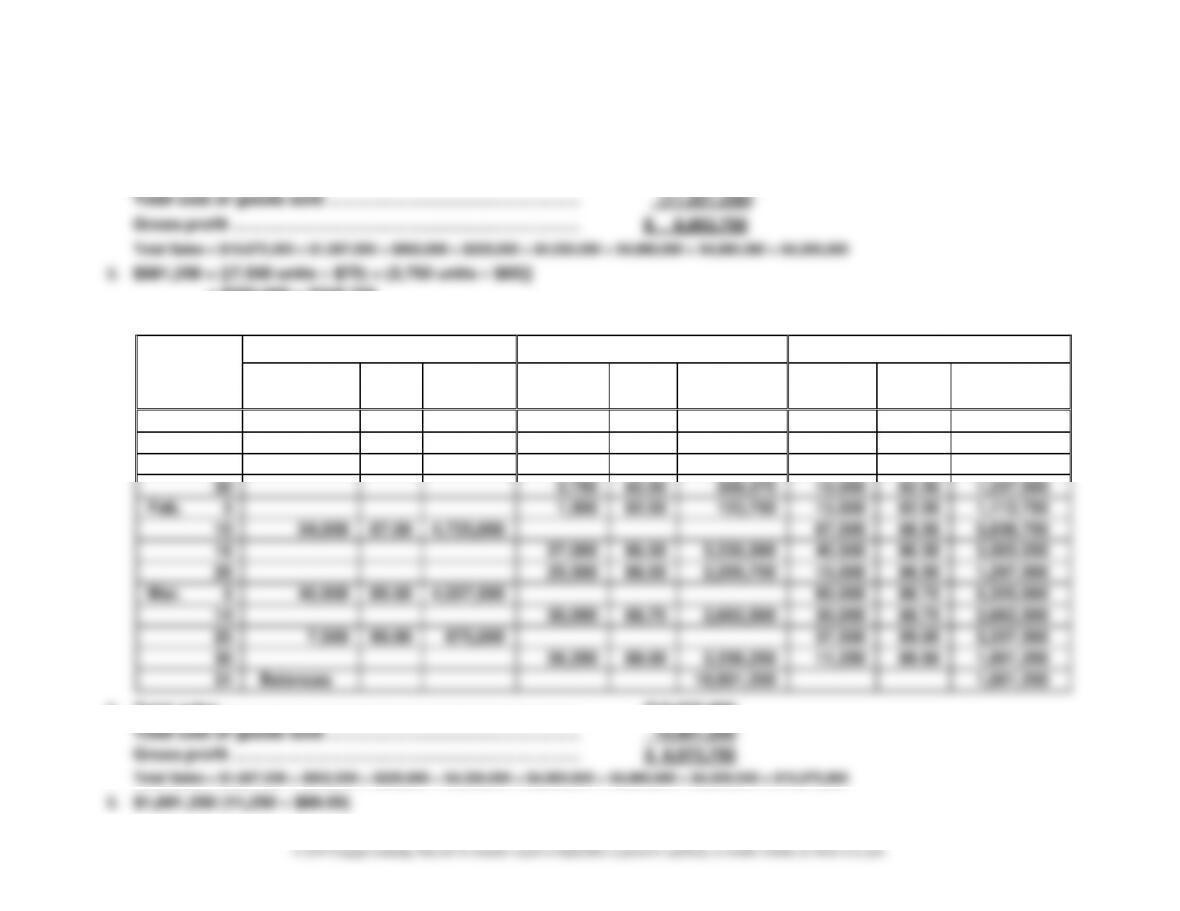
Prob. 6–3A
1.
Date
Purchases
Cost of Goods Sold
Inventory
Quantity
Unit
Cost
Total
Cost
Quantity
Unit
Cost
Total
Cost
Quantity
Unit
Cost
Total
Cost
Jan. 1
7,500
75.00
562,500
10
22,500
85.00
1,912,500
30,000
82.50
2,475,000
28
11,250
82.50
928,125
18,750
82.50
1,546,875
30
3,750
82.50
309,375
15,000
82.50
1,237,500
Feb. 5
1,500
82.50
123,750
13,500
82.50
1,113,750
10
54,000
87.50
4,725,000
67,500
86.50
5,838,750
16
27,000
86.50
2,335,500
40,500
86.50
3,503,250
28
25,500
86.50
2,205,750
15,000
86.50
1,297,500
Mar. 5
45,000
89.50
4,027,500
60,000
88.75
5,325,000
14
30,000
88.75
2,662,500
30,000
88.75
2,662,500
25
7,500
90.00
675,000
37,500
89.00
3,337,500
30
26,250
89.00
2,336,250
11,250
89.00
1,001,250
31
Balances
10,901,250
1,001,250
2. Total sales ………………………………………………………………….. $19,875,000
CHAPTER 6 Inventories
6–22
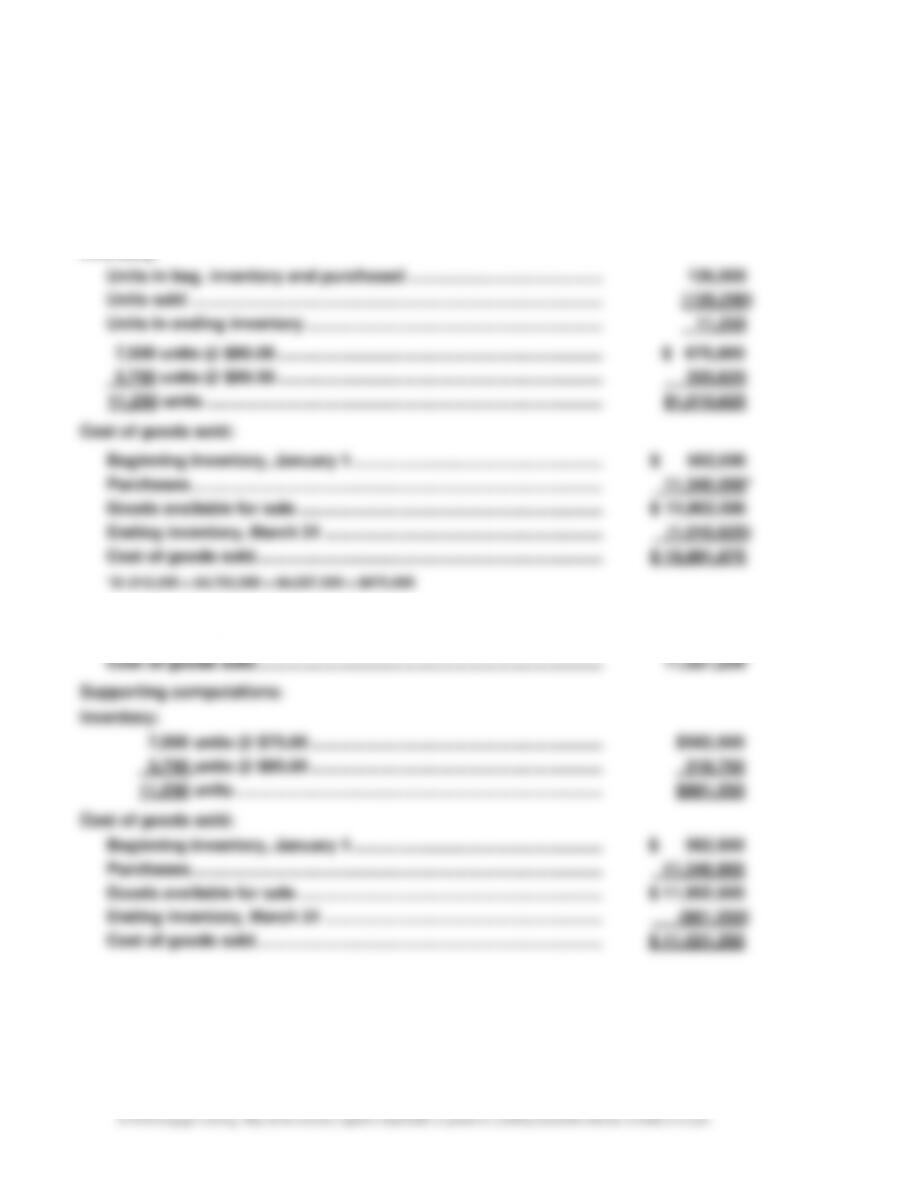
Prob. 6–4A
1. First-In, First-Out Method
Inventory, March 31 ………………………………………………………………. $ 1,010,625
Cost of goods sold………………………………………………………………… 10,891,875
Supporting computations:
Inventory:
2. Last-In, First-Out Method
Inventory, March 31 ………………………………………………………………. $ 881,250
CHAPTER 6 Inventories
6–23
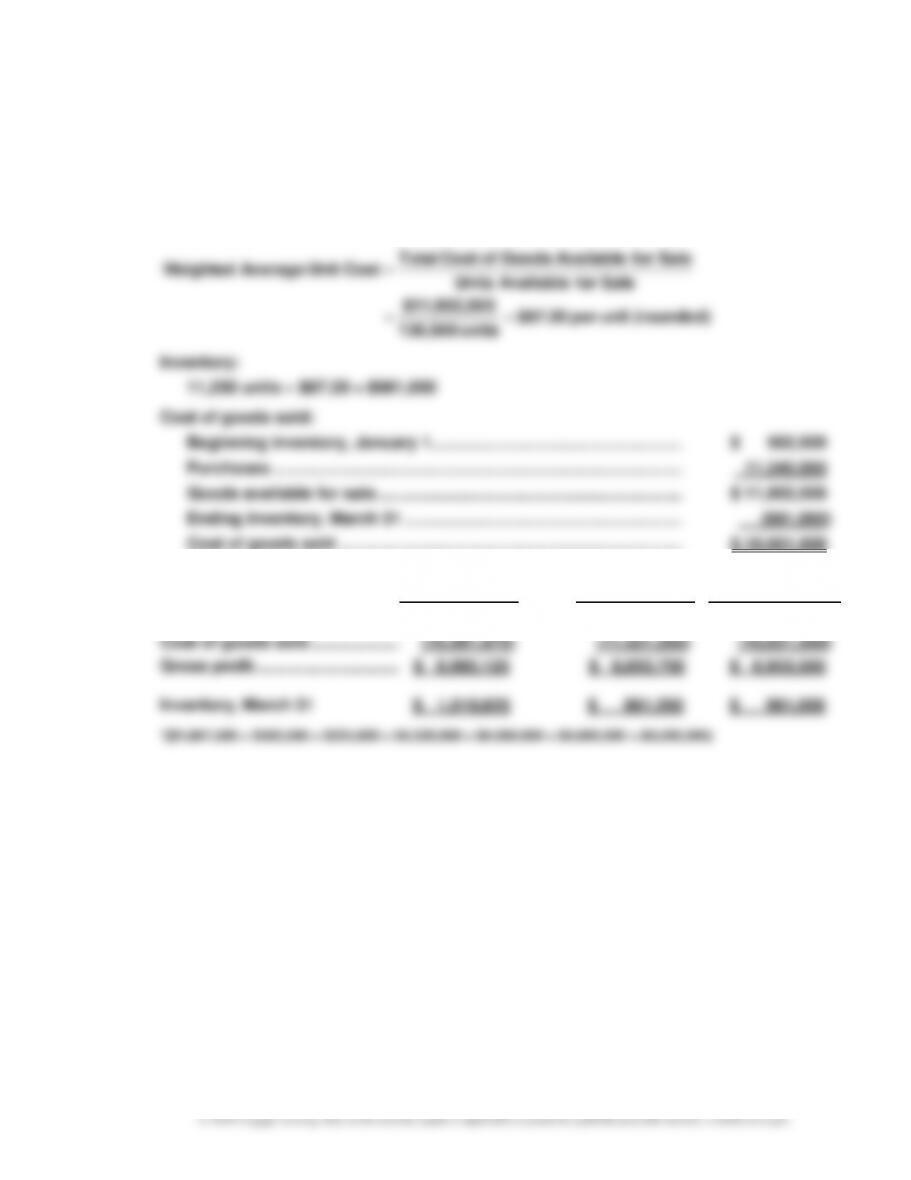
Prob. 6–4A (Concluded)
3. Weighted Average Cost Method
Inventory, March 31 ………………………………………………………………. $ 981,000
Cost of goods sold ……………………………………………………………….. 10,921,500
Supporting computations:
(rounded)unit per $87.20
units 136,500
0$11,902,50
Sale for AvailableUnits
Sale for AvailableGoods ofCost Total
Cost Unit AverageWeighted
==
=
Inventory:
11,250 units $87.20 = $981,000
Cost of goods sold:
Beginning inventory, January 1 ……………………………………………… $ 562,500
Purchases ……………………………………………………….…………………… 11,340,000
Goods available for sale ………………………………………………………… $ 11,902,500
Ending inventory, March 31 …………………………………………………… (981,000)
Cost of goods sold ……………………………………………………………….. $ 10,921,500
4. Weighted
FIFO LIFO Average
Sales ………………………………….. $ 19,875,000* $ 19,875,000 $ 19,875,000
CHAPTER 6 Inventories
6–24
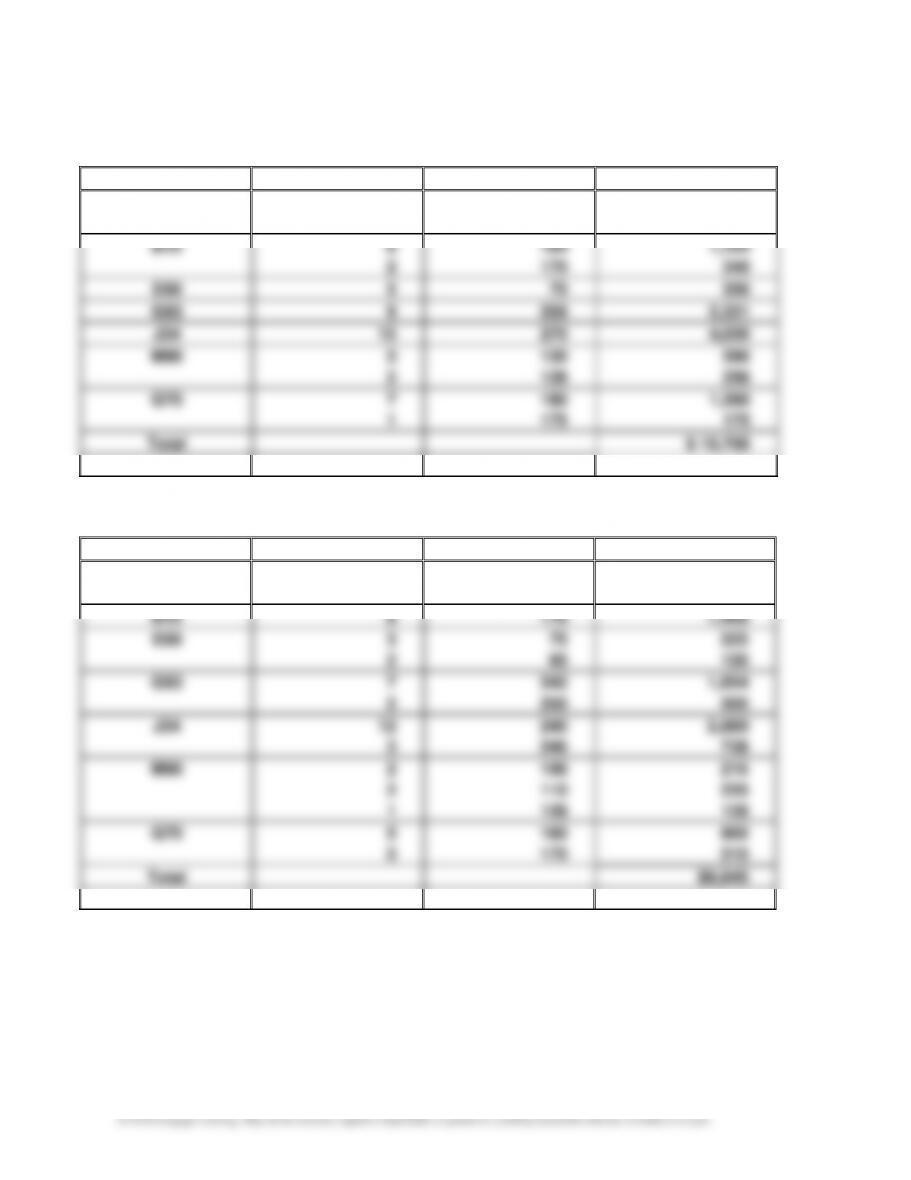
Prob. 6–5A
1. First-In, First-Out Method
Model
Quantity
Unit Cost
Total Cost
A10
4
$ 76
$ 304
2
70
140
B15
6
184
1,104
2
170
340
E60
5
70
350
G83
9
259
2,331
J34
15
270
4,050
M90
3
130
390
2
128
256
Q70
7
180
1,260
1
175
175
Total
$ 10,700
2. Last-In, First-Out Method
Model
Quantity
Unit Cost
Total Cost
A10
4
$ 64
$ 256
2
70
140
B15
8
176
1,408
E60
3
75
225
2
65
130
G83
7
242
1,694
2
250
500
J34
12
240
2,880
3
246
738
M90
2
108
216
2
110
220
1
128
128
Q70
5
160
800
3
170
510
Total
$9,845
CHAPTER 6 Inventories
6–25
Prob. 6–5A (Concluded)
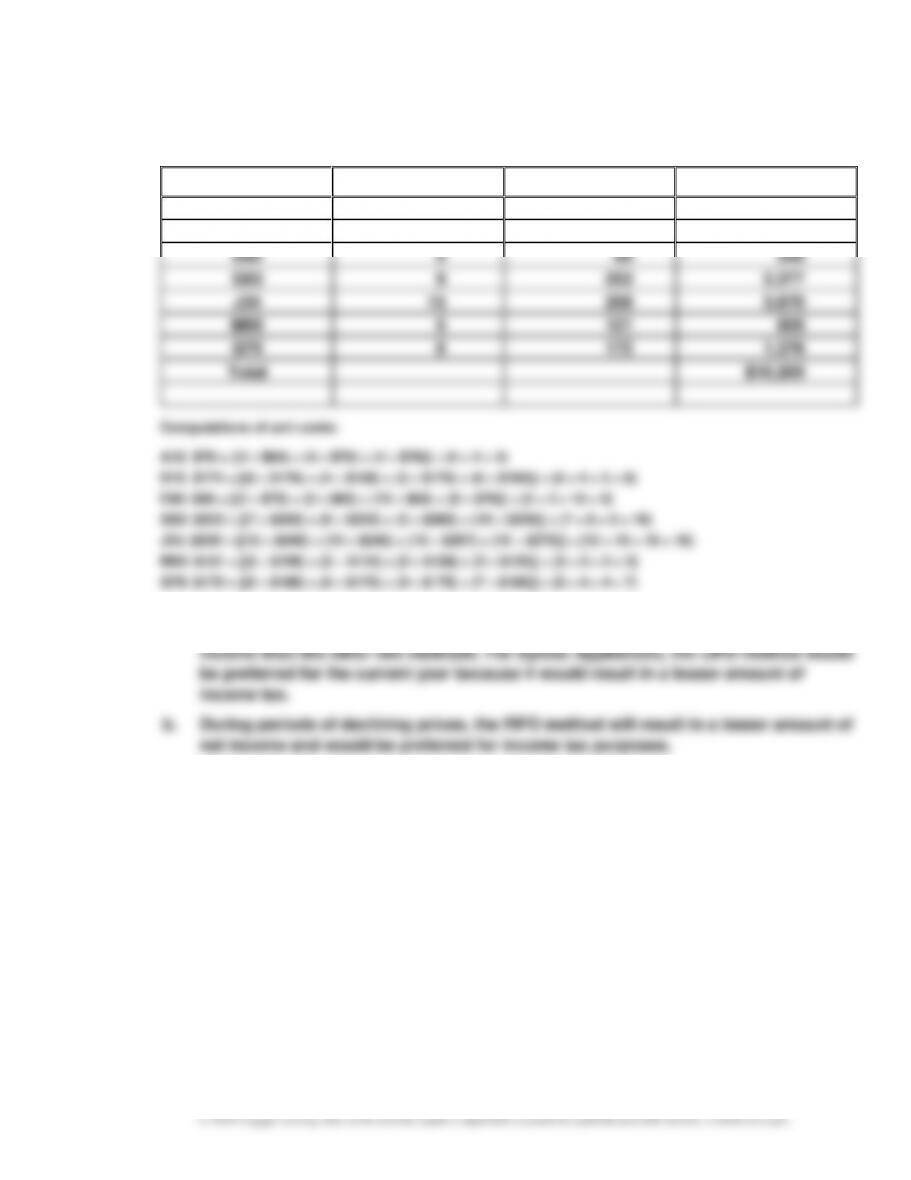
3. Weighted Average Cost Method
Model
Quantity
Unit Cost
Total Cost
A10
6
$ 70
$ 420
B15
8
174
1,392
E60
5
69
345
G83
9
253
2,277
J34
15
258
3,870
M90
5
121
605
Q70
8
172
1,376
Total
$10,285
Computations of unit costs:
A10: $70 = [(4 $64) + (4 $70) + (4 $76)] ÷ (4 + 4 + 4)
B15: $174 = [(8 $176) + (4 $158) + (3 $170) + (6 $184)] ÷ (8 + 4 + 3 + 6)
E60: $69 = [(3 $75) + (3 $65) + (15 $68) + (9 $70)] ÷ (3 + 3 + 15 + 9)
G83: $253 = [(7 $242) + (6 $250) + (5 $260) + (10 $259)] ÷ (7 + 6 + 5 + 10)
J34: $258 = [(12 $240) + (10 $246) + (16 $267) + (16 $270)] ÷ (12 + 10 + 16 + 16)
M90: $121 = [(2 $108) + (2 $110) + (3 $128) + (3 $130)] ÷ (2 + 2 + 3 + 3)
Q70: $172 = [(5 $160) + (4 $170) + (4 $175) + (7 $180)] ÷ (5 + 4 + 4 + 7)
4. a. During periods of rising prices, the LIFO method will result in a lower cost of
inventory, a greater amount of cost of goods sold, and a lesser amount of net
CHAPTER 6 Inventories
6–26
Prob. 6–6A
Inventory Sheet
December 31
Description
Inventory
Quantity
Cost
per
Unit
Market
Value per
Unit (Net
Realizable
Value)
Total
Cost
Market
LCM
B12
38
30
$ 60
$ 57
$ 1,800
$ 1,710
8
59
57
472
456
2,272
2,166
$ 2,166
E41
18
178
180
3,204
3,240
3,204
G19
33
20
128
126
2,560
2,520
13
129
126
1,677
1,638
4,237
4,158
4,158
L88
18
10
563
550
5,630
5,500
8
560
550
4,480
4,400
10,110
9,900
9,900
N94
400
8
7
3,200
2,800
2,800
P24
90
80
22
18
1,760
1,440
10
21
18
210
180
1,970
1,620
1,620
R66
8
5
248
250
1,240
1,250
3
260
250
780
750
2,020
2,000
2,000
T33
140
100
21
20
2,100
2,000
40
19
20
760
800
2,860
2,800
2,800
Z16
15
10
750
752
7,500
7,520
5
745
752
3,725
3,760
11,225
11,280
11,225
Total
$41,098
$39,964
$39,873
CHAPTER 6 Inventories
6–27
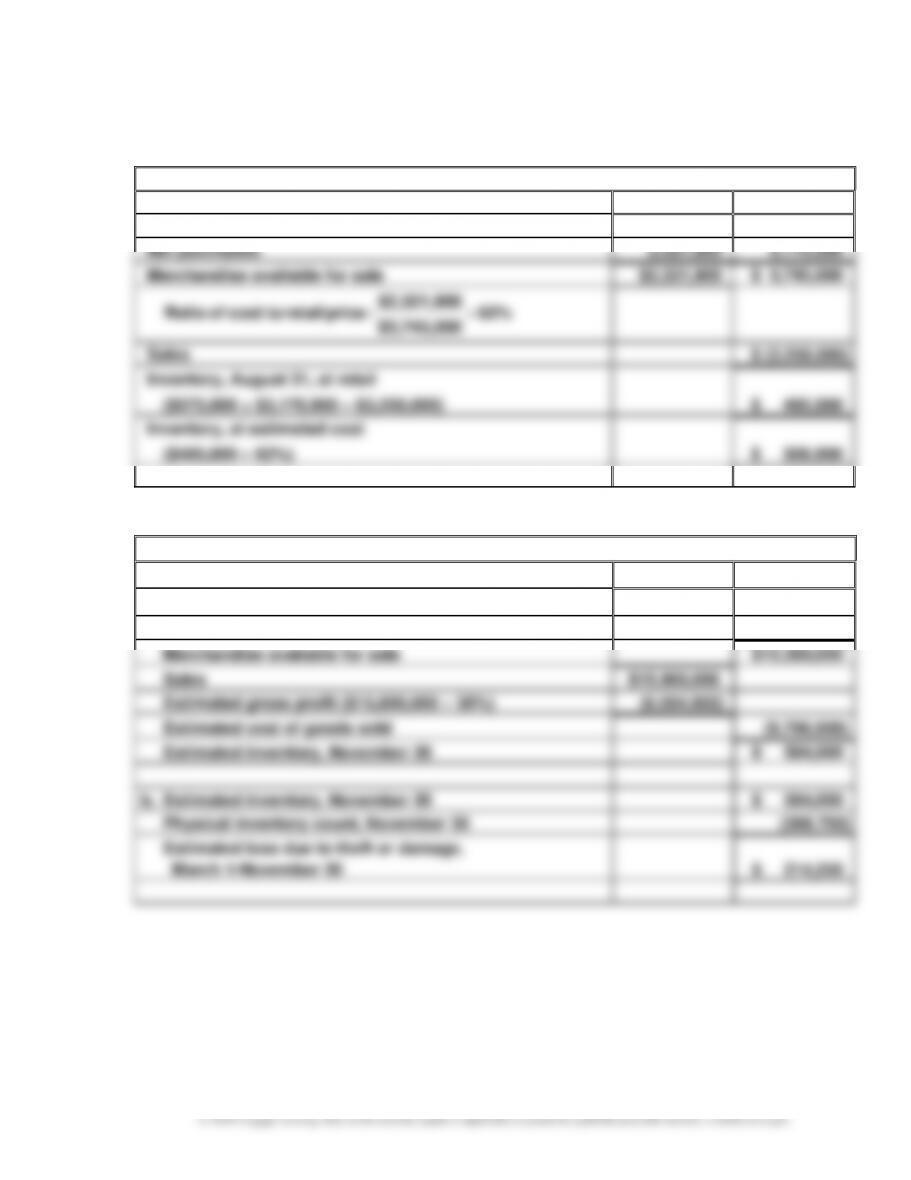
Appendix Prob. 6–7A
1.
Celebrity Tan Co.
Cost
Retail
Inventory, August 1
$ 300,000
$ 575,000
Net purchases
2,021,900
3,170,000
Merchandise available for sale
$2,321,900
$ 3,745,000
62%
$3,745,000
$2,321,900
:price retail tocost of Ratio =
Sales
$ (3,250,000)
Inventory, August 31, at retail
($575,000 + $3,170,000 – $3,250,000)
$ 495,000
Inventory, at estimated cost
($495,000 62%)
$ 306,900
2.
Ranchworks Co.
Cost
a. Inventory, March 1
$ 880,000
Net purchases
9,500,000
Merchandise available for sale
$10,380,000
Sales
$15,800,000
Estimated gross profit ($15,800,000 38%)
(6,004,000)
Estimated cost of goods sold
(9,796,000)
Estimated inventory, November 30
$ 584,000
b. Estimated inventory, November 30
$ 584,000
Physical inventory count, November 30
(369,750)
Estimated loss due to theft or damage,
March 1-November 30
$ 214,250
CHAPTER 6 Inventories
6–28
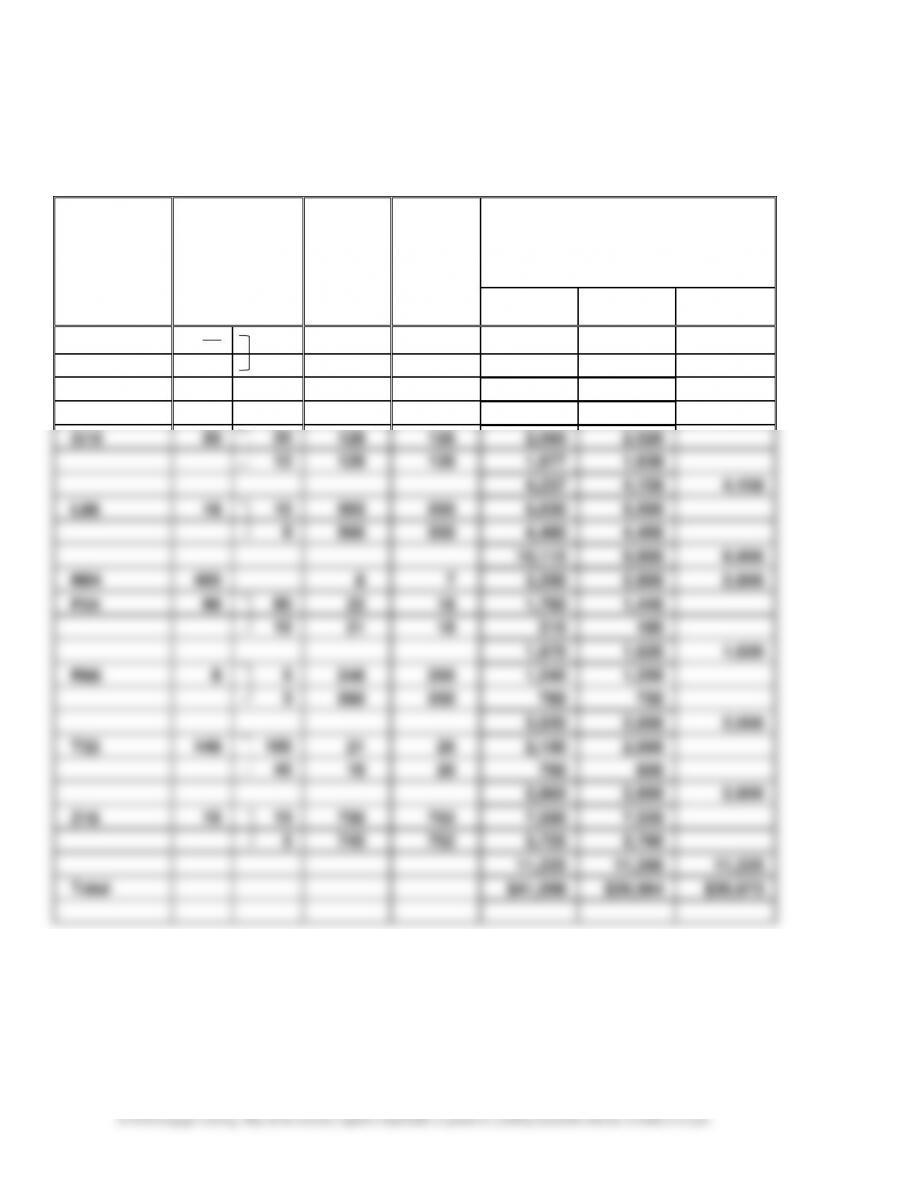
Prob. 6–1B
1.
Purchases
Cost of Goods Sold
Inventory
Unit
Total
Unit
Total
Unit
Total
Date
Quantity
Cost
Cost
Quantity
Cost
Cost
Quantity
Cost
Cost
Apr. 3
25
1,200
30,000
8
75
1,240
93,000
25
1,200
30,000
75
1,240
93,000
11
25
1,200
30,000
15
1,240
18,600
60
1,240
74,400
30
30
1,240
37,200
30
1,240
37,200
May 8
60
1,260
75,600
30
1,240
37,200
60
1,260
75,600
10
30
1,240
37,200
20
1,260
25,200
40
1,260
50,400
19
20
1,260
25,200
20
1,260
25,200
28
80
1,260
100,800
20
1,260
25,200
80
1,260
100,800
June 5
20
1,260
25,200
20
1,260
25,200
60
1,260
75,600
16
25
1,260
31,500
35
1,260
44,100
21
35
1,264
44,240
35
1,260
44,100
35
1,264
44,240
28
35
1,260
44,100
9
1,264
11,376
26
1,264
32,864
30
Balances
310,776
32,864
CHAPTER 6 Inventories
6–29
Prob. 6–1B (Concluded)
2.
Accounts Receivable
525,250
Sales
525,250
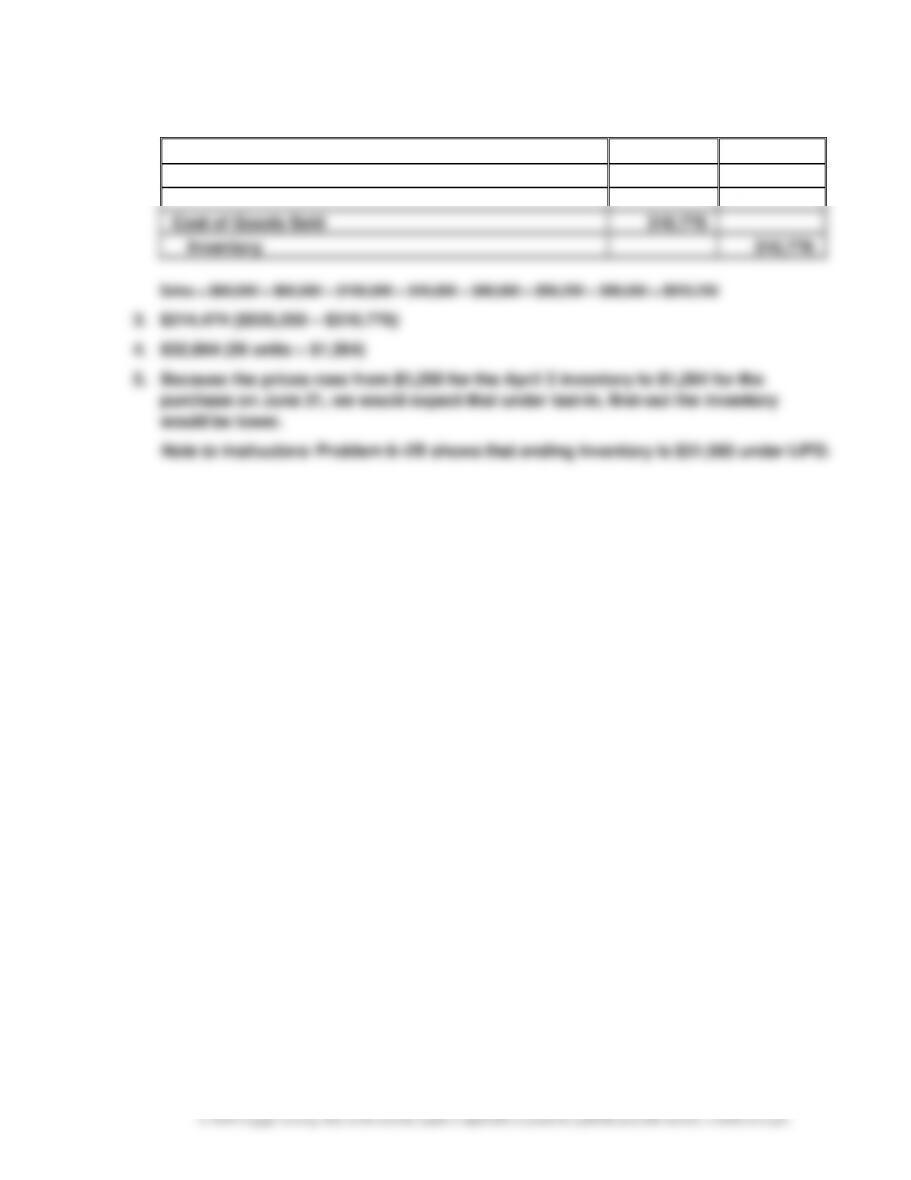
Cost of Goods Sold
310,776
Inventory
310,776
CHAPTER 6 Inventories
6–30
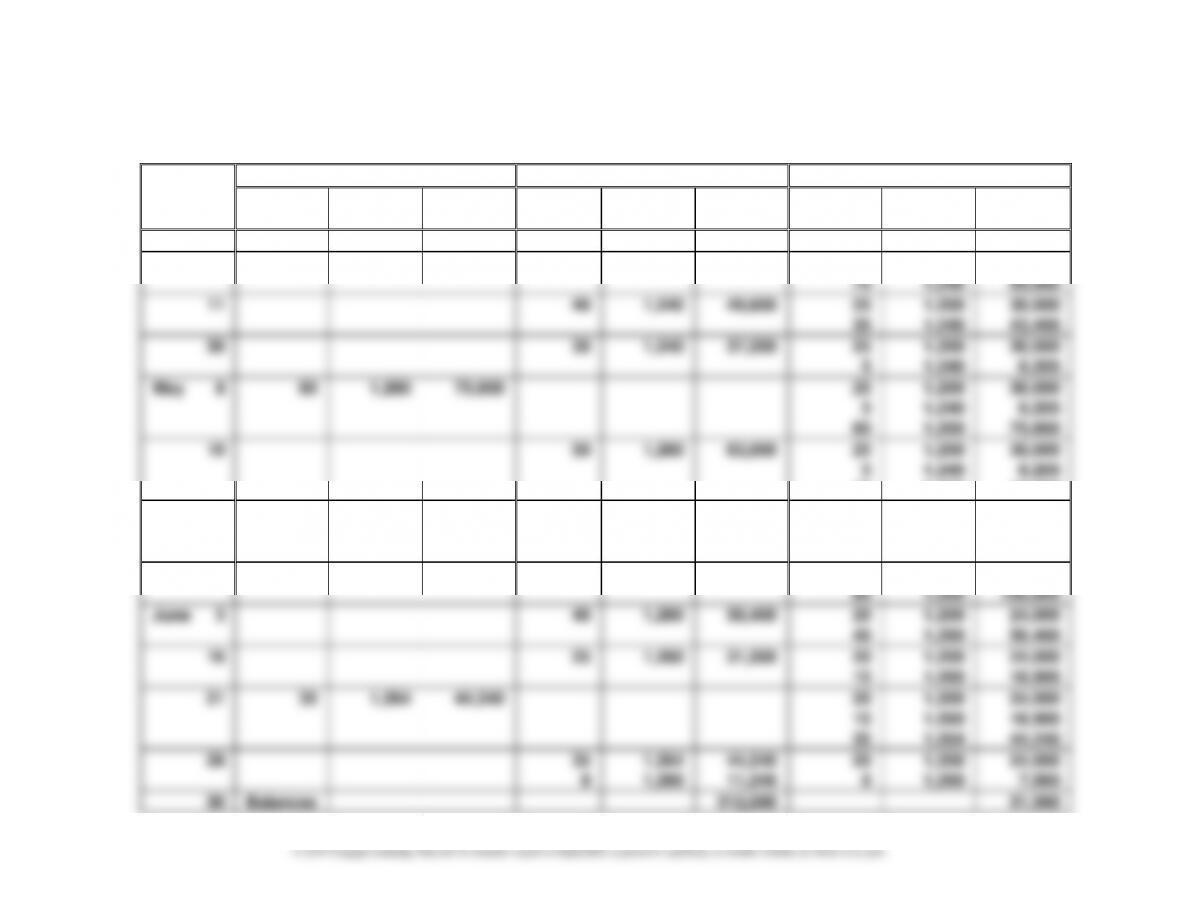
Prob. 6–2B
1.
Purchases
Cost of Goods Sold
Inventory
Unit
Total
Unit
Total
Unit
Total
Date
Quantity
Cost
Cost
Quantity
Cost
Cost
Quantity
Cost
Cost
Apr. 3
25
1,200
30,000
8
75
1,240
93,000
25
1,200
30,000
75
1,240
93,000
11
40
1,240
49,600
25
1,200
30,000
35
1,240
43,400
30
30
1,240
37,200
25
1,200
30,000
5
1,240
6,200
May 8
60
1,260
75,600
25
1,200
30,000
5
1,240
6,200
60
1,260
75,600
10
50
1,260
63,000
25
1,200
30,000
5
1,240
6,200
10
1,260
12,600
19
10
1,260
12,600
5
1,240
6,200
5
1,200
6,000
20
1,200
24,000
28
80
1,260
100,800
20
1,200
24,000
80
1,260
100,800
June 5
40
1,260
50,400
20
1,200
24,000
40
1,260
50,400
16
25
1,260
31,500
20
1,200
24,000
15
1,260
18,900
21
35
1,264
44,240
20
1,200
24,000
15
1,260
18,900
35
1,264
44,240
28
35
1,264
44,240
20
1,200
24,000
9
1,260
11,340
6
1,260
7,560
30
Balances
312,080
31,560
CHAPTER 6 Inventories
6–31
Prob. 6–2B (Concluded)
2. Total sales ………………………………………………………………………… $ 525,250
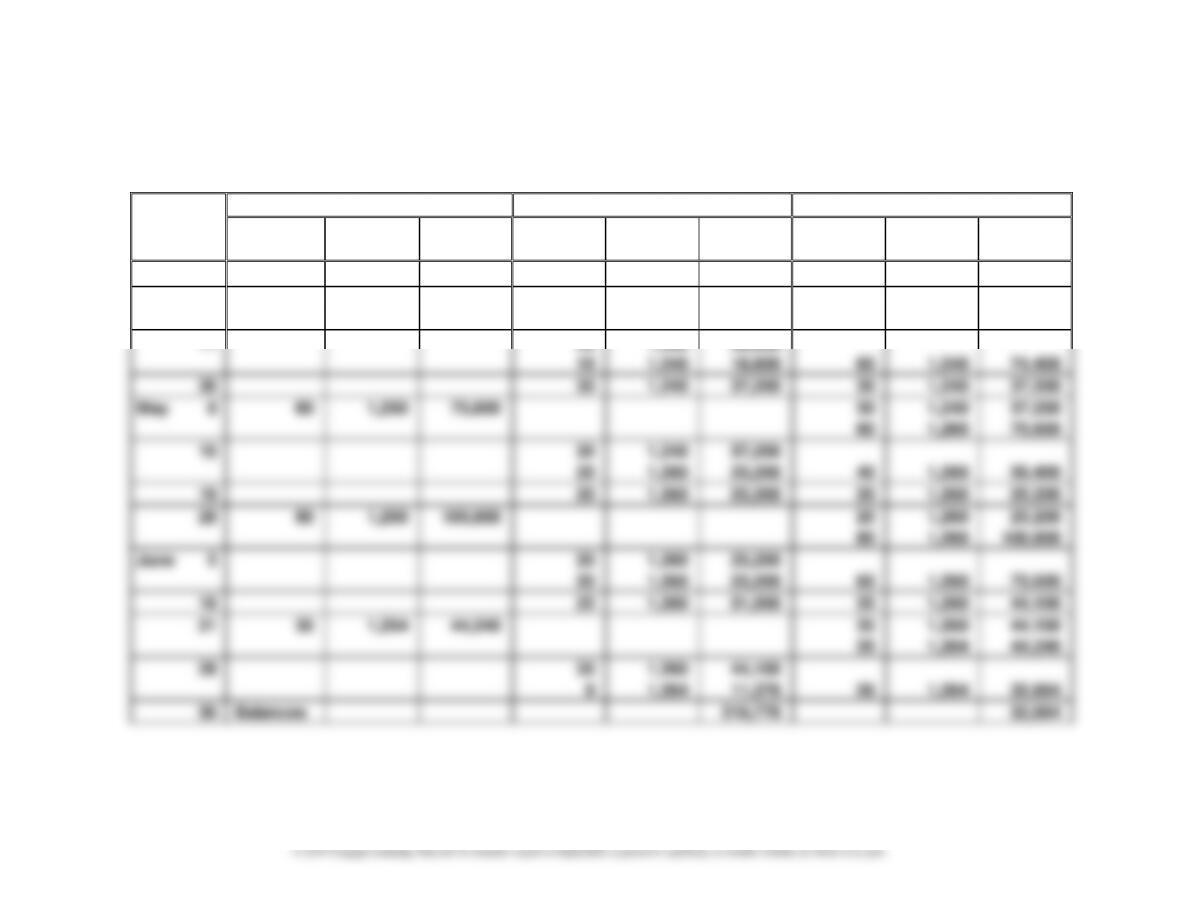
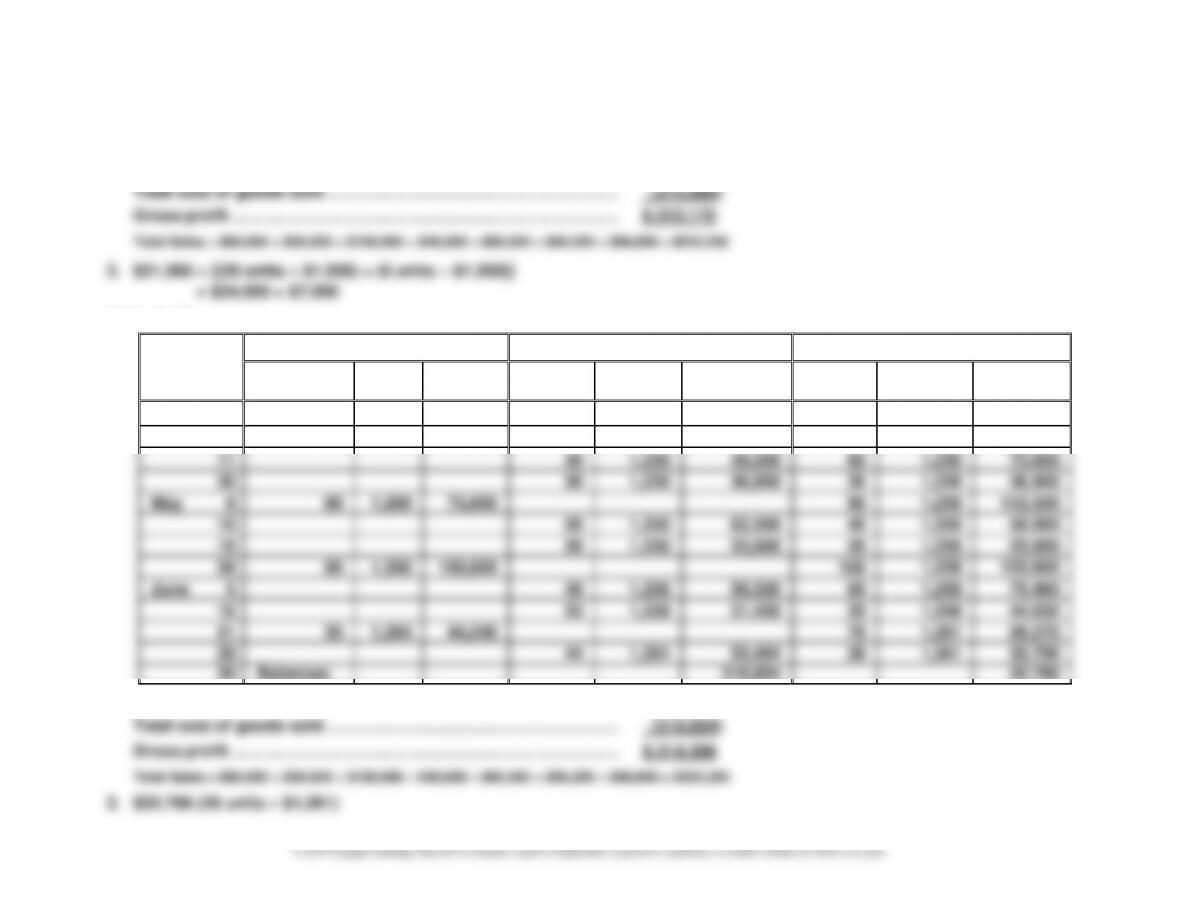
Prob. 6–3B
1.
Date
Purchases
Cost of Goods Sold
Inventory
Quantity
Unit
Cost
Total
Cost
Quantity
Unit Cost
Total
Cost
Quantity
Unit Cost
Total
Cost
Apr. 3
25
1,200
30,000
8
75
1,240
93,000
100
1,230
123,000
11
40
1,230
49,200
60
1,230
73,800
30
30
1,230
36,900
30
1,230
36,900
May 8
60
1,260
75,600
90
1,250
112,500
10
50
1,250
62,500
40
1,250
50,000
19
20
1,250
25,000
20
1,250
25,000
28
80
1,260
100,800
100
1,258
125,800
June 5
40
1,258
50,320
60
1,258
75,480
16
25
1,258
31,450
35
1,258
44,030
21
35
1,264
44,240
70
1,261
88,270
28
44
1,261
55,484
26
1,261
32,786
30
Balances
310,854
32,786
2. Total sales ………………………………………………………………………… $ 525,250
CHAPTER 6 Inventories
6–32
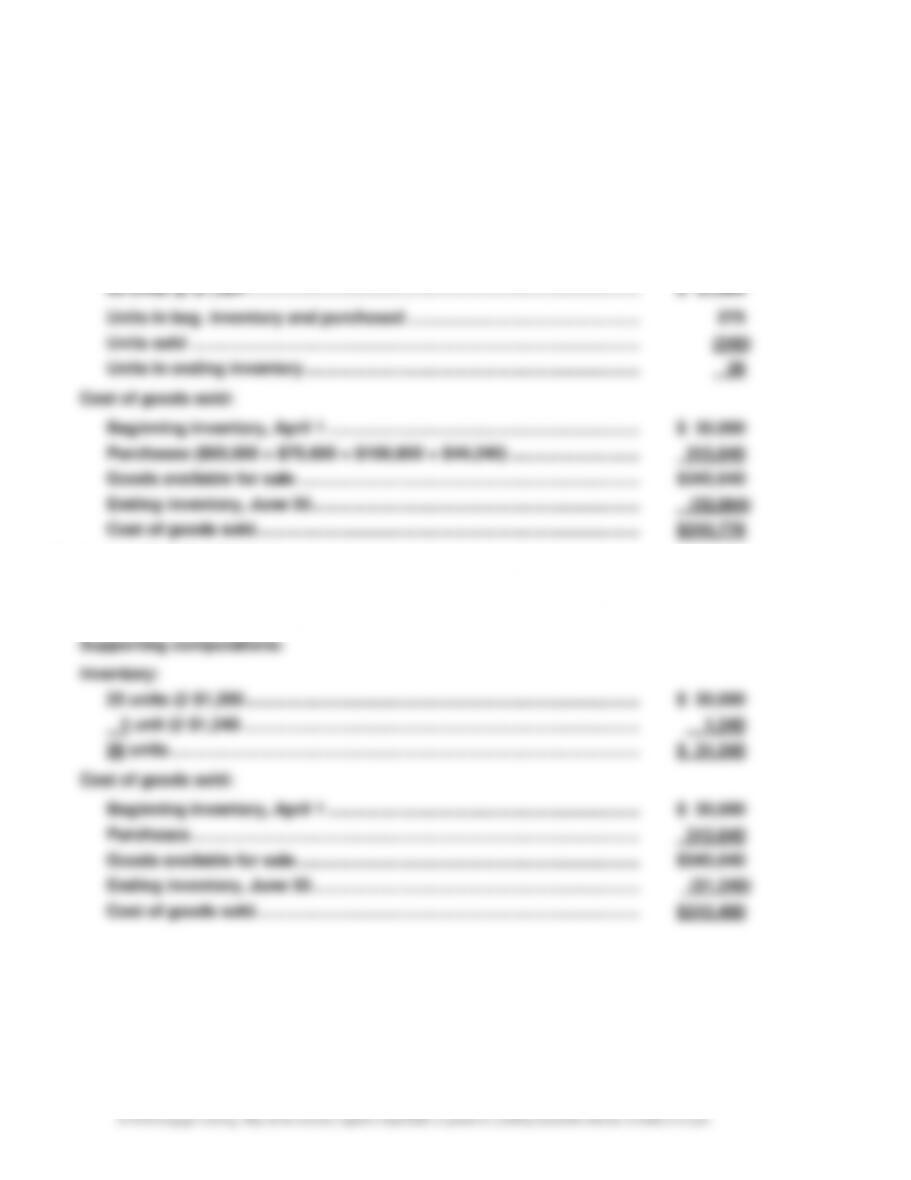
Prob. 6–4B
1. First-In, First-Out Method
Inventory, June 30 ……………………………………………………………………….. $ 32,864
Cost of goods sold……………………………………………………………………….. 310,776
Supporting computations:
Inventory:
2. Last-In, First-Out Method
Inventory, June 30 ……………………………………………………………………….. $ 31,240
Cost of goods sold……………………………………………………………………….. 312,400
CHAPTER 6 Inventories
6–33
Prob. 6–4B (Concluded)
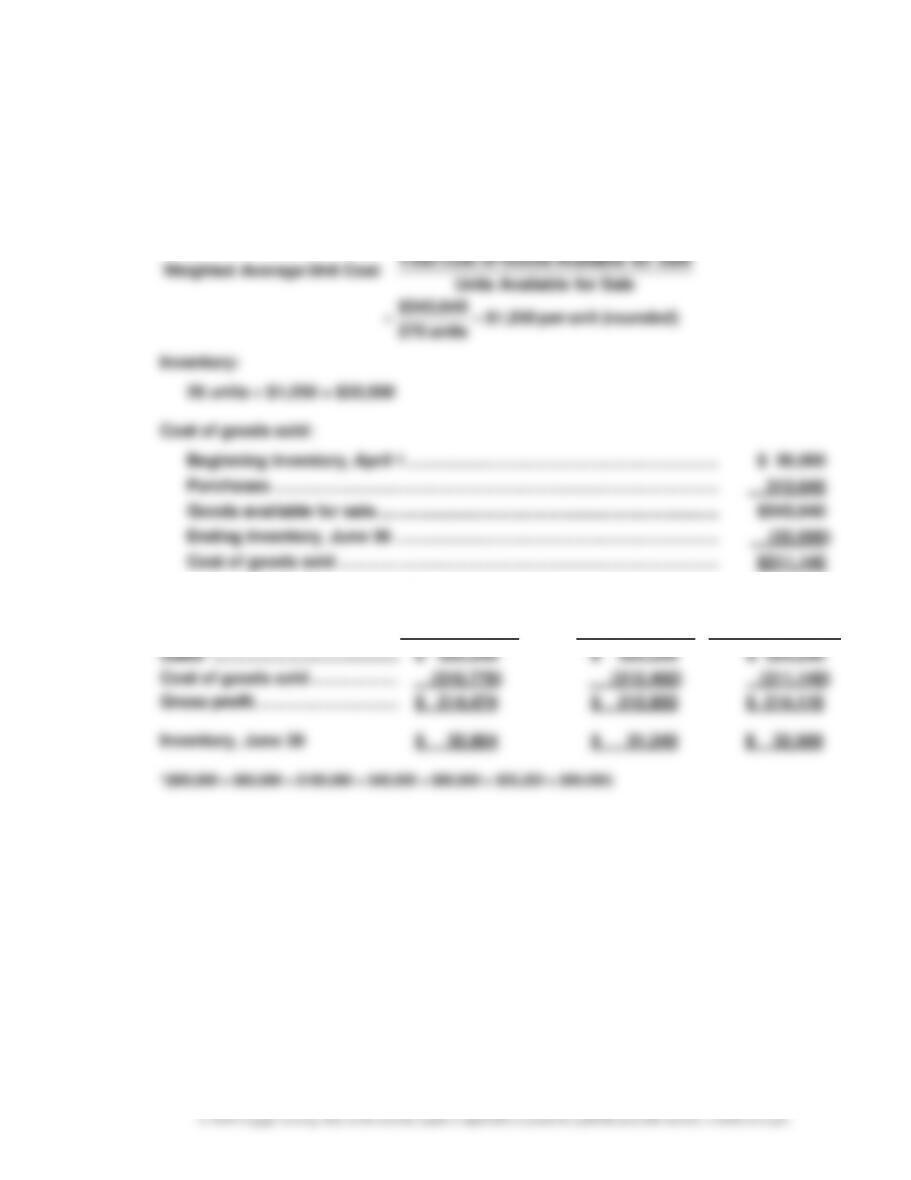
3. Weighted Average Cost Method
Inventory, June 30 ……………………………………………………………………….. $32,500
Cost of goods sold ………………………………………………………………………. 311,140
Supporting computations:
(rounded)unit per $1,250
units 275
$343,640
Sale for AvailableUnits
Sale for AvailableGoods ofCost Total
Cost Unit AverageWeighted
==
=
Inventory:
26 units $1,250 = $32,500
Cost of goods sold:
Beginning inventory, April 1 …………………………………………………………. $ 30,000
Purchases ……………………………………………………….………………………….. 313,640
Goods available for sale ……………………………………………………………….. $343,640
Ending inventory, June 30 ……………………………………………………………. (32,500)
Cost of goods sold ………………………………………………………………………. $311,140
4. Weighted
FIFO LIFO Average