6–1
CHAPTER 6
INVENTORIES
DISCUSSION QUESTIONS
1. The receiving report should be reconciled to the initial purchase order and the vendor’s invoice before
2. A physical inventory should be taken periodically to test the accuracy of the perpetual records. In
addition, a physical inventory will identify inventory shortages or shrinkage.
6. LIFO. In periods of rising prices, the use of LIFO will result in the lowest net income and thus the
lowest income tax expense.
8. a. Gross profit for the year was understated by $14,750.
CHAPTER 6 Inventories
BASIC EXERCISES
BE 6–1
Gross Profit
April
Ending Inventory
April 30
a.
First-in, first-out (FIFO)
$200 ($300 – $100)
$260 ($120 + $140)
b.
Last-in, first-out (LIFO)
$160 ($300 – $140)
$220 ($100 + $120)
c.
Weighted average cost
$180 ($300 – $120)
$240 ($120 2)
BE 6–2
a. Cost of goods sold (October 24):
40
units @ $30
$1,200
110
units @ $33
3,630
150
$4,830
b. Inventory, October 31: $2,310 = 70 units $33
BE 6–3
a. Cost of goods sold (July 27):
6–3
BE 6–5
a. First-in, first-out (FIFO) method: $14,700 = (60 units $200) + (15 units $180)
BE 6–6
Commodity
Inventory
Quantity
Cost
per
Unit
Market
Value per
Unit (Net
Realizable
Value)
Total
Cost
Market
LCM
JFW1
6,330
$10
$11
$ 63,300
$ 69,630
$ 63,300
SAW9
1,140
36
34
41,040
38,760
38,760
Total
$104,340
$108,390
$102,060
BE 6–7
Amount of Misstatement
Overstatement (Understatement)
Balance Sheet:
CHAPTER 6 Inventories
6–4
BE 6–8
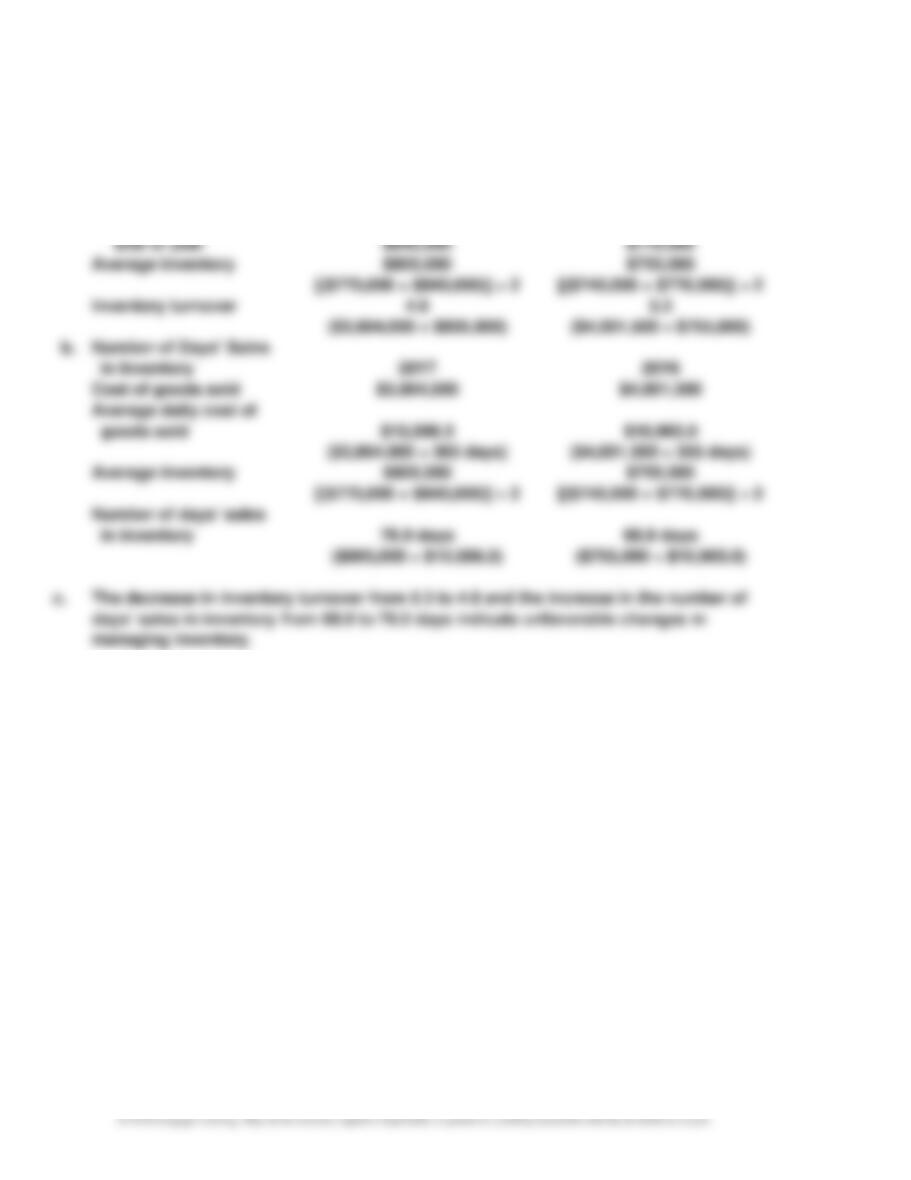
a.
Inventory Turnover
20Y7
20Y6
Cost of goods sold
$3,864,000
$4,001,500
Inventories:
Beginning of year
$770,000
$740,000
End of year
$840,000
$770,000
Average inventory
$805,000
$755,000
[($770,000 + $840,000)] ÷ 2
[($740,000 + $770,000)] ÷ 2
Inventory turnover
4.8
5.3
($3,864,000 ÷ $805,000)
($4,001,500 ÷ $755,000)
b.
Number of Days’ Sales
in Inventory
20Y7
20Y6
Cost of goods sold
$3,864,000
$4,001,500
Average daily cost of
goods sold
$10,586.3
$10,963.0
($3,864,000 ÷ 365 days)
($4,001,500 ÷ 365 days)
Average inventory
$805,000
$755,000
[($770,000 + $840,000)] ÷ 2
[($740,000 + $770,000)] ÷ 2
Number of days’ sales
in inventory
76.0 days
68.9 days
($805,000 ÷ $10,586.3)
($755,000 ÷ $10,963.0)
c. The decrease in inventory turnover from 5.3 to 4.8 and the increase in the number of
days’ sales in inventory from 68.9 to 76.0 days indicate unfavorable changes in
managing inventory.
CHAPTER 6 Inventories
6–5
EXERCISES
Ex. 6–1
Switching to a perpetual inventory system will strengthen Triple Creek Hardware’s internal
Ex. 6–2
a. Appropriate. The inventory tags will protect the inventory from customer theft.
CHAPTER 6 Inventories
6–6
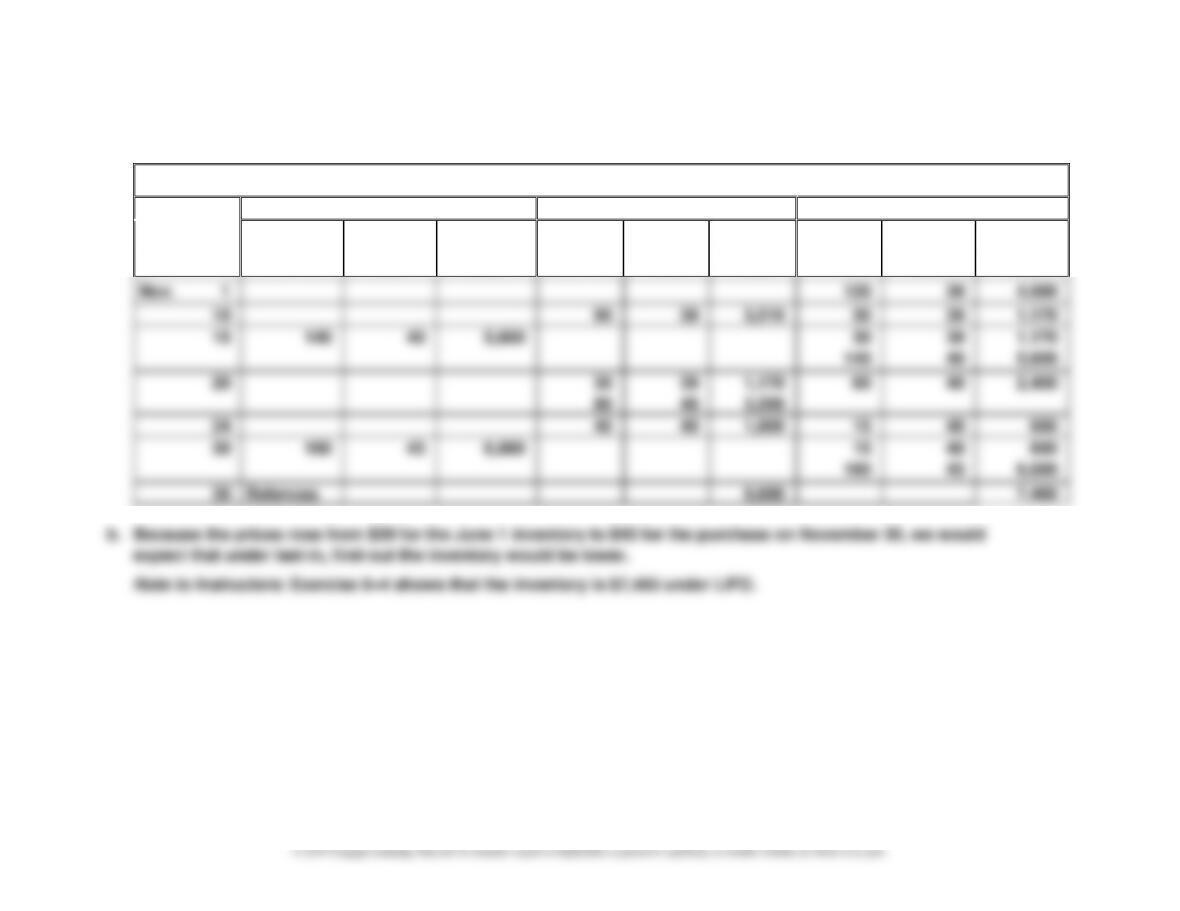
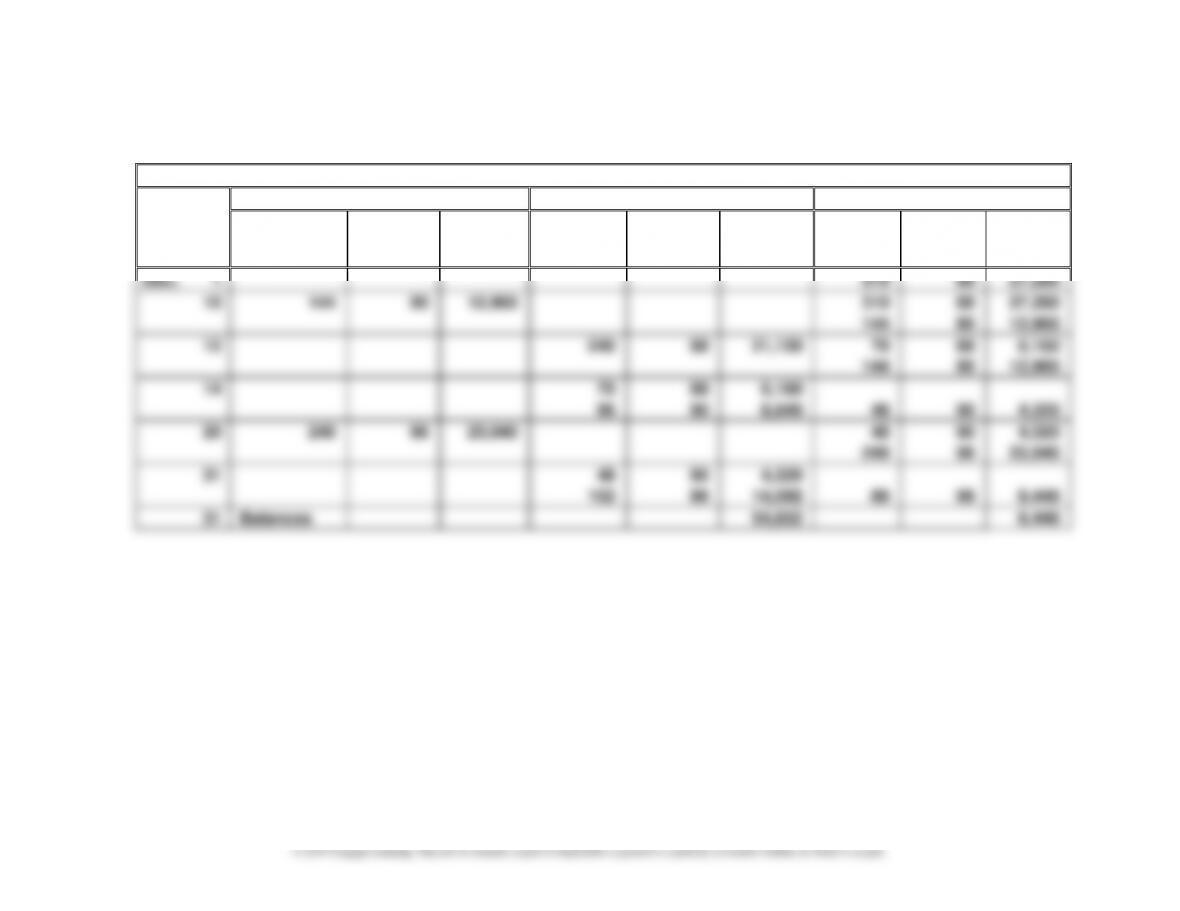
Ex. 6–3
a.
DVD Players
Purchases
Cost of Goods Sold
Inventory
Date
Quantity
Unit
Cost
Total
Cost
Quantity
Unit
Cost
Total
Cost
Quantity
Unit
Cost
Total
Cost
Nov. 1
120
39
4,680
10
90
39
3,510
30
39
1,170
15
140
40
5,600
30
140
39
40
1,170
5,600
20
30
39
1,170
60
40
2,400
80
40
3,200
24
45
40
1,800
15
40
600
30
160
43
6,880
15
160
40
43
600
6,880
30
Balances
9,680
7,480
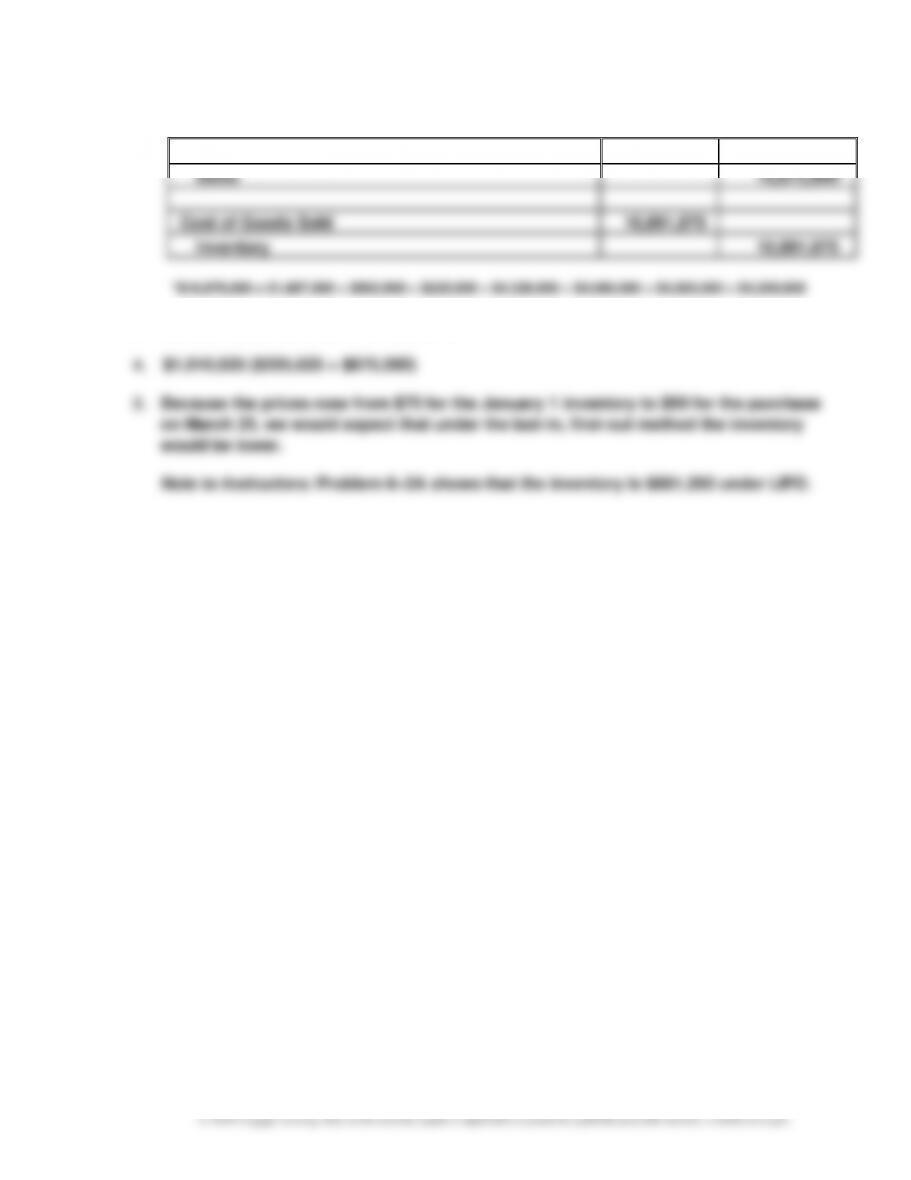
b. Because the prices rose from $39 for the June 1 inventory to $43 for the purchase on November 30, we would
expect that under last-in, first-out the inventory would be lower.
Note to Instructors: Exercise 6–4 shows that the inventory is $7,465 under LIFO.
CHAPTER 6 Inventories
6–7
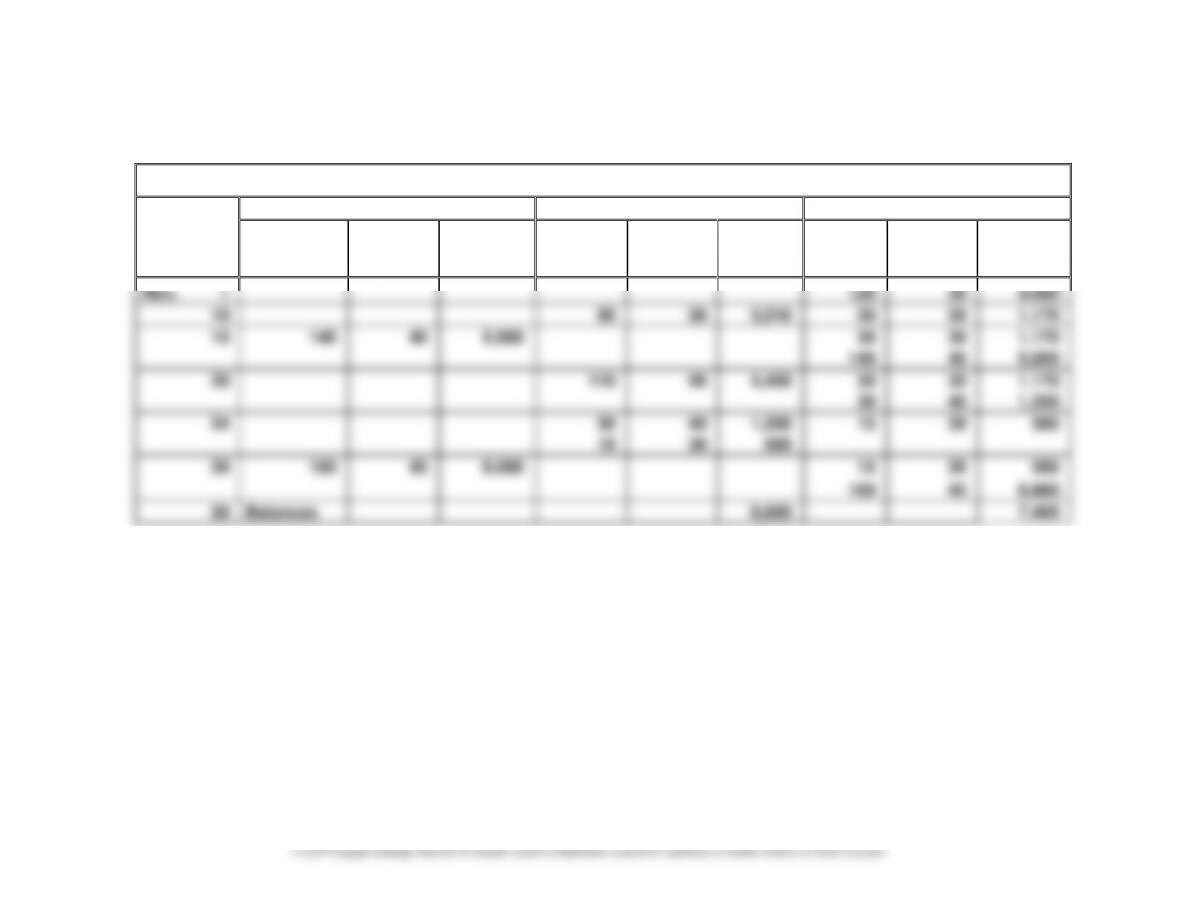
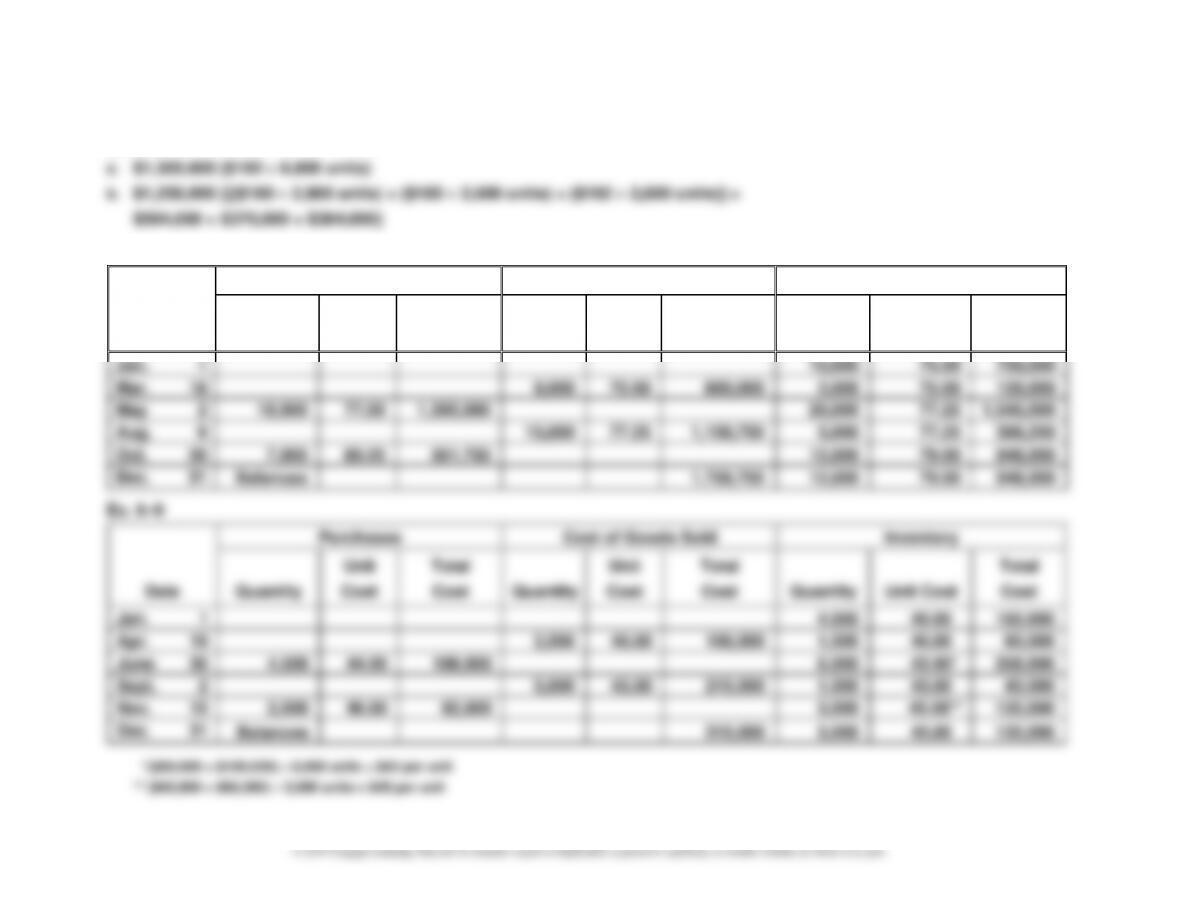
Ex. 6–4
DVD Players
Purchases
Cost of Goods Sold
Inventory
Date
Quantity
Unit
Cost
Total
Cost
Quantity
Unit
Cost
Total
Cost
Quantity
Unit
Cost
Total
Cost
Nov. 1
120
39
4,680
10
90
39
3,510
30
39
1,170
15
140
40
5,600
30
39
1,170
140
40
5,600
20
110
40
4,400
30
39
1,170
30
40
1,200
24
30
40
1,200
15
39
585
15
39
585
30
160
43
6,880
15
39
585
160
43
6,880
30
Balances
9,695
7,465
CHAPTER 6 Inventories
6–8
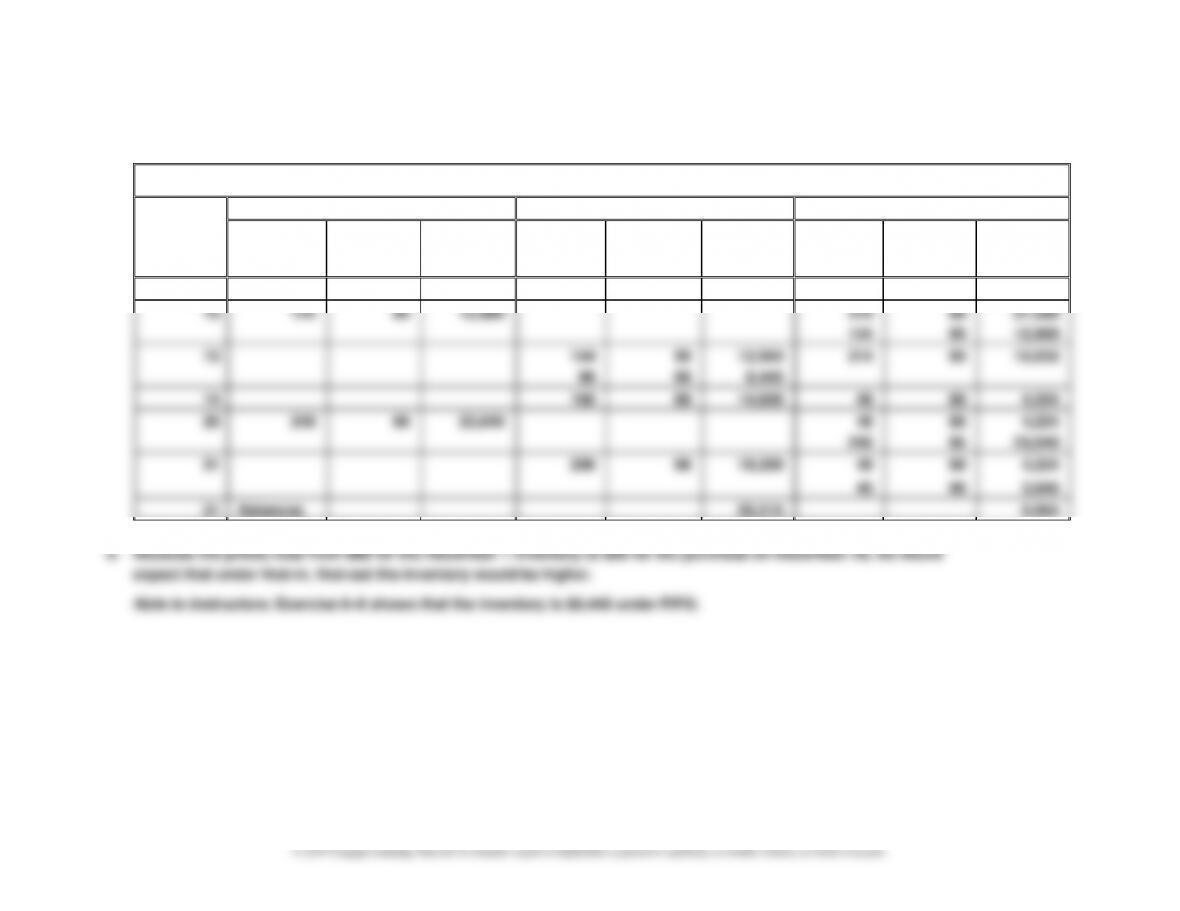
Ex. 6–5
a.
Prepaid Cell Phones
Purchases
Cost of Goods Sold
Inventory
Date
Quantity
Unit
Cost
Total
Cost
Quantity
Unit
Cost
Total
Cost
Quantity
Unit
Cost
Total
Cost
Dec. 1
310
88
27,280
10
144
90
12,960
310
88
27,280
144
90
12,960
12
144
90
12,960
214
88
18,832
96
88
8,448
14
166
88
14,608
48
88
4,224
20
240
96
23,040
48
88
4,224
240
96
23,040
31
200
96
19,200
48
88
4,224
40
96
3,840
31
Balances
55,216
8,064
CHAPTER 6 Inventories
6–9
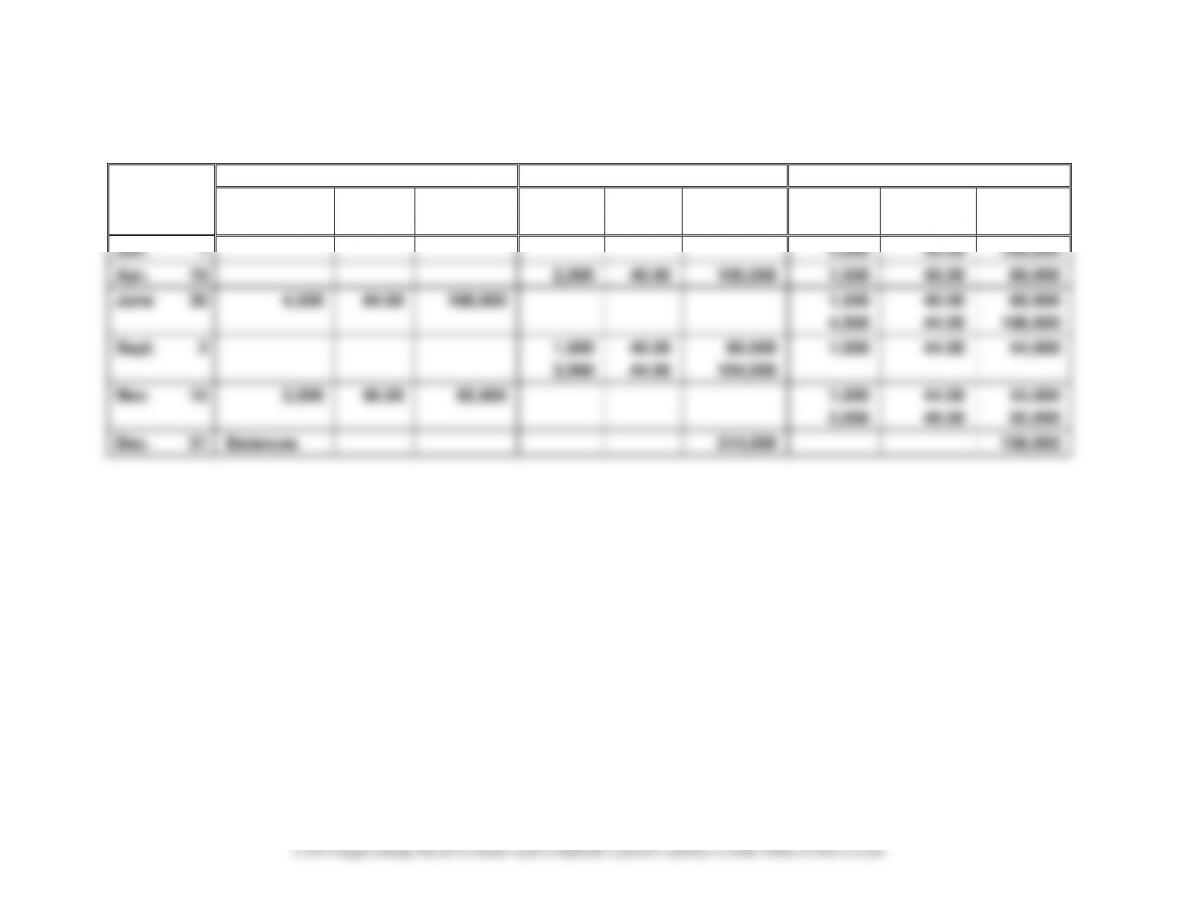
Ex. 6–6
Prepaid Cell Phones
Purchases
Cost of Goods Sold
Inventory
Date
Quantity
Unit
Cost
Total
Cost
Quantity
Unit
Cost
Total
Cost
Quantity
Unit
Cost
Total
Cost
Dec. 1
310
88
27,280
10
144
90
12,960
310
88
27,280
144
90
12,960
12
240
88
21,120
70
88
6,160
144
90
12,960
14
70
88
6,160
96
90
8,640
48
90
4,320
20
240
96
23,040
48
90
4,320
240
96
23,040
31
48
90
4,320
152
96
14,592
88
96
8,448
31
Balances
54,832
8,448
CHAPTER 6 Inventories
6–10
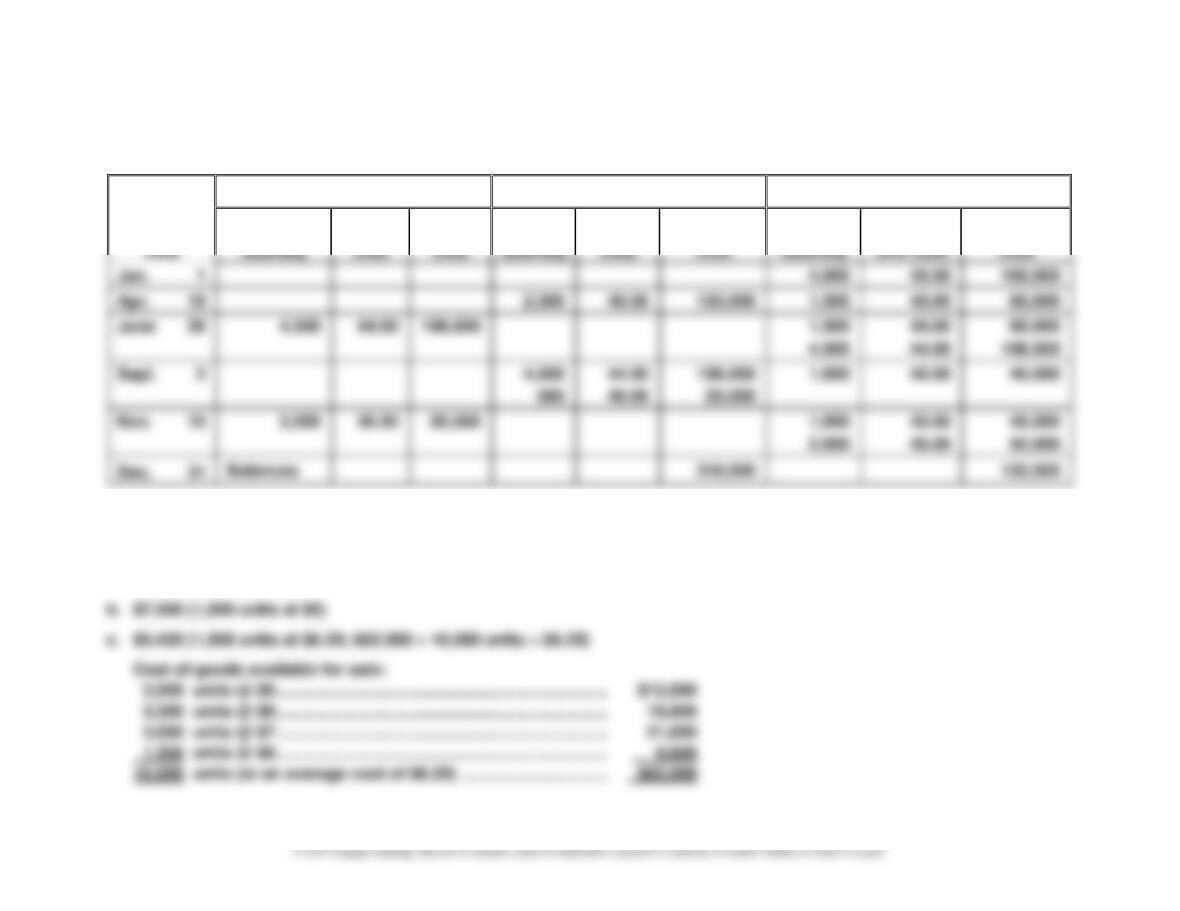
Ex. 6–7
Ex. 6–8
Purchases
Cost of Goods Sold
Inventory
Date
Quantity
Unit
Cost
Total
Cost
Quantity
Unit
Cost
Total
Cost
Quantity
Unit Cost
Total
Cost
Jan. 1
10,000
75.00
750,000
Mar. 18
8,000
75.00
600,000
2,000
75.00
150,000
May 2
18,000
77.50
1,395,000
20,000
77.25
1,545,000
Aug. 9
15,000
77.25
1,158,750
5,000
77.25
386,250
Oct. 20
7,000
80.25
561,750
12,000
79.00
948,000
Dec. 31
Balances
1,758,750
12,000
79.00
948,000
Ex. 6–9
Purchases
Cost of Goods Sold
Inventory
Date
Quantity
Unit
Cost
Total
Cost
Quantity
Unit
Cost
Total
Cost
Quantity
Unit Cost
Total
Cost
Jan. 1
4,000
40.00
160,000
Apr. 19
2,500
40.00
100,000
1,500
40.00
60,000
June 30
4,500
44.00
198,000
6,000
43.00*
258,000
Sept. 2
5,000
43.00
215,000
1,000
43.00
43,000
Nov. 15
2,000
46.00
92,000
3,000
45.00**
135,000
Dec. 31
Balances
315,000
3,000
45.00
135,000
* ($60,000 + $198,000) 6,000 units = $43 per unit
** ($43,000 + $92,000) 3,000 units = $45 per unit
CHAPTER 6 Inventories
6–11
Ex. 6–10
Date
Purchases
Cost of Goods Sold
Inventory
Quantity
Unit
Cost
Total
Cost
Quantity
Unit
Cost
Total
Cost
Quantity
Unit
Cost
Total
Cost
Jan. 1
4,000
40.00
160,000
Apr. 19
2,500
40.00
100,000
1,500
40.00
60,000
June 30
4,500
44.00
198,000
1,500
4,500
40.00
44.00
60,000
198,000
Sept. 2
1,500
3,500
40.00
44.00
60,000
154,000
1,000
44.00
44,000
Nov. 15
2,000
46.00
92,000
1,000
2,000
44.00
46.00
44,000
92,000
Dec. 31
Balances
314,000
136,000
CHAPTER 6 Inventories
6–12
Ex. 6–11
Date
Purchases
Cost of Goods Sold
Inventory
Quantity
Unit
Cost
Total
Cost
Quantity
Unit
Cost
Total
Cost
Quantity
Unit Cost
Total
Cost
Jan. 1
4,000
40.00
160,000
Apr. 19
2,500
40.00
100,000
1,500
40.00
60,000
June 30
4,500
44.00
198,000
1,500
4,500
40.00
44.00
60,000
198,000
Sept. 2
4,500
500
44.00
40.00
198,000
20,000
1,000
40.00
40,000
Nov. 15
2,000
46.00
92,000
1,000
2,000
40.00
46.00
40,000
92,000
Dec. 31
Balances
318,000
132,000
Ex. 6–12
a. $11,700 [(1,200 units at $8 + 300 units at $7) = $9,600 + $2,100]
CHAPTER 6 Inventories
6–13
Ex. 6–13
Inventory Method
Ending
Inventory
Cost of
Goods Sold
a.
First-in, first-out
$24,912
$65,888
b.
Last-in, first-out
22,520
68,280
c.
Weighted average cost
23,608
67,192
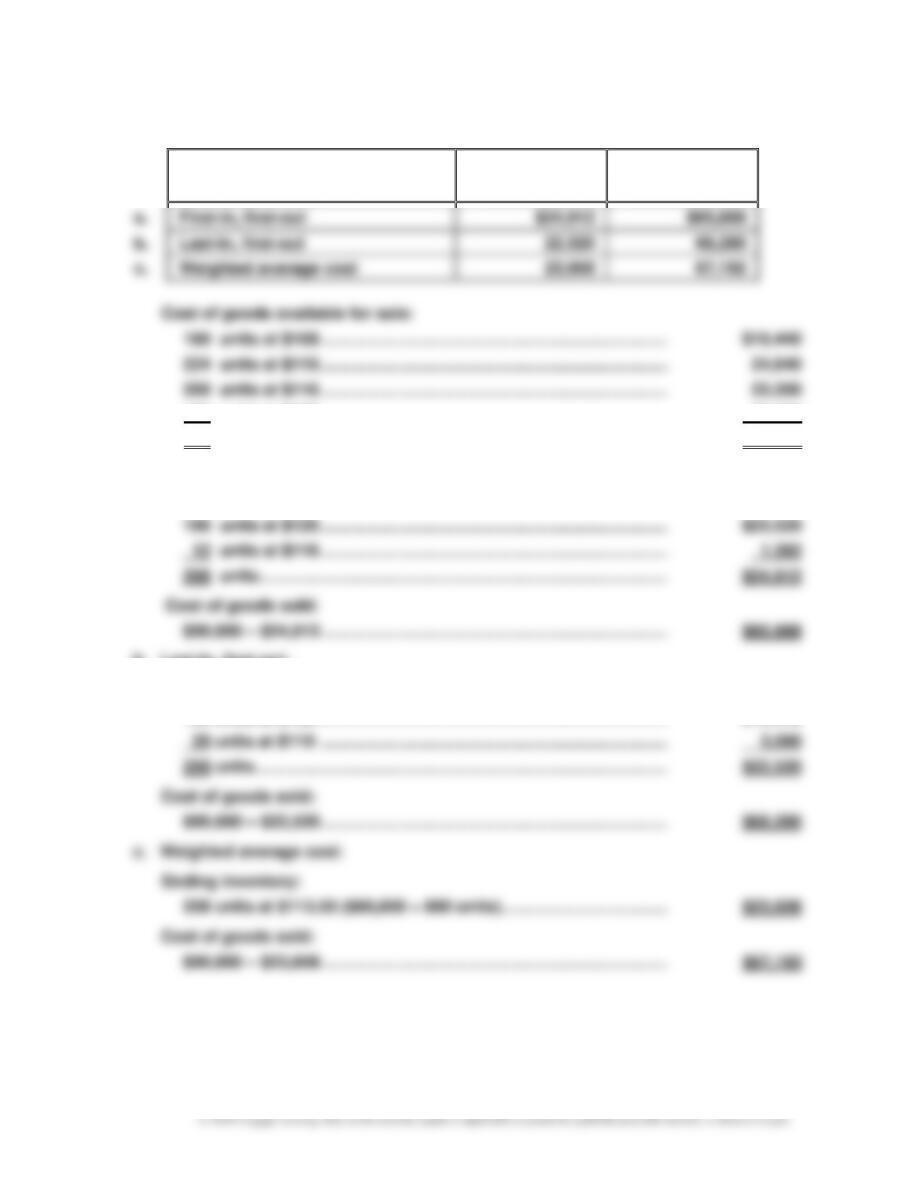
Cost of goods available for sale:
180 units at $108 ………………………………………………………………… $19,440
224 units at $110 ………………………………………………………………… 24,640
200 units at $116 ………………………………………………………………… 23,200
196 units at $120 ………………………………………………………………… 23,520
800 units (at an average cost of $113.50) ……………………………… $90,800
a. First-in, first-out:
Ending inventory:
b. Last-in, first-out:
Ending inventory:
180 units at $108 …………………………………………………………………. $19,440
CHAPTER 6 Inventories
Ex. 6–14
a. 1.
FIFO inventory
> (greater than)
LIFO inventory
2.
FIFO cost of goods sold
< (less than)
LIFO cost of goods sold
3.
FIFO net income
> (greater than)
LIFO net income
4.
FIFO income taxes
> (greater than)
LIFO income taxes
b. In periods of rising prices, the income shown on the company’s tax return would be
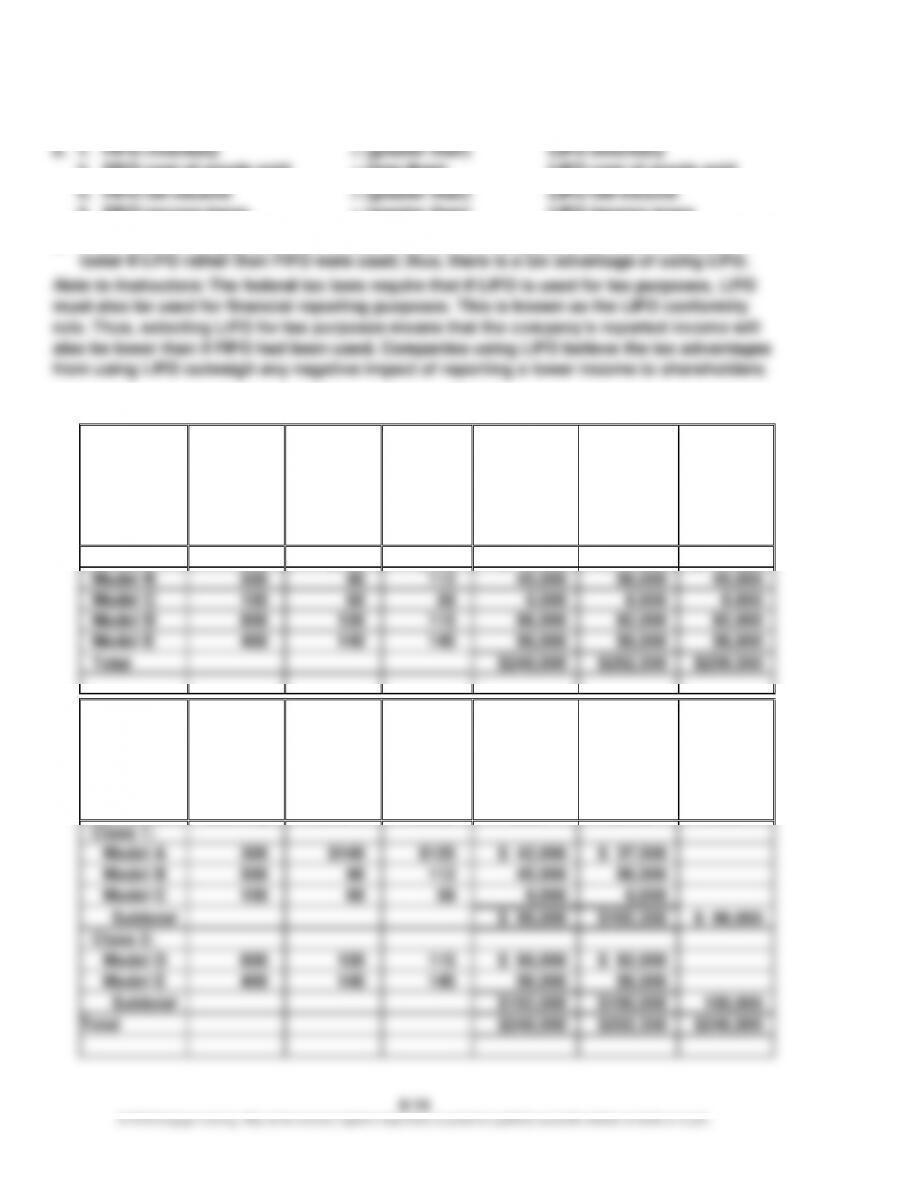
Ex. 6–15
a.
Product
Inventory
Quantity
Cost
per
Unit
Market
Value per
Unit (Net
Realizable
Value)
Cost
Market
LCM
Model A
300
$140
$125
$ 42,000
$ 37,500
$ 37,500
Model B
500
90
112
45,000
56,000
45,000
Model C
150
60
59
9,000
8,850
8,850
Model D
800
120
115
96,000
92,000
92,000
Model E
400
140
145
56,000
58,000
56,000
Total
$248,000
$252,350
$239,350
b.
Product
Inventory
Quantity
Cost
per
Unit
Market
Value per
Unit (Net
Realizable
Value)
Cost
Market
LCM
Class 1:
Model A
300
$140
$125
$ 42,000
$ 37,500
Model B
500
90
112
45,000
56,000
Model C
150
60
59
9,000
8,850
Subtotal
$ 96,000
$102,350
$ 96,000
Class 2:
Model D
800
120
115
$ 96,000
$ 92,000
Model E
400
140
145
56,000
58,000
Subtotal
$152,000
$150,000
150,000
Total
$248,000
$252,350
$246,000
CHAPTER 6 Inventories
6–15
Ex. 6–15 (Concluded)
c.
Product
Inventory
Quantity
Cost
per
Unit
Market
Value per
Unit (Net
Realizable
Value)
Cost
Market
LCM
Model A
300
$140
$125
$ 42,000
$ 37,500
Model B
500
90
112
45,000
56,000
Model C
150
60
59
9,000
8,850
Model D
800
120
115
96,000
92,000
Model E
400
140
145
56,000
58,000
Total
$248,000
$252,350
$248,000
Ex. 6–16
The inventory would appear in the Current assets section, as follows:
Ex. 6–17
a. 20Y8 Balance Sheet
Inventory ………………………………………………………………………….. $10,400 understated
CHAPTER 6 Inventories
6–16
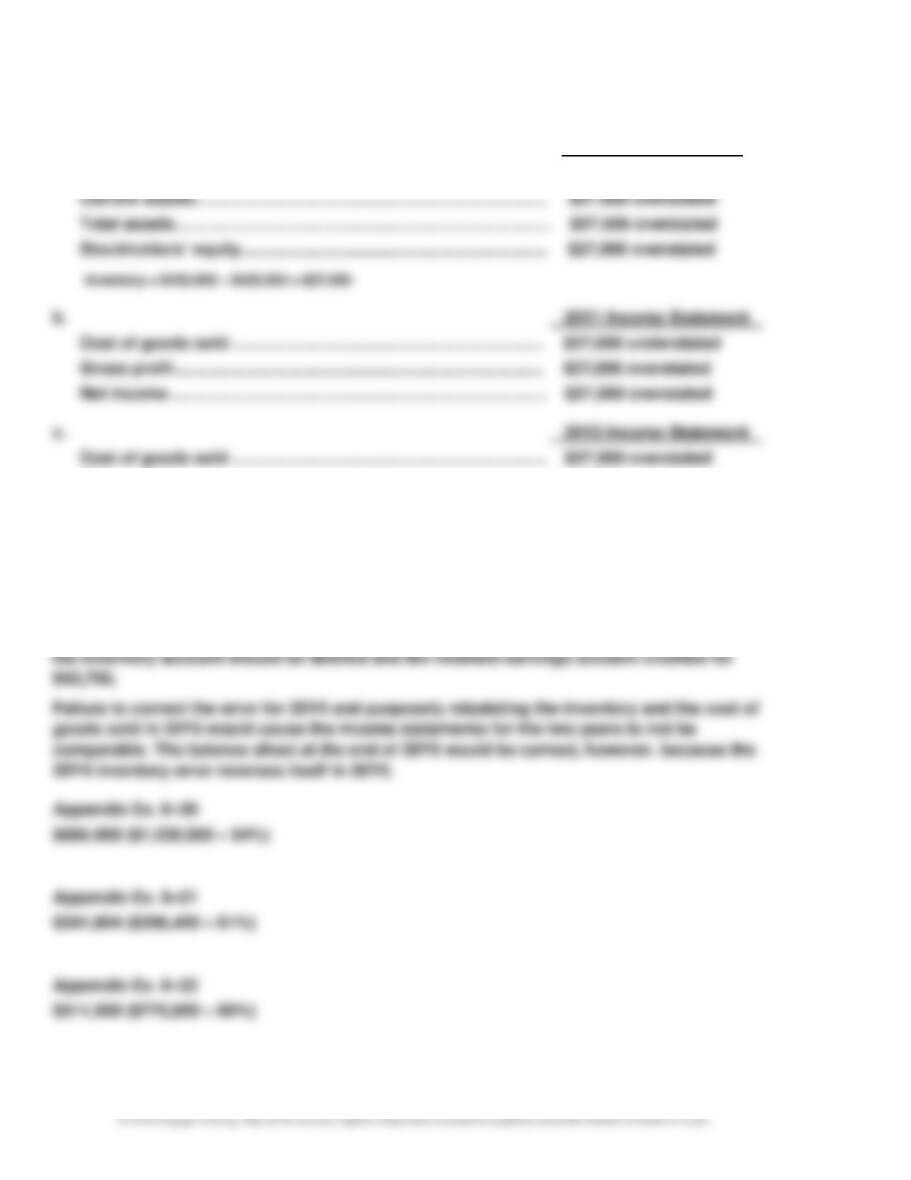
Ex. 6–18
a. 20Y1 Balance Sheet
Inventory ………………………………………………………………………… $27,000 overstated
Gross profit ……………………………………………………………………. $27,000 understated
Net income ……………………………………………………………………… $27,000 understated
d. The December 31, 20Y2, balance sheet would be correct, since the 20Y1
inventory error reverses itself in 20Y2.
Ex. 6–19
When an error is discovered affecting the prior period, it should be corrected. In this case,
CHAPTER 6 Inventories
6–17
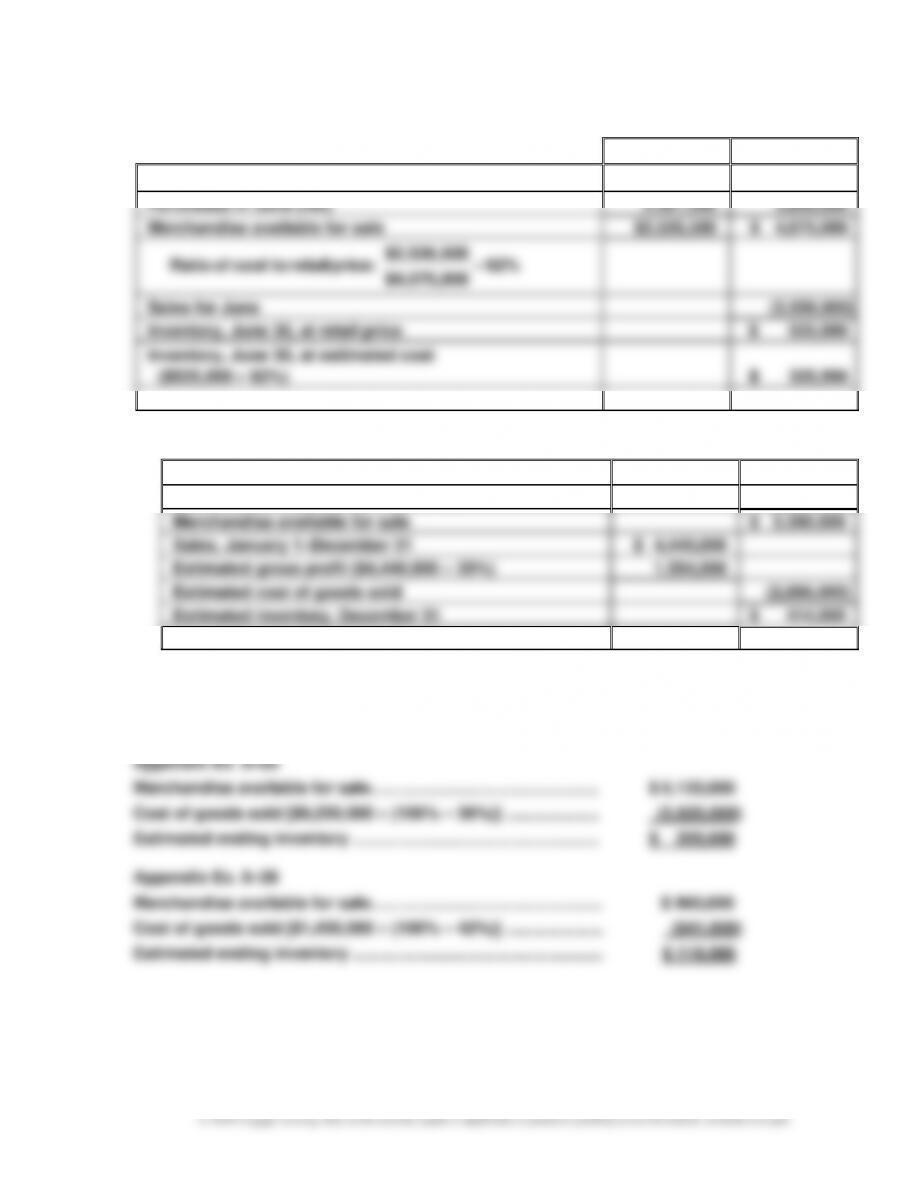
Appendix Ex. 6–23
Cost
Retail
Inventory, June 1
$ 165,000
$ 275,000
Purchases in June (net)
2,361,500
3,800,000
Merchandise available for sale
$2,526,500
$ 4,075,000
62%
$4,075,000
$2,526,500
:price retail tocost of Ratio =
Sales for June
(3,550,000)
Inventory, June 30, at retail price
$ 525,000
Inventory, June 30, at estimated cost
($525,000 62%)
$ 325,500
Appendix Ex. 6–24
a.
Inventory, January 1
$ 350,000
Purchases (net), January 1–December 31
2,950,000
Merchandise available for sale
$ 3,300,000
Sales, January 1–December 31
$ 4,440,000
Estimated gross profit ($4,440,000 35%)
1,554,000
Estimated cost of goods sold
(2,886,000)
Estimated inventory, December 31
$ 414,000
b. The gross profit method is useful for estimating inventories for monthly or quarterly
financial statements. It is also useful in estimating the cost of inventory destroyed by fire
or other disasters.
CHAPTER 6 Inventories
6–18
PROBLEMS
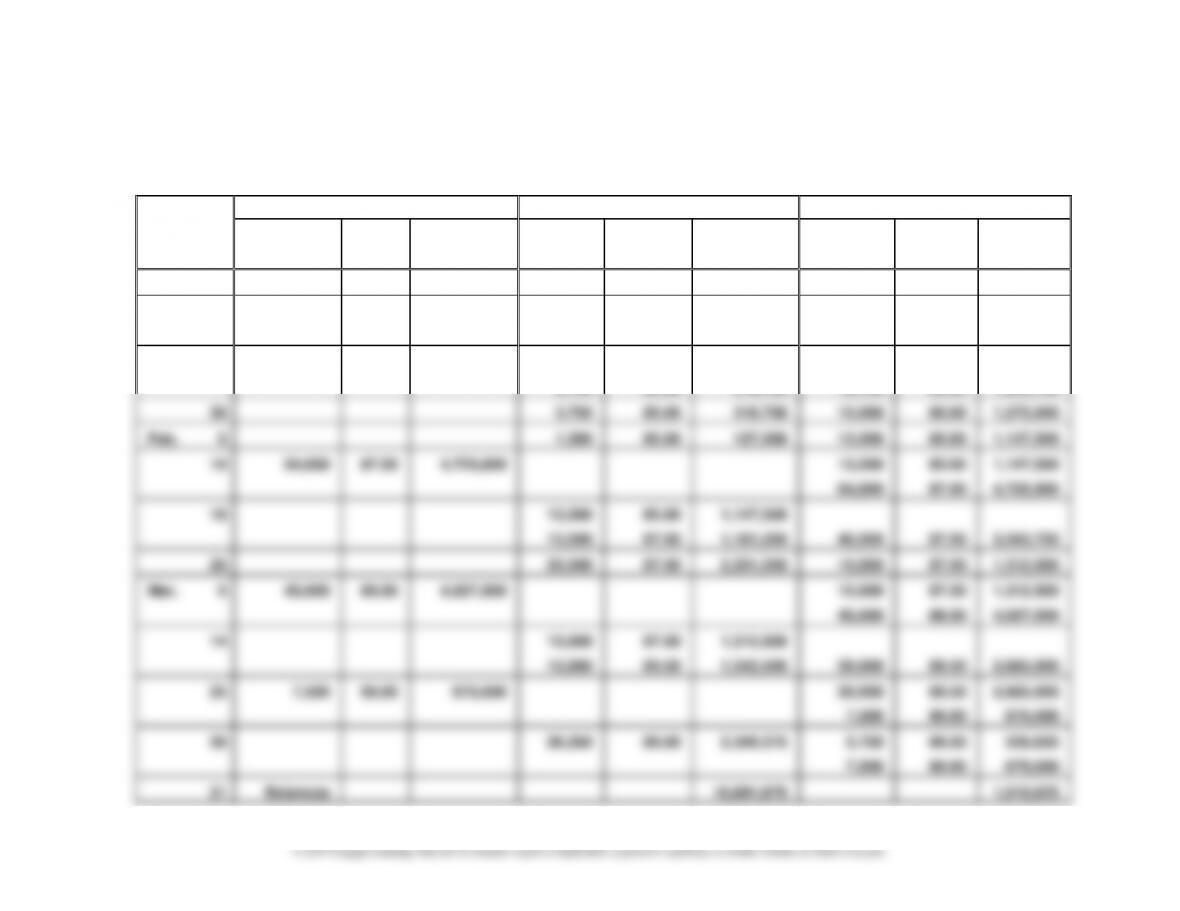
Prob. 6–1A
1.
Date
Purchases
Cost of Goods Sold
Inventory
Quantity
Unit
Cost
Total
Cost
Quantity
Unit
Cost
Total
Cost
Quantity
Unit
Cost
Total
Cost
Jan. 1
7,500
75.00
562,500
10
22,500
85.00
1,912,500
7,500
22,500
75.00
85.00
562,500
1,912,500
28
7,500
3,750
75.00
85.00
562,500
318,750
18,750
85.00
1,593,750
30
3,750
85.00
318,750
15,000
85.00
1,275,000
Feb. 5
1,500
85.00
127,500
13,500
85.00
1,147,500
10
54,000
87.50
4,725,000
13,500
54,000
85.00
87.50
1,147,500
4,725,000
16
13,500
13,500
85.00
87.50
1,147,500
1,181,250
40,500
87.50
3,543,750
28
25,500
87.50
2,231,250
15,000
87.50
1,312,500
Mar. 5
45,000
89.50
4,027,500
15,000
45,000
87.50
89.50
1,312,500
4,027,500
14
15,000
15,000
87.50
89.50
1,312,500
1,342,500
30,000
89.50
2,685,000
25
7,500
90.00
675,000
30,000
7,500
89.50
90.00
2,685,000
675,000
30
26,250
89.50
2,349,375
3,750
7,500
89.50
90.00
335,625
675,000
31
Balances
10,891,875
1,010,625
CHAPTER 6 Inventories
6–19
Prob. 6–1A (Concluded)
2.
Accounts Receivable
19,875,000
Sales
19,875,000*
Cost of Goods Sold
10,891,875
Inventory
10,891,875
*$19,875,000 = $1,687,500 + $562,500 + $225,000 + $4,320,000 + $4,080,000 + $4,800,000 + $4,200,000
3. $8,983,125 ($19,875,000 – $10,891,875)
CHAPTER 6 Inventories
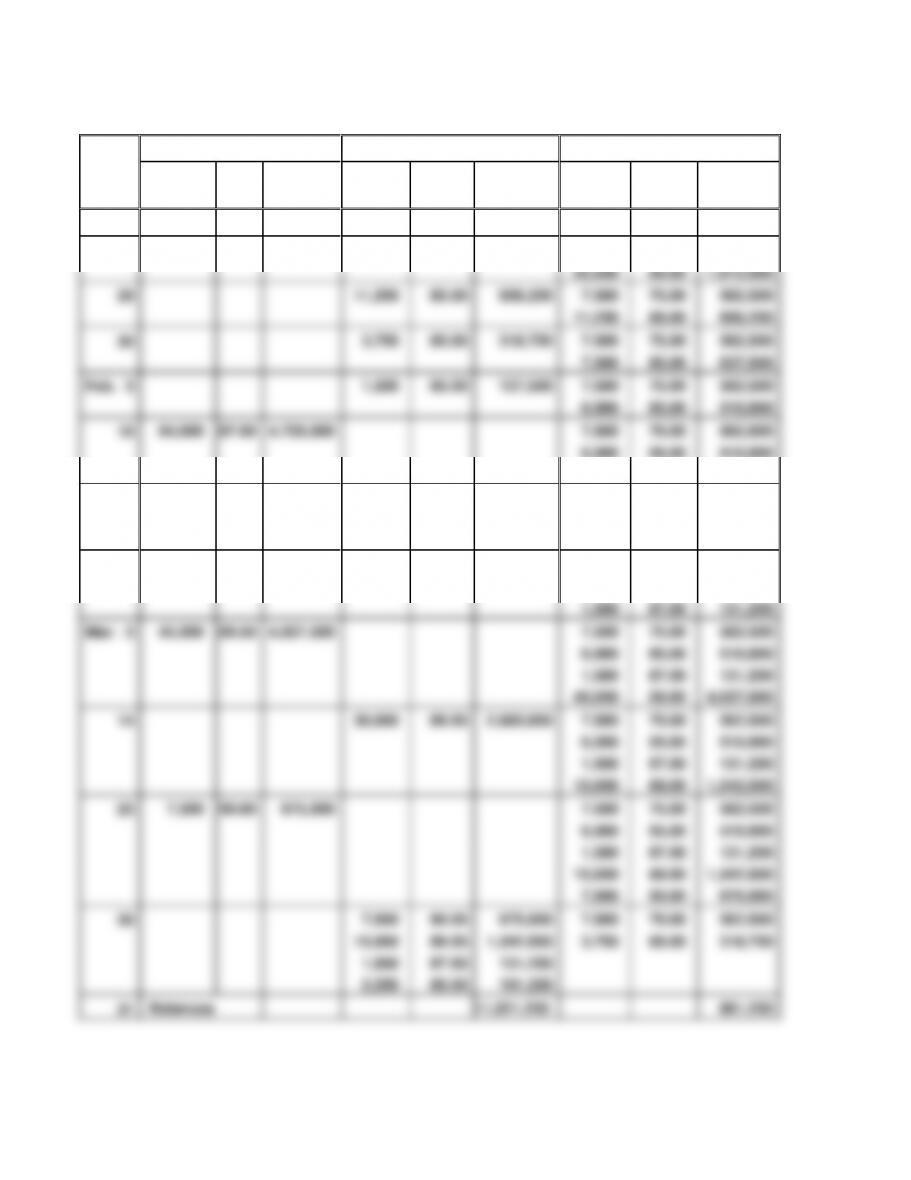
Prob. 6–2A
1.
Purchases
Cost of Goods Sold
Inventory
Unit
Total
Unit
Total
Unit
Total
Date
Quantity
Cost
Cost
Quantity
Cost
Cost
Quantity
Cost
Cost
Jan. 1
7,500
75.00
562,500
10
22,500
85.00
1,912,500
7,500
75.00
562,500
22,500
85.00
1,912,500
28
11,250
85.00
956,250
7,500
75.00
562,500
11,250
85.00
956,250
30
3,750
85.00
318,750
7,500
75.00
562,500
7,500
85.00
637,500
Feb. 5
1,500
85.00
127,500
7,500
75.00
562,500
6,000
85.00
510,000
10
54,000
87.50
4,725,000
7,500
75.00
562,500
6,000
85.00
510,000
54,000
87.50
4,725,000
16
27,000
87.50
2,362,500
7,500
75.00
562,500
6,000
85.00
510,000
27,000
87.50
2,362,500
28
25,500
87.50
2,231,250
7,500
75.00
562,500
6,000
85.00
510,000
1,500
87.50
131,250
Mar. 5
45,000
89.50
4,027,500
7,500
75.00
562,500
6,000
85.00
510,000
1,500
87.50
131,250
45,000
89.50
4,027,500
14
30,000
89.50
2,685,000
7,500
75.00
562,500
6,000
85.00
510,000
1,500
87.50
131,250
15,000
89.50
1,342,500
25
7,500
90.00
675,000
7,500
75.00
562,500
6,000
85.00
510,000
1,500
87.50
131,250
15,000
89.50
1,342,500
7,500
90.00
675,000
30
7,500
90.00
675,000
7,500
75.00
562,500
15,000
89.50
1,342,500
3,750
85.00
318,750
1,500
87.50
131,250
2,250
85.00
191,250
31
Balances
11,021,250
881,250