
1.
Apr. 3 25 $1,200 30,000$
875 $1,240 93,000$ 25 $1,200 30,000$
75 $1,240 93,000
11 25 $1,200 30,000$
15 $1,240 18,600 60 $1,240 74,400$
30 30 $1,240 37,200$ 30 $1,240 37,200
May 8 60 $1,260 75,600$ 30 $1,240 37,200$
60 $1,260 75,600
10 30 $1,240 37,200$
525,250
525,250
Sales
Accounts Receivable
310,776
310,776
3.
$214,474
4.
$32,864
An asterisk (*) will appear to the right of an incorrect entry. In part 1, only final inventory cost – Column K – will be graded.
Problem 6-1B
Name:
Solution
Section:
Scoring:
ON
Instructions
Answers are entered in the cells with gray backgrounds.
Cells with non-gray backgrounds are protected and cannot be edited.
Date
Purchases
Cost of Goods Sold
Inventory
Quantity
Unit
Cost
Total
Cost
Quantity
Unit
Cost
Total
Cost
Quantity
Unit
Cost
Total
Cost
Cost of Goods Sold
Inventory
Gross profit for the sales period
Ending inventory cost

5.
lower
Inventory under LIFO would be
An asterisk (*) will appear to the right of an incorrect entry. In part 1, only final inventory cost – Column K – will be graded.
1.
Jan. 1 7,500 $75.00 562,500$
10
28
30
Feb. 5
10
16
28
Answers are entered in the cells with gray backgrounds.
Problem 6-2A
Name:
Section:
Score:
0%
Key Code:
[Key code here]
Instructions
Unit
Cost
Total
Cost
Cells with non-gray backgrounds are protected and cannot be edited.
Date
Purchases
Cost of Goods Sold
Inventory
Quantity
Unit
Cost
Total
Cost
Quantity
Unit
Cost
Total
Cost
Quantity

Mar. 5
14
25
30
31 Balances
2.
3.
Total sales
Total cost of goods sold
Gross profit
Ending inventory cost

1.
Jan. 1 7,500 $75.00 562,500$
10 22,500 $85.00 1,912,500$ 7,500 $75.00 562,500$
22,500 $85.00 1,912,500
28 11,250 $85.00 956,250$ 7,500 $75.00 562,500$
11,250 $85.00 956,250
30 3,750 $85.00 318,750$ 7,500 $75.00 562,500$
7,500 $85.00 637,500
Feb. 5 1,500 $85.00 127,500$ 7,500 $75.00 562,500$
6,000 $85.00 510,000
10 54,000 $87.50 4,725,000$ 7,500 $75.00 562,500$
6,000 $85.00 510,000
54,000 $87.50 4,725,000
16 27,000 $87.50 2,362,500$ 7,500 $75.00 562,500$
6,000 $85.00 510,000
27,000 $87.50 2,362,500
2.
An asterisk (*) will appear to the right of an incorrect entry. In part 1, only final inventory cost – Column K – will be graded.
Problem 6-2A
Name:
Solution
Section:
Scoring:
ON
Instructions
Answers are entered in the cells with gray backgrounds.
Cells with non-gray backgrounds are protected and cannot be edited.
Date
Purchases
Cost of Goods Sold
Inventory
Quantity
Unit
Cost
Total
Cost
Quantity
Unit
Cost
Total
Cost
Quantity
Unit
Cost
Total
Cost

3.
$881,250
Ending inventory cost
An asterisk (*) will appear to the right of an incorrect entry. In part 1, only final inventory cost – Column K – will be graded.
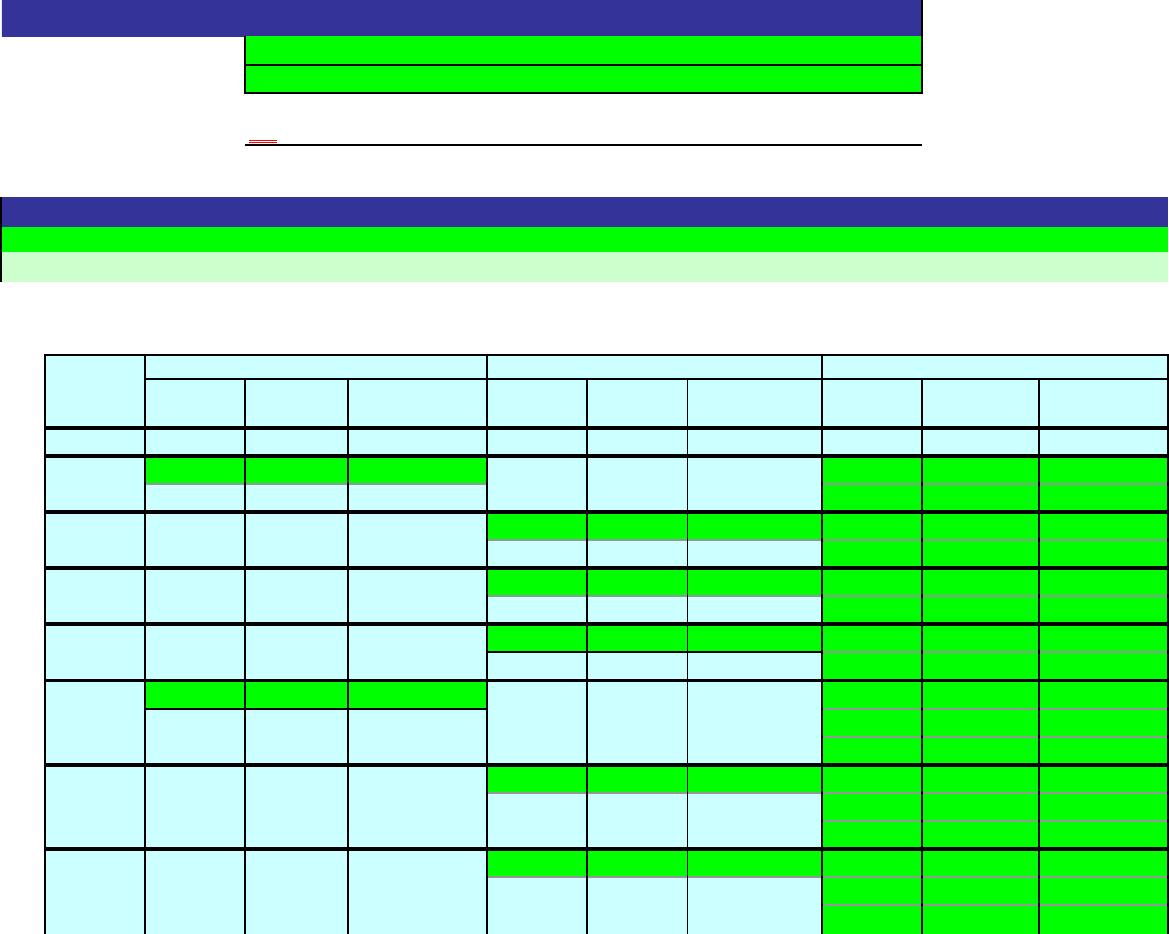
1.
Apr. 3 25 $1,200 30,000$
8
11
30
May 8
10
19
Answers are entered in the cells with gray backgrounds.
Problem 6-2B
Name:
Section:
Score:
0%
Key Code:
[Key code here]
Instructions
Unit
Cost
Total
Cost
Cells with non-gray backgrounds are protected and cannot be edited.
Date
Purchases
Cost of Goods Sold
Inventory
Quantity
Unit
Cost
Total
Cost
Quantity
Unit
Cost
Total
Cost
Quantity

28
June 5
16
21
28
30 Balances
2.
3.
Total sales
Total cost of goods sold
Gross profit
Ending inventory cost

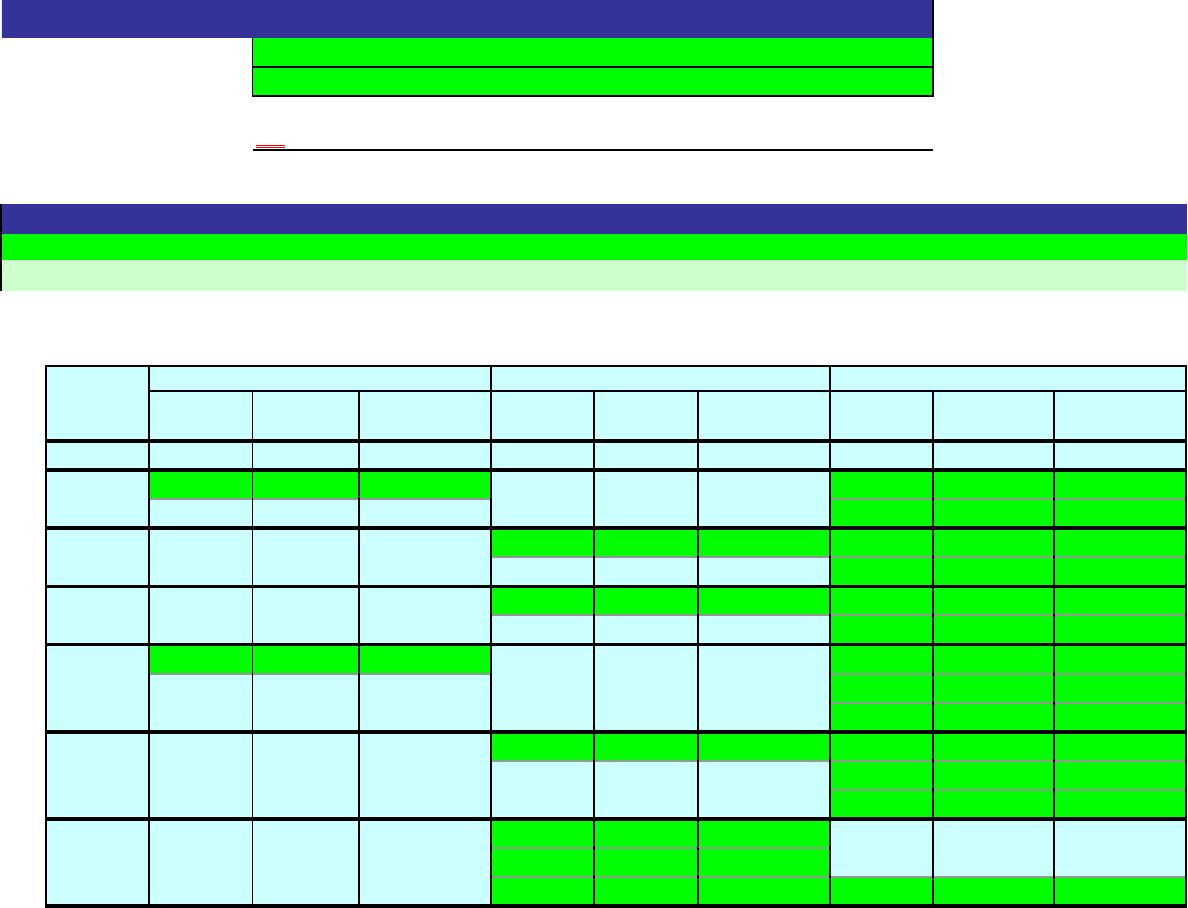
1.
Apr. 3 25 $1,200 30,000$
875 $1,240 93,000$ 25 $1,200 30,000$
75 $1,240 93,000
11 40 $1,240 49,600$ 25 $1,200 30,000$
35 $1,240 43,400
30 30 $1,240 37,200$ 25 $1,200 30,000$
5 $1,240 6,200
May 8 60 $1,260 75,600$ 25 $1,200 30,000$
5 $1,240 6,200
June 5 40 $1,260 50,400$ 20 $1,200 24,000$
40 $1,260 50,400
16 25 $1,260 31,500$ 20 $1,200 24,000$
15 $1,260 18,900
21 35 $1,264 44,240$ 20 $1,200 24,000$
15 $1,260 18,900
2.
Total sales
Total cost of goods sold
3.
$31,560
An asterisk (*) will appear to the right of an incorrect entry. In part 1, only final inventory cost – Column K – will be graded.
Problem 6-2B
Name:
Solution
Section:
Scoring:
ON
Instructions
Answers are entered in the cells with gray backgrounds.
Cells with non-gray backgrounds are protected and cannot be edited.
Date
Purchases
Cost of Goods Sold
Inventory
Quantity
Unit
Cost
Total
Cost
Quantity
Unit
Cost
Total
Cost
Quantity
Unit
Cost
Total
Cost
Ending inventory cost

Key Code:
An asterisk (*) will appear to the right of an incorrect entry.
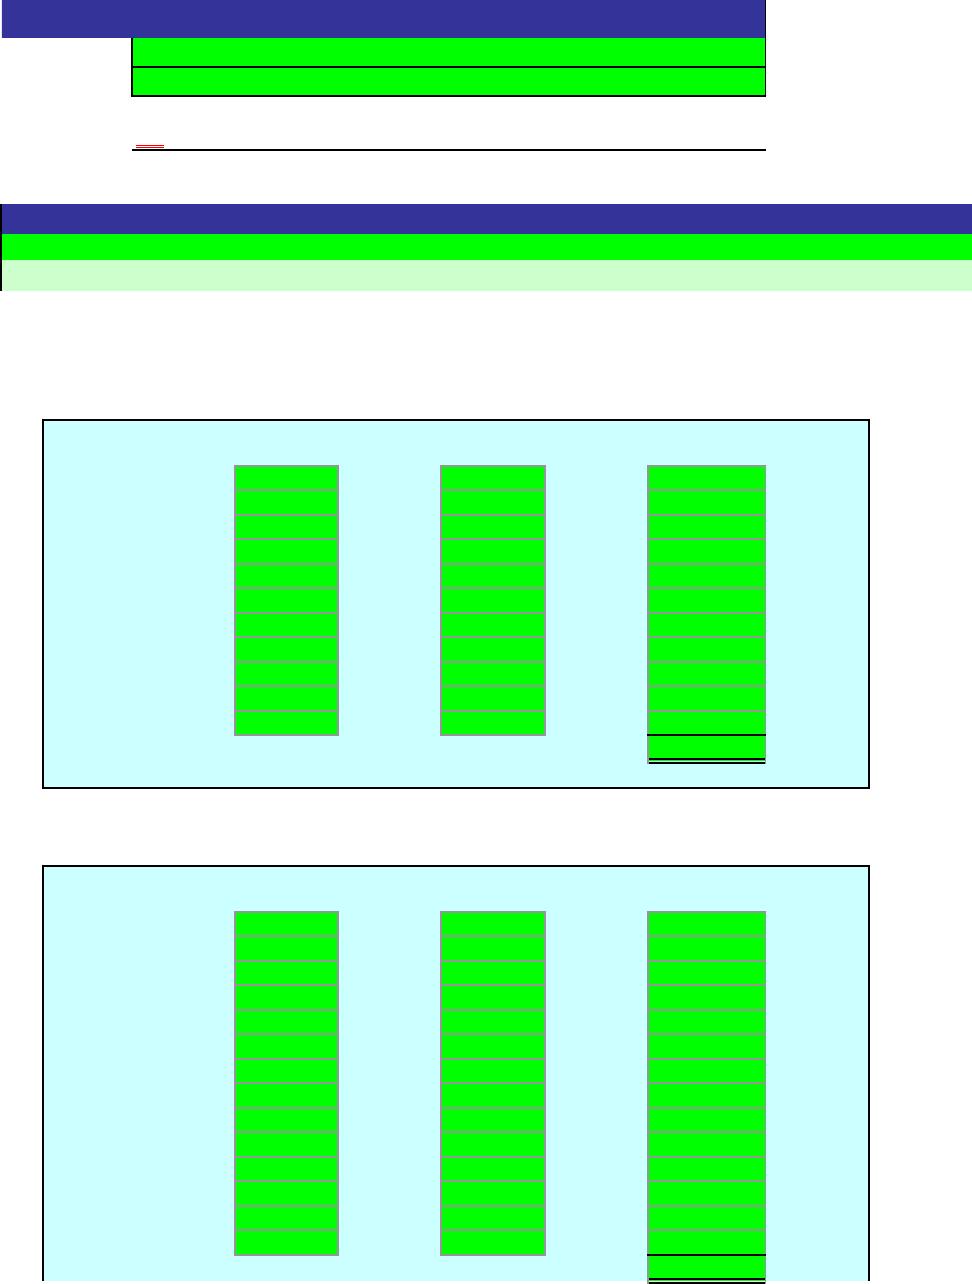
1.
First-In, First-Out Method (list most recent purchases first for each item)
Model Quantity Unit Cost Total Cost
A10
B15
E60
G83
J34
M90
Q70
Total . . . . . . . . . . . . . . . . . . . . . . . . . . . . . .
2.
Last-In, First-Out Method (list oldest purchases first for each item)
Model Quantity Unit Cost Total Cost
A10
B15
E60
G83
J34
M90
Q70
Total . . . . . . . . . . . . . . . . . . . . . . . . . . . . . .
Problem 6-5A
Name:
Section:
Score:
0%
[Key code here]
Instructions
Answers are entered in the cells with gray backgrounds.
Cells with non-gray backgrounds are protected and cannot be edited.
3. Average Cost Method
Model Quantity Unit Cost Total Cost
A10
B15
E60
G83
J34
M90
Q70
Total . . . . . . . . . . . . . . . . . . . . . . . . . . . . . .
4.
a. In periods of rising prices, the will result in lower
cost of inventory, a greater amount of cost of merchandise sold, lower net income, and
less taxes in the current year.
b. In periods of falling prices, the will result in lower
net income and would be preferred for income tax purposes.
1.
First-In, First-Out Method (list most recent purchases first for each item)
Model Quantity Unit Cost Total Cost
A10 4 76$ 304$
270 140
B15 6 184 1,104
2170 340
E60 5 70 350
G83 9 259 2,331
J34 15 270 4,050
M90 3130 390
2128 256
Last-In, First-Out Method (list oldest purchases first for each item)
A10 4 64$ 256$
Scoring:
ON
Problem 6-5A
Name:
Solution
Section:
Instructions
Answers are entered in the cells with gray backgrounds.
Cells with non-gray backgrounds are protected and cannot be edited.
An asterisk (*) will appear to the right of an incorrect entry.
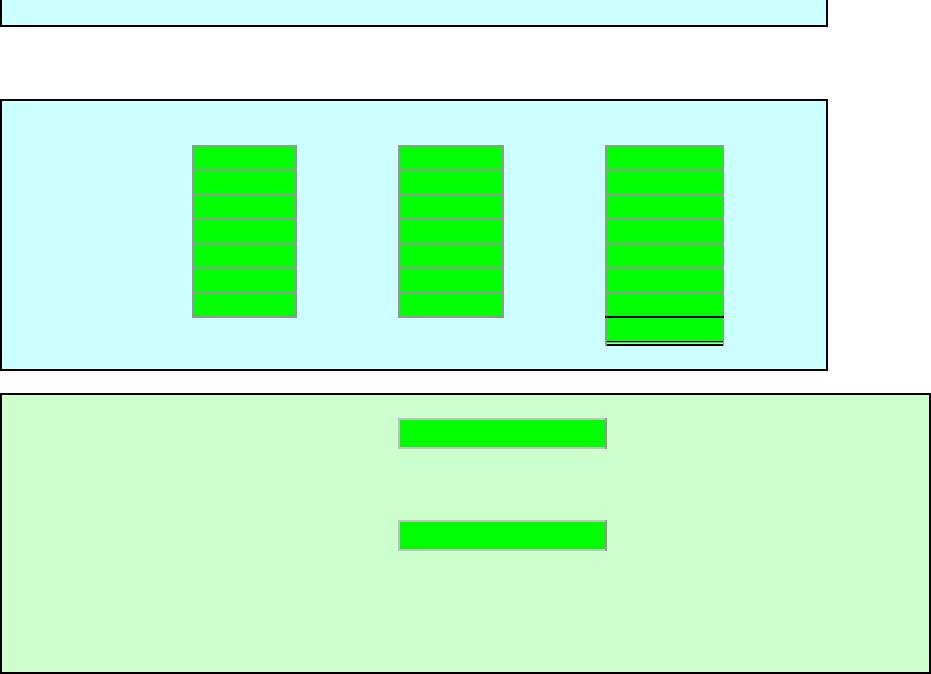
3. Average Cost Method
Model Quantity Unit Cost Total Cost
A10 6 70$ 420$
B15 8 174 1,392
E60 5 69 345
G83 9 253 2,277
J34 15 258 3,870
M90 5121 605
Q70 8 172 1,376
Total . . . . . . . . . . . . . . . . . . . . . . . . . . . . . . 10,285$
4.
a. In periods of rising prices, the will result in lower
cost of inventory, a greater amount of cost of merchandise sold, lower net income, and
less taxes in the current year.
b. In periods of falling prices, the will result in lower
net income and would be preferred for income tax purposes.
FIFO method
LIFO method
Key Code:
An asterisk (*) will appear to the right of an incorrect entry.
1.
First-In, First-Out Method (list most recent purchases first for each item)
Model Quantity Unit Cost Total Cost
C55
D11
F32
H29
K47
S33
X74
Total . . . . . . . . . . . . . . . . . . . . . . . . . . . . . .
2.
Last-In, First-Out Method (list oldest purchases first for each item)
Model Quantity Unit Cost Total Cost
C55
D11
F32
H29
K47
S33
X74
Total . . . . . . . . . . . . . . . . . . . . . . . . . . . . . .
3. Average Cost Method
Problem 6-5B
Name:
Section:
Score:
0%
[Key code here]
Instructions
Answers are entered in the cells with gray backgrounds.
Cells with non-gray backgrounds are protected and cannot be edited.
Model Quantity Unit Cost Total Cost
C55
D11
F32
H29
K47
S33
X74
Total . . . . . . . . . . . . . . . . . . . . . . . . . . . . . .
4.
a. In periods of rising prices, the will result in lower
cost of inventory, a greater amount of cost of merchandise sold, lower net income, and
less taxes in the current year.
b. In periods of falling prices, the will result in lower
net income and would be preferred for income tax purposes.
Key Code:
1.
First-In, First-Out Method (list most recent purchases first for each item)
Model Quantity Unit Cost Total Cost
C55 3 1,070$ 3,210$
11,060 1,060
D11 6 675 4,050
5666 3,330
F32 1 280 280
1260 260
H29 4 317 1,268
K47 6 542 3,252
2549 1,098
Last-In, First-Out Method (list oldest purchases first for each item)
C55 3 1,040$ 3,120$
Score:
ON
Problem 6-5B
Name:
Solution
Section:
Instructions
Answers are entered in the cells with gray backgrounds.
Cells with non-gray backgrounds are protected and cannot be edited.
An asterisk (*) will appear to the right of an incorrect entry.
Model Quantity Unit Cost Total Cost
C55 4 1,056$ 4,224$
D11 11 654 7,194
F32 2 252 504
H29 4 311 1,244
K47 8 534 4,272
S33 2 227 454
X74 7 37 259
Total . . . . . . . . . . . . . . . . . . . . . . . . . . . . . . 18,151$
4.
a. In periods of rising prices, the will result in lower
cost of inventory, a greater amount of cost of merchandise sold, lower net income, and
less taxes in the current year.
b. In periods of falling prices, the will result in lower
net income and would be preferred for income tax purposes.
FIFO method
LIFO method