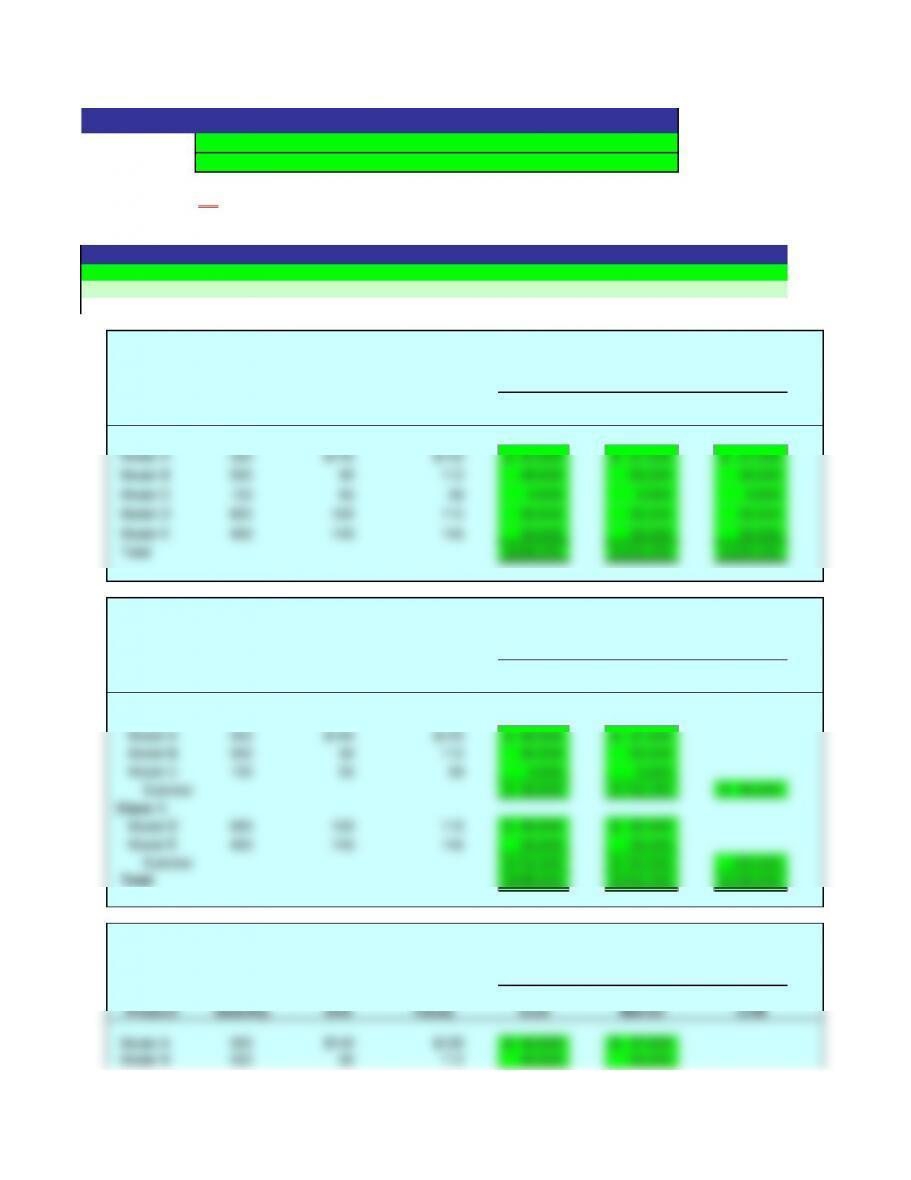
An asterisk (*) will appear to the right of an incorrect entry. Only final inventory cost – Column K – will be graded.
Nov. 1 120 $39 4,680$
10
15
20
24
30
30 Balances
Answers are entered in the cells with gray backgrounds.
Exercise 6-4
Name:
Section:
Score:
0%
Key Code:
[Key code here]
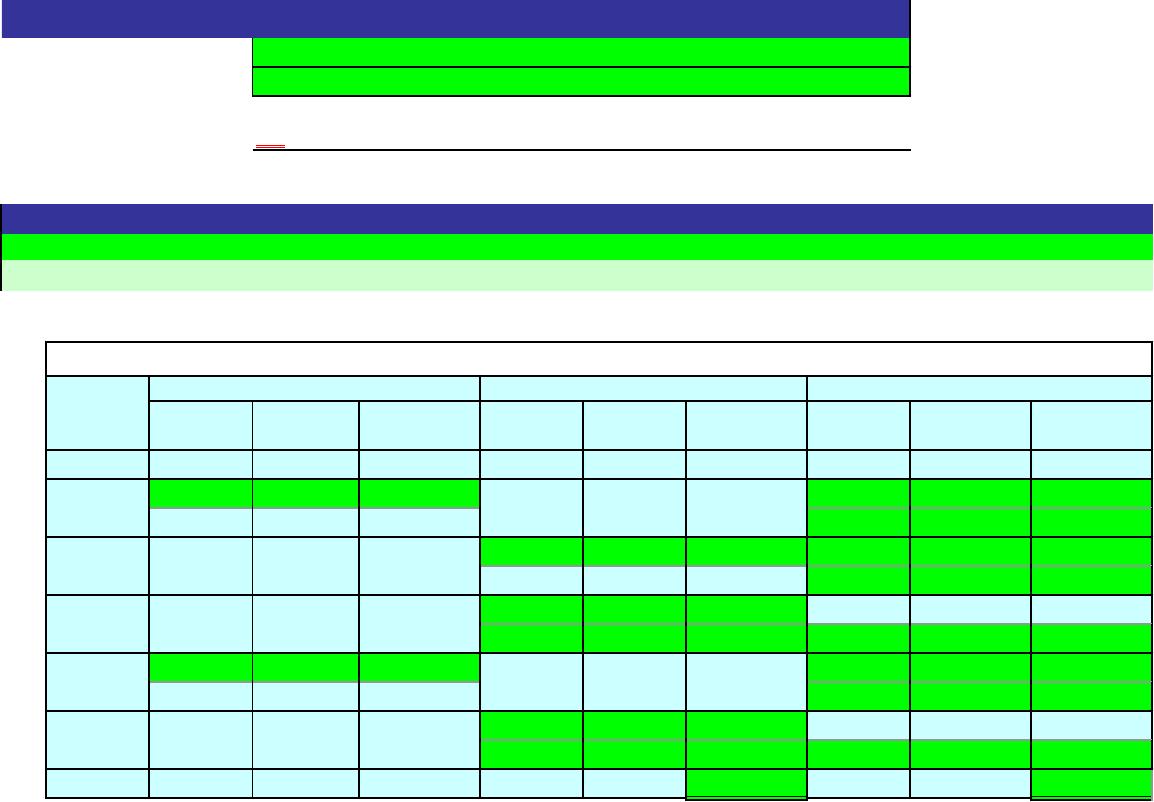
Instructions
Cells with non-gray backgrounds are protected and cannot be edited.
DVD Players
Date
Purchases
Cost of Goods Sold
Inventory
Quantity
Unit
Cost
Total
Cost
Quantity
Unit
Cost
Total
Cost
Quantity
Unit
Cost
Total
Cost
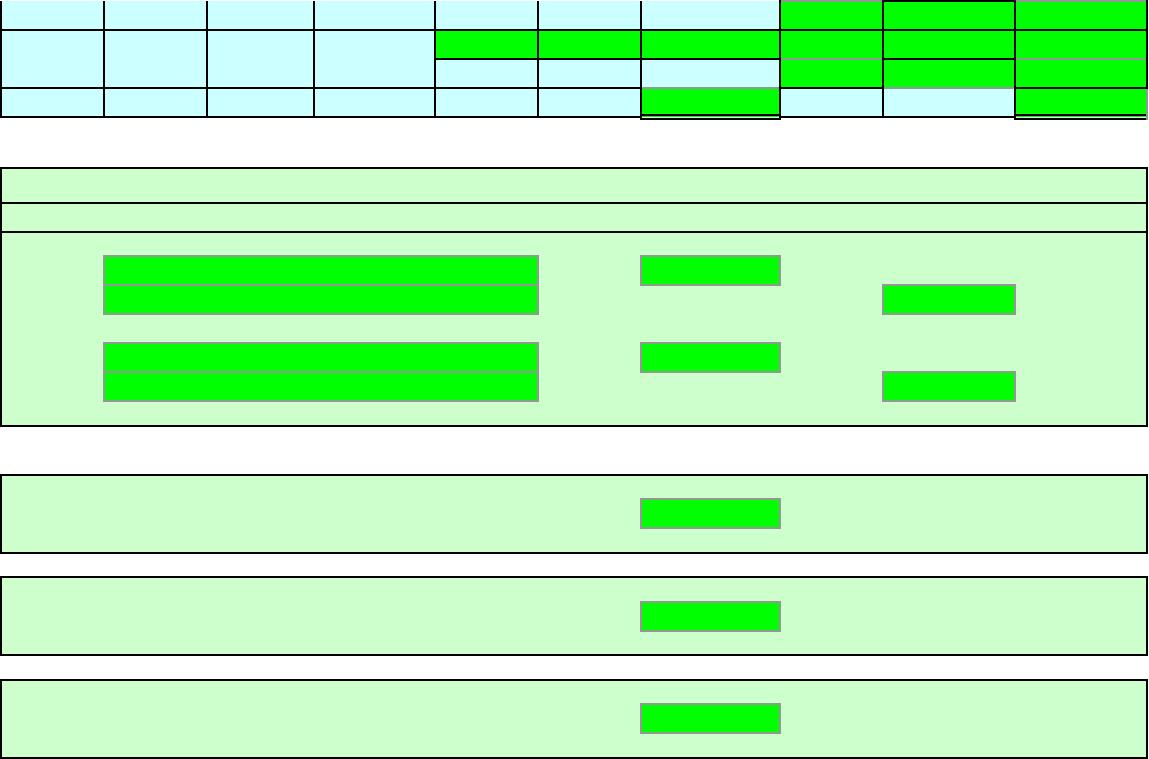
Nov. 1 120 $39 4,680$
10 90 $39 3,510$ 30 $39 1,170$
15 140 $40 5,600$ 30 $39 1,170$
140 $40 5,600
20 110 $40 4,400$ 30 $39 1,170$
30 $40 1,200
24 30 $40 1,200$ 15 $39 585$
15 $39 585
30 160 $43 6,880$ 15 $39 585$
160 $43 6,880
30 Balances 9,695$ 7,465$
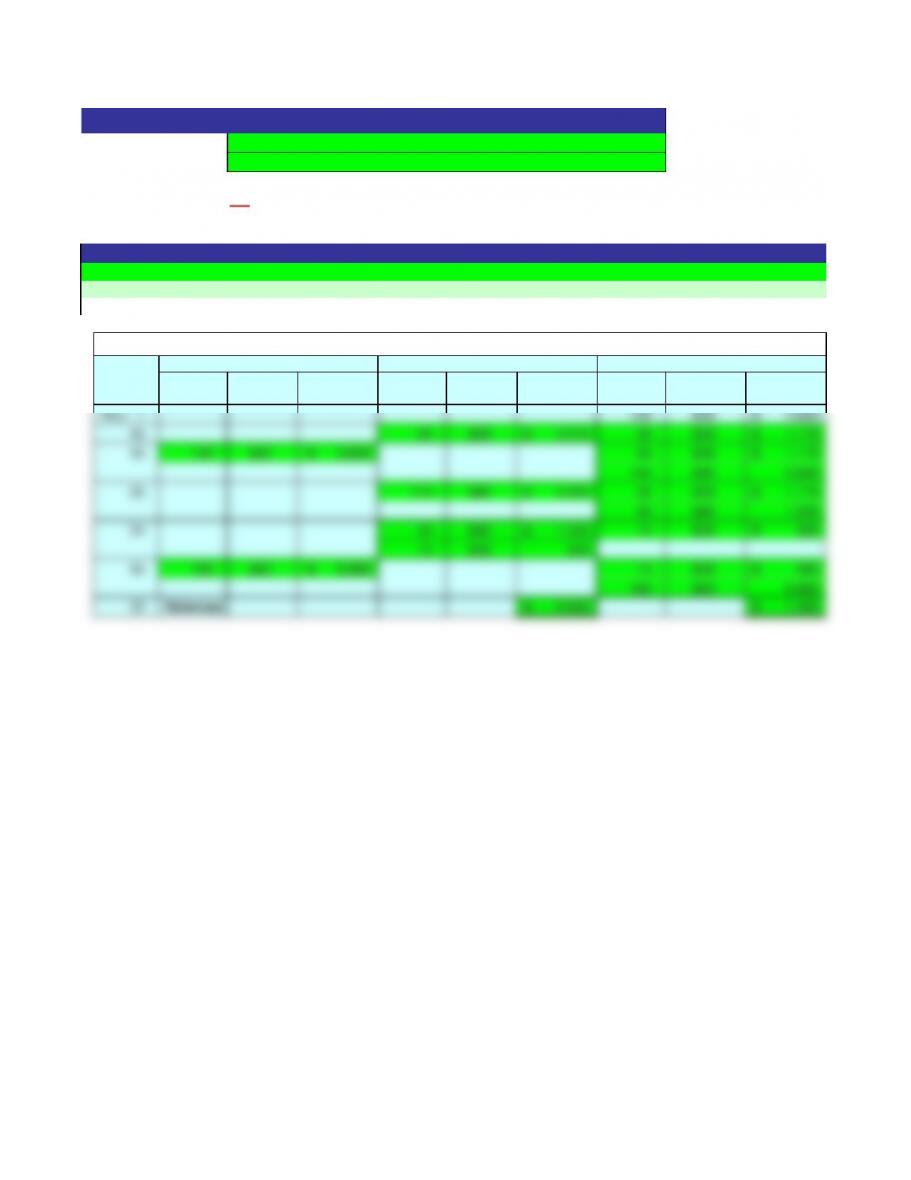
An asterisk (*) will appear to the right of an incorrect entry. Only final inventory cost – Column K – will be graded.
Exercise 6-4
Name:
Solution
Section:
Scoring:
ON
Instructions
Answers are entered in the cells with gray backgrounds.
Cells with non-gray backgrounds are protected and cannot be edited.
DVD Players
Date
Purchases
Cost of Goods Sold
Inventory
Quantity
Unit
Cost
Total
Cost
Quantity
Unit
Cost
Total
Cost
Quantity
Unit
Cost
Total
Cost
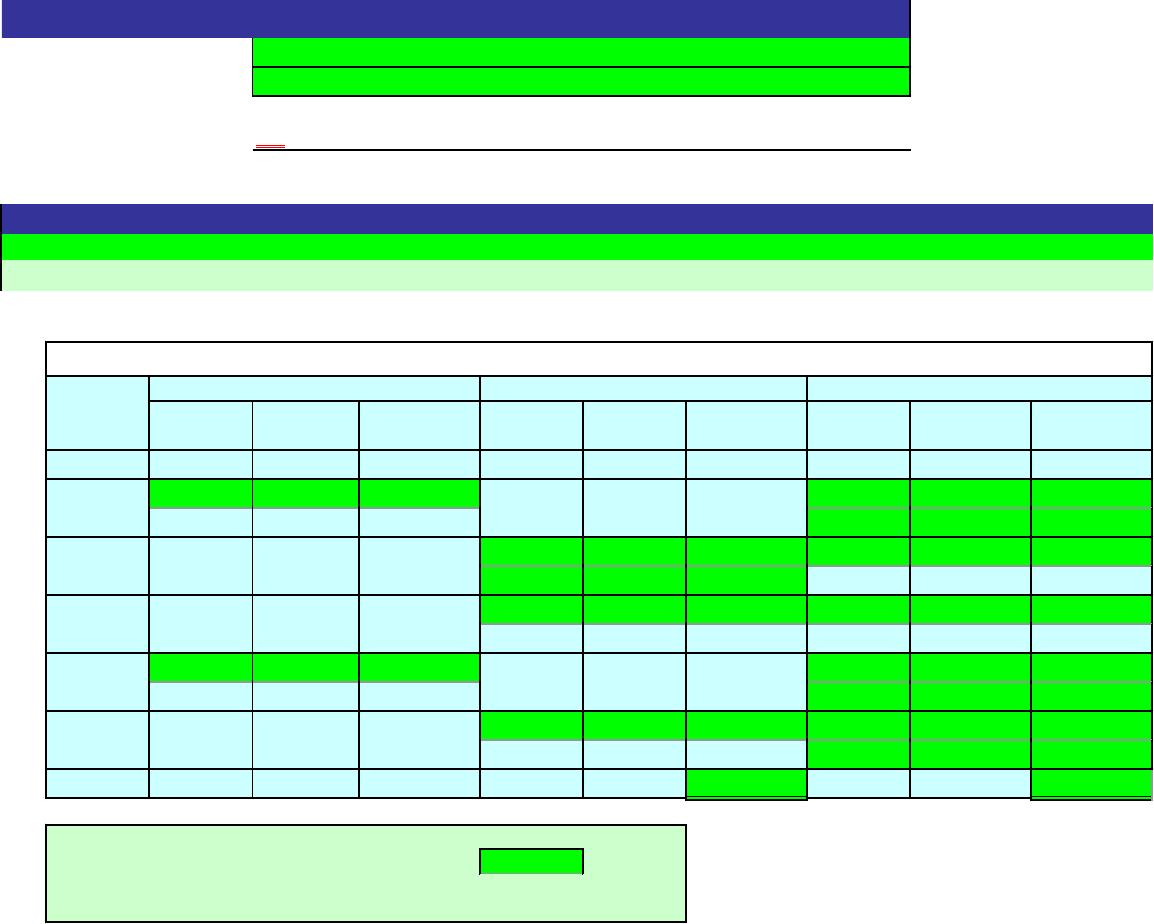
An asterisk (*) will appear to the right of an incorrect entry. Only final inventory cost – Column K – will be graded.
a.
Dec. 1 310 $88 27,280$
10
12
14
20
31
31 Balances
b.
Based on the above data, inventory will be
using the first-in, first out method.
Answers are entered in the cells with gray backgrounds.
Exercise 6-5
Name:
Section:
Score:
0%
Key Code:
[Key code here]
Instructions
Cells with non-gray backgrounds are protected and cannot be edited.
Prepaid Cell Phones
Date
Purchases
Cost of Goods Sold
Inventory
Quantity
Unit
Cost
Total
Cost
Quantity
Unit
Cost
Total
Cost
Quantity
Unit
Cost
Total
Cost
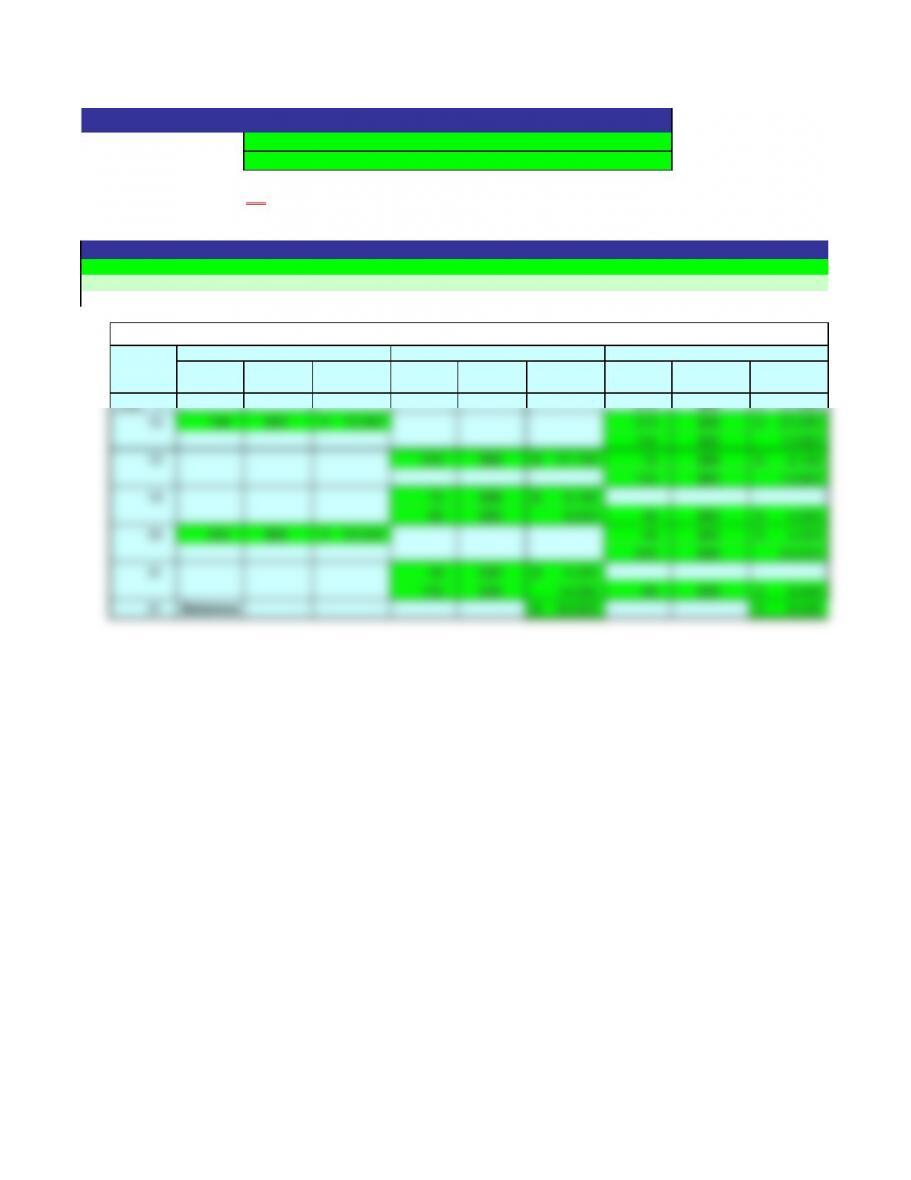
a.
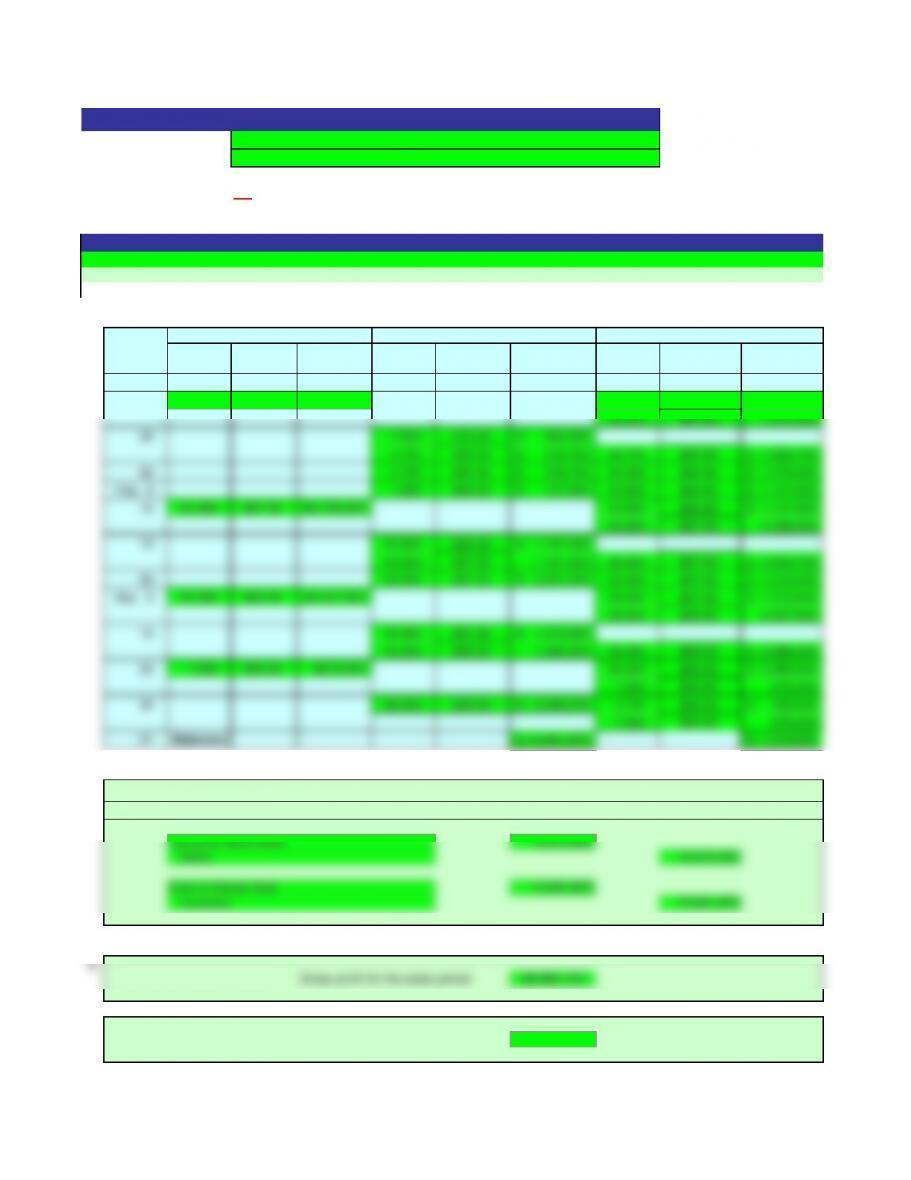
Dec. 1 310 $88 27,280$
10 144 $90 12,960$ 310 $88 27,280$
144 $90 12,960
12 144 $90 12,960$ 214 $88 18,832$
96 $88 8,448
14 166 $88 14,608$ 48 $88 4,224$
20 240 $96 23,040$ 48 $88 4,224$
240 $96 23,040
31 200 $96 19,200$ 48 $88 4,224$
40 $96 3,840
31 Balances 55,216$ 8,064$
b.
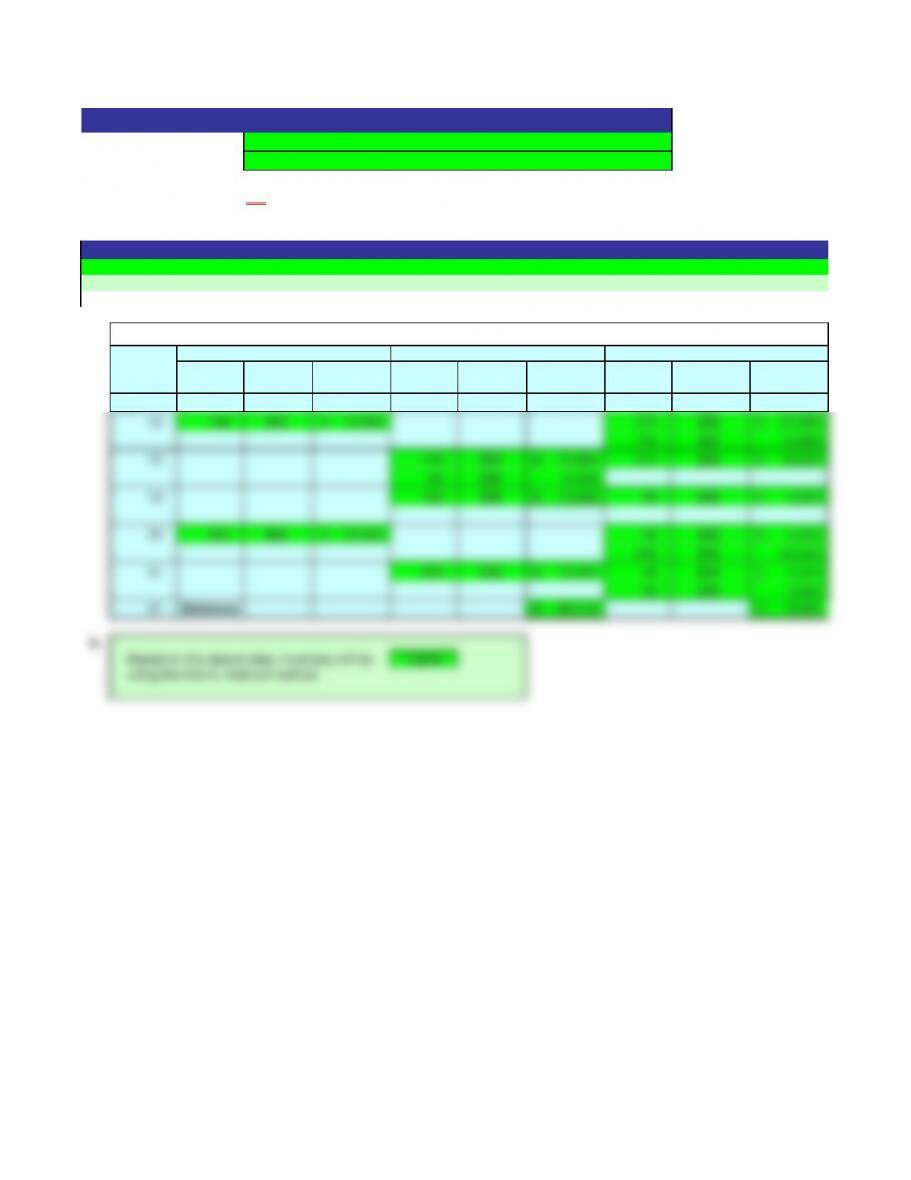
Based on the above data, inventory will be
higher
using the first-in, first out method.
An asterisk (*) will appear to the right of an incorrect entry. Only final inventory cost – Column K – will be graded.
Exercise 6-5
Name:
Solution
Section:
Scoring:
ON
Instructions
Answers are entered in the cells with gray backgrounds.
Cells with non-gray backgrounds are protected and cannot be edited.
Prepaid Cell Phones
Date
Purchases
Cost of Goods Sold
Inventory
Quantity
Unit
Cost
Total
Cost
Quantity
Unit
Cost
Total
Cost
Quantity
Unit
Cost
Total
Cost
An asterisk (*) will appear to the right of an incorrect entry. Only final inventory cost – Column K – will be graded.
Dec. 1 310 $88 27,280$
10
12
14
20
31
31 Balances
Answers are entered in the cells with gray backgrounds.
Exercise 6-6
Name:
Section:
Score:
0%
Key Code:
[Key code here]
Instructions
Cells with non-gray backgrounds are protected and cannot be edited.
Prepaid Cell Phones
Date
Purchases
Cost of Goods Sold
Inventory
Quantity
Unit
Cost
Total
Cost
Quantity
Unit
Cost
Total
Cost
Quantity
Unit
Cost
Total
Cost
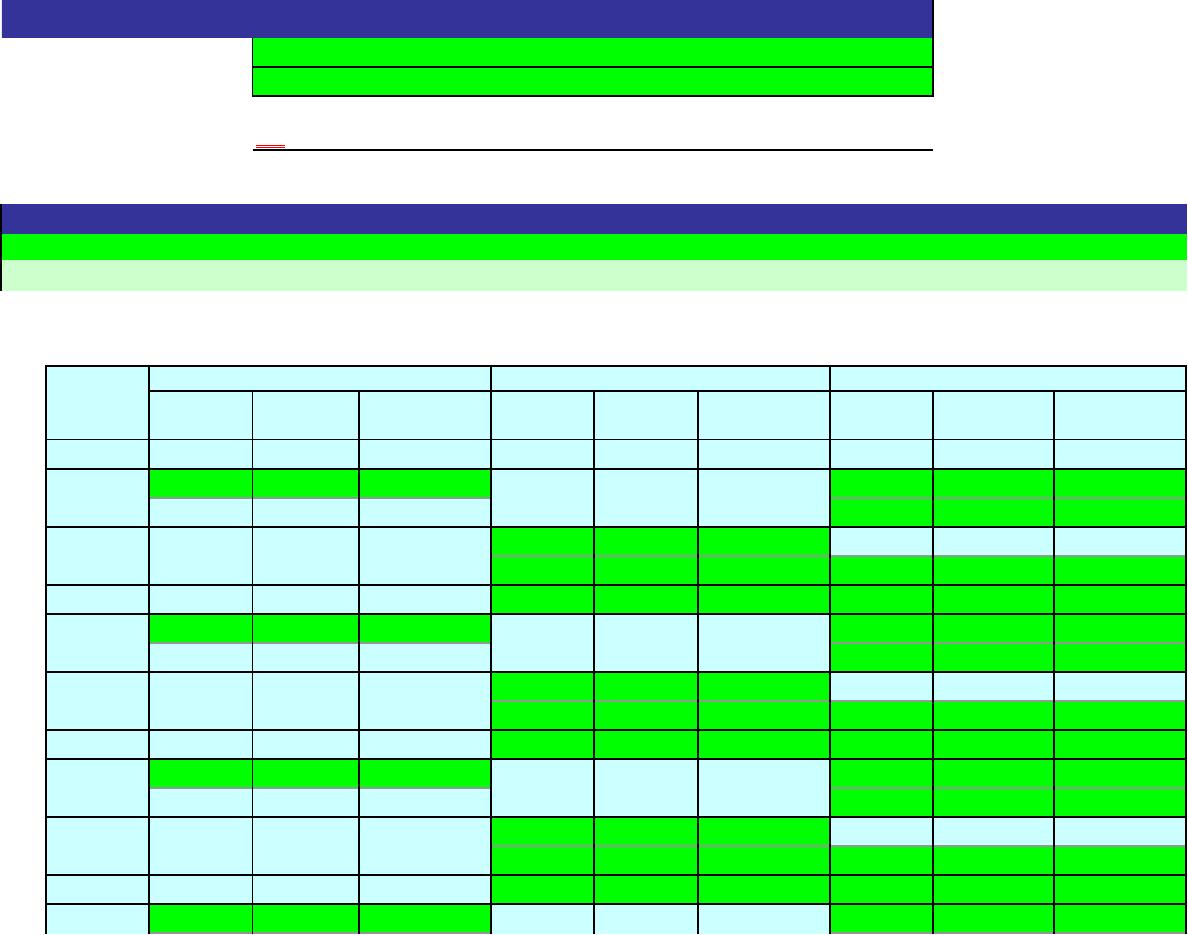
Dec. 1 310 $88 27,280$
10 144 $90 12,960$ 310 $88 27,280$
144 $90 12,960
12 240 $88 21,120$ 70 $88 6,160$
144 $90 12,960
14 70 $88 6,160$
96 $90 8,640 48 $90 4,320$
20 240 $96 23,040$ 48 $90 4,320$
240 $96 23,040
31 48 $90 4,320$
152 $96 14,592 88 $96 8,448$
31 Balances 54,832$ 8,448$
An asterisk (*) will appear to the right of an incorrect entry. Only final inventory cost – Column K – will be graded.
Exercise 6-6
Name:
Solution
Section:
Scoring:
ON
Instructions
Answers are entered in the cells with gray backgrounds.
Cells with non-gray backgrounds are protected and cannot be edited.
Prepaid Cell Phones
Date
Purchases
Cost of Goods Sold
Inventory
Quantity
Unit
Cost
Total
Cost
Quantity
Unit
Cost
Total
Cost
Quantity
Unit
Cost
Total
Cost
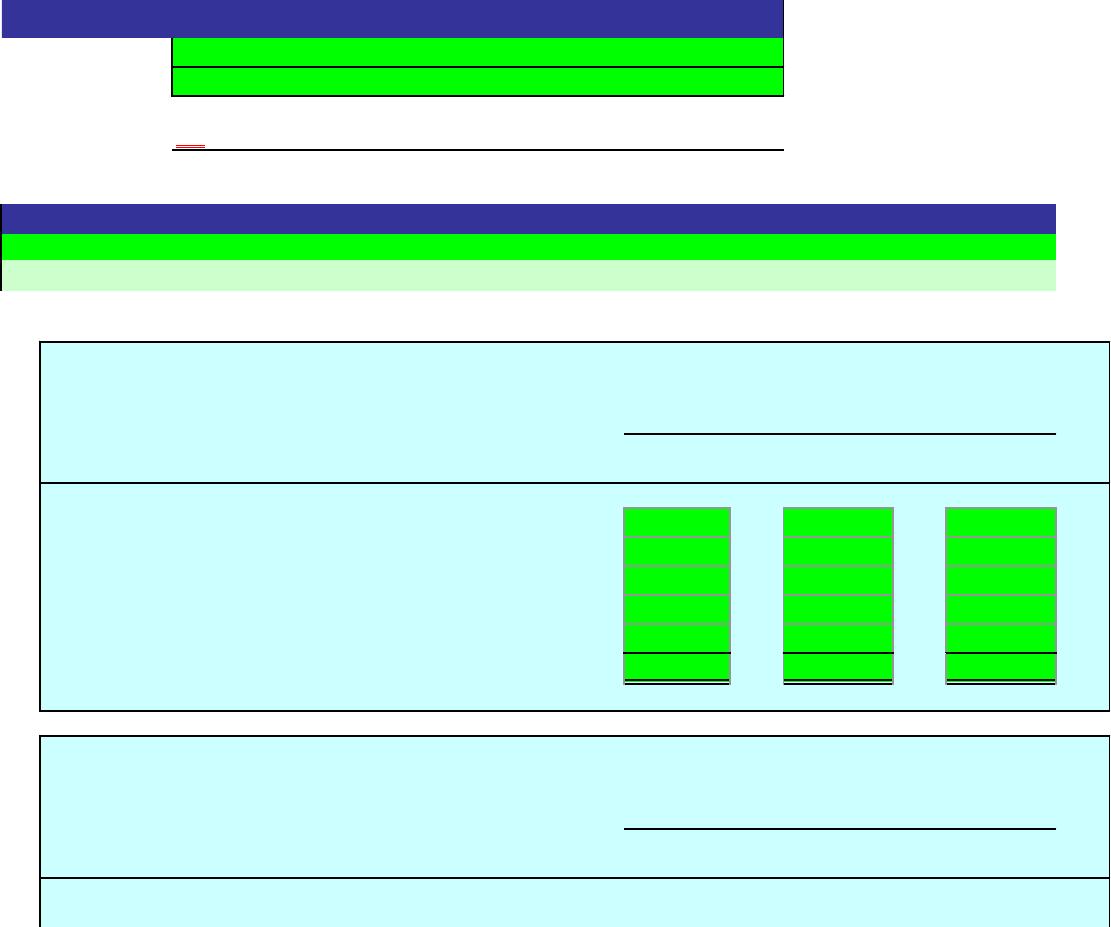
An asterisk (*) will appear to the right of an incorrect entry.
Product Cost Market LCM
Model A 300 $140 $125
Model B 500 90 112
Model C 150 60 59
Model D 800 120 115
Model E 400 140 145
Total
Product Cost Market LCM
Class 1:
Answers are entered in the cells with gray backgrounds.
Exercise 6-15
Name:
Section:
Score:
0%
Key Code:
[Key code here]
Instructions
Cells with non-gray backgrounds are protected and cannot be edited.
a.
Cost
per
Unit
Market Value
per Unit (Net
Realizable
Value)
Total
Inventory
Quantity
b.
Cost
per
Unit
Market Value
per Unit (Net
Realizable
Value)
Total
Inventory
Quantity
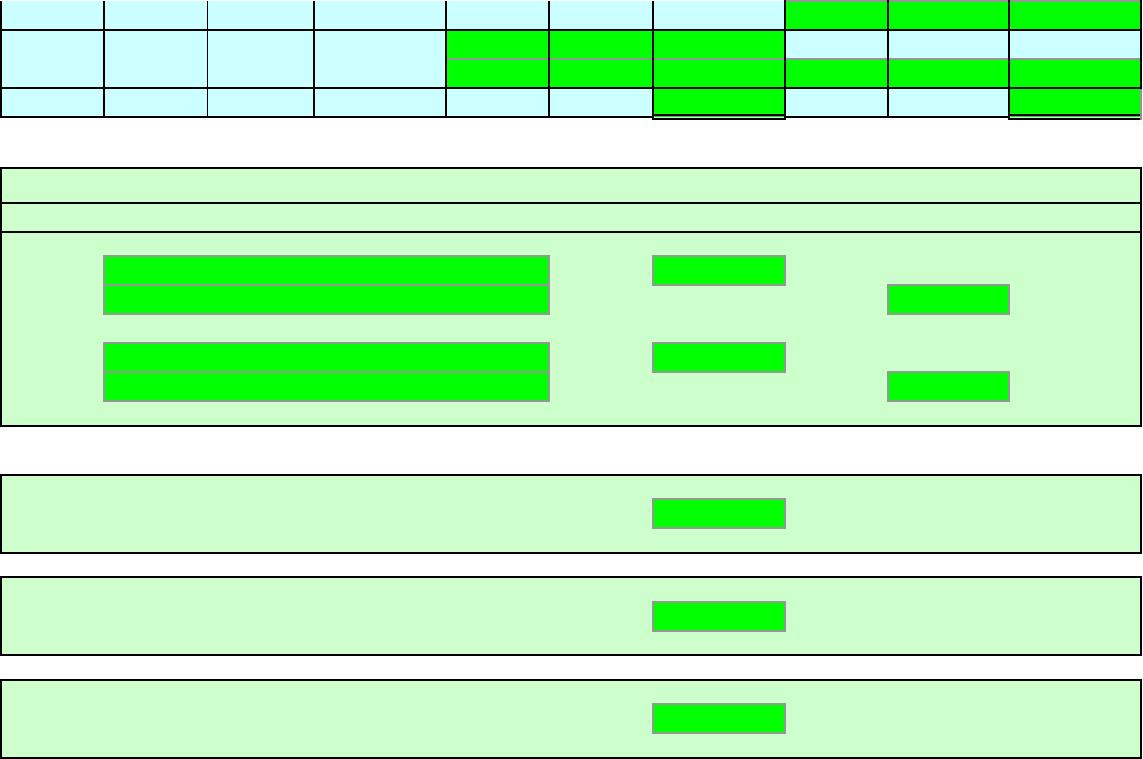
Model A 300 $140 $125
Model B 500 90 112
Model C 150 60 59
Subtotal
Class 1:
Model D 800 120 115
Model E 400 140 145
Subtotal
Total
Product Cost Market LCM
Model A 300 $140 $125
Model B 500 90 112
Model C 150 60 59
Model D 800 120 115
Model E 400 140 145
Total
c.
Cost
per
Unit
Market Value
per Unit (Net
Realizable
Total
Inventory
Quantity
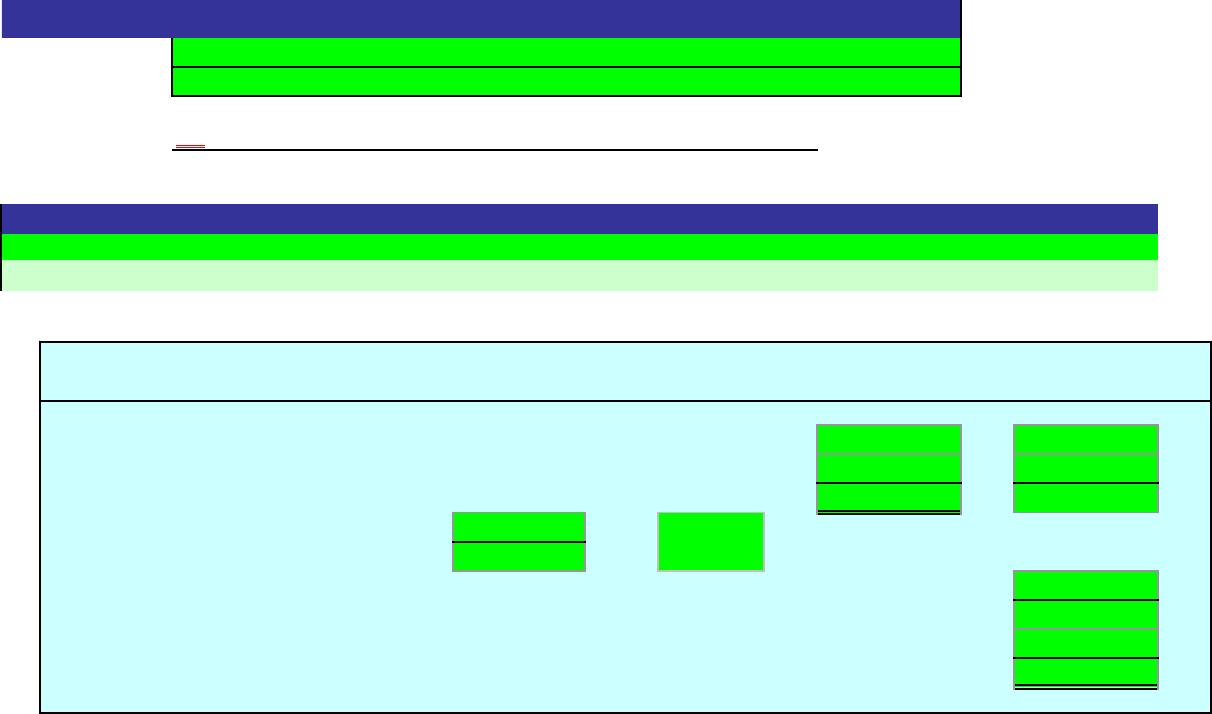
An asterisk (*) will appear to the right of an incorrect entry.
Product Cost Market LCM
Model A 300 $140 $125 42,000$ 37,500$ 37,500$
Model B 500 90 112 45,000 56,000 45,000
Model C 150 60 59 9,000 8,850 8,850
Model D 800 120 115 96,000 92,000 92,000
Model E 400 140 145 56,000 58,000 56,000
Total 248,000$ 252,350$ 239,350$
Product Cost Market LCM
Class 1:
Model A 300 $140 $125 42,000$ 37,500$
Model B 500 90 112 45,000 56,000
Model C 150 60 59 9,000 8,850
Subtotal 96,000$ 102,350$ 96,000$
Class 1:
Model D 800 120 115 96,000$ 92,000$
Cost
Market Value
per Unit (Net
Total
Inventory
Product Cost Market LCM
Model A 300 $140 $125 42,000$ 37,500$
Model B 500 90 112 45,000 56,000
Scoring:
ON
Exercise 6-15
Name:
Solution
Section:
a.
Cost
per
Unit
Market Value
per Unit (Net
Realizable
Value)
Total
Inventory
Quantity
Instructions
Answers are entered in the cells with gray backgrounds.
Cells with non-gray backgrounds are protected and cannot be edited.
Cost
per
Market Value
per Unit (Net
Realizable
Total
Inventory
Unit
Value)
Quantity
Unit
Value)
Quantity

Model C 150 60 59 9,000 8,850
Model D 800 120 115 96,000 92,000
Model E 400 140 145 56,000 58,000
Total 248,000$ 252,350$ 248,000$
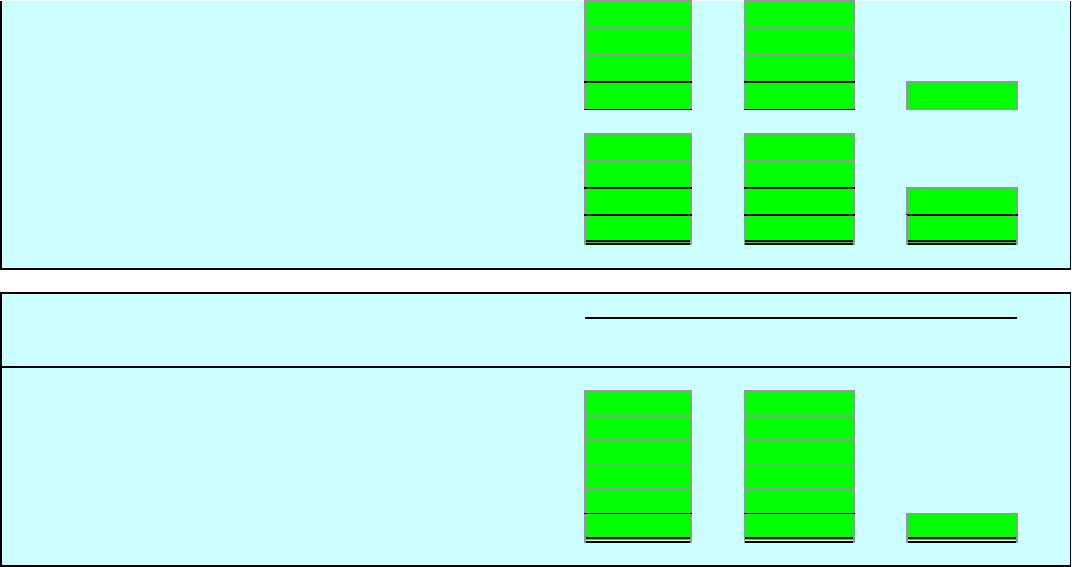
An asterisk (*) will appear to the right of an incorrect entry.
Cost Retail
Inventory, June 1
Purchases in June (net)
Merchandise available for sale
Ratio of cost to retail price: Cost:
Retail:
Sales for June (net)
Inventory, June 30, at retail
Multiply by ratio of cost to retail price
Inventory, June 30, at estimated cost
Answers are entered in the cells with gray backgrounds.
Exercise 6-23
Name:
Section:
Score:
0%
Key Code:
[Key code here]
Instructions
Cells with non-gray backgrounds are protected and cannot be edited.
=
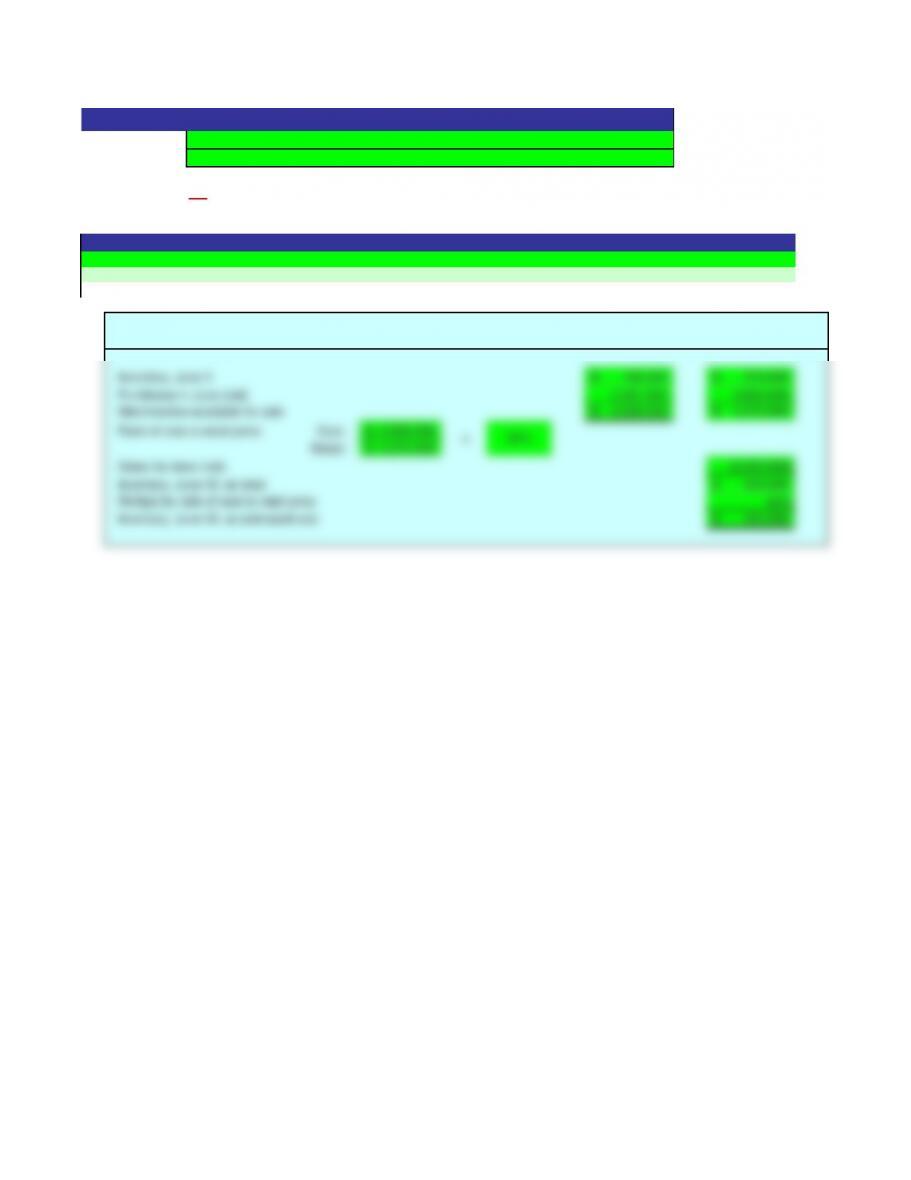
An asterisk (*) will appear to the right of an incorrect entry.
Cost Retail
Inventory, June 1 165,000$ 275,000$
Purchases in June (net)
2,361,500 3,800,000
Merchandise available for sale
2,526,500$ 4,075,000$
Ratio of cost to retail price: Cost: 2,526,500$
Retail: 4,075,000$
Sales for June (net) (3,550,000)
Inventory, June 30, at retail 525,000$
Multiply by ratio of cost to retail price 62%
Inventory, June 30, at estimated cost 325,500$
Exercise 6-23
Name:
Solution
Section:
Scoring:
ON
Instructions
Answers are entered in the cells with gray backgrounds.
Cells with non-gray backgrounds are protected and cannot be edited.
=
62%
An asterisk (*) will appear to the right of an incorrect entry. In part 1, only final inventory cost – Column K – will be graded.
1.
Jan. 1 7,500 $75.00 562,500$
10
28
30
Feb. 5
10
16
28
Mar. 5
14
25
Answers are entered in the cells with gray backgrounds.
Problem 6-1A
Name:
Section:
Score:
0%
Key Code:
[Key code here]
Instructions
Total
Cost
Cells with non-gray backgrounds are protected and cannot be edited.
Date
Purchases
Cost of Goods Sold
Inventory
Quantity
Unit
Cost
Total
Cost
Quantity
Unit
Cost
Total
Cost
Quantity
Unit
Cost
30
31 Balances
2.
Debit Credit
3.
4.
5.
JOURNAL
Description
Ending inventory cost
Inventory under LIFO would be
Gross profit for the sales period
1.
Jan. 1 7,500 $75.00 562,500$
10 22,500 $85.00 $1,912,500 7,500 $75.00 562,500$
22,500 $85.00 1,912,500
28 7,500 $75.00 562,500$
3,750 $85.00 318,750$ 18,750 $85.00 1,593,750$
30 3,750 $85.00 318,750$ 15,000 $85.00 1,275,000$
Feb. 5 1,500 $85.00 127,500$ 13,500 $85.00 1,147,500$
10 54,000 $87.50 $4,725,000 13,500 $85.00 1,147,500$
54,000 $87.50 4,725,000
Accounts Receivable
10,891,875
10,891,875
3.
$8,983,125
4.
$1,010,625
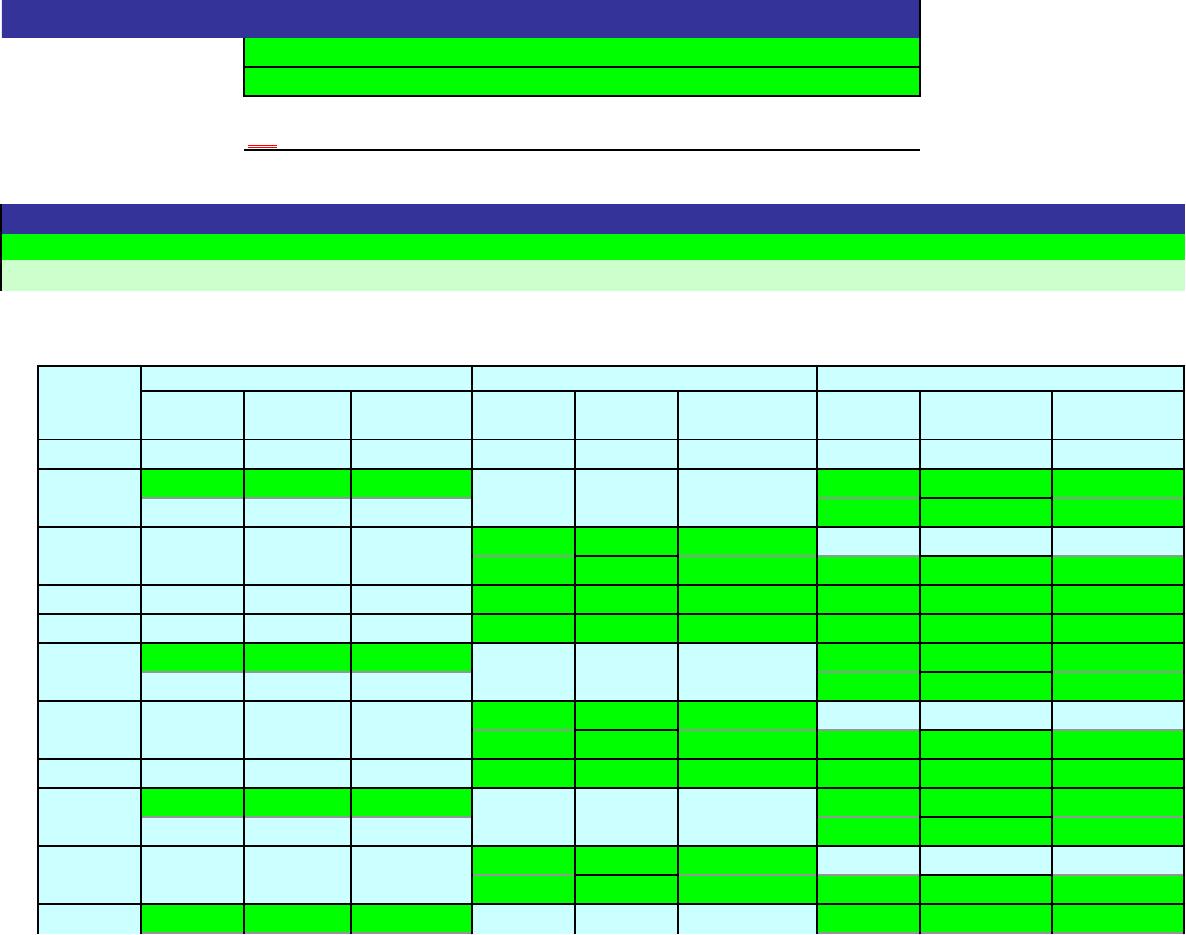
An asterisk (*) will appear to the right of an incorrect entry. In part 1, only final inventory cost – Column K – will be graded.
Problem 6-1A
Name:
Solution
Section:
Scoring:
ON
Instructions
Answers are entered in the cells with gray backgrounds.
Cells with non-gray backgrounds are protected and cannot be edited.
Date
Purchases
Cost of Goods Sold
Inventory
Quantity
Unit
Cost
Total
Cost
Quantity
Unit
Cost
Total
Cost
Quantity
Unit
Cost
Total
Cost
Ending inventory cost
Cost of Goods Sold
Inventory
Gross profit for the sales period

5.
lower
Inventory under LIFO would be
An asterisk (*) will appear to the right of an incorrect entry. In part 1, only final inventory cost – Column K – will be graded.
1.
Apr. 3 25 $1,200 30,000$
8
11
30
May 8
10
19
28
June 5
16
21
Answers are entered in the cells with gray backgrounds.
Problem 6-1B
Name:
Section:
Score:
0%
Key Code:
[Key code here]
Instructions
Total
Cost
Cells with non-gray backgrounds are protected and cannot be edited.
Date
Purchases
Cost of Goods Sold
Inventory
Quantity
Unit
Cost
Total
Cost
Quantity
Unit
Cost
Total
Cost
Quantity
Unit
Cost
28
30 Balances
2.
Debit Credit
3.
4.
5.
JOURNAL
Description
Ending inventory cost
Inventory under LIFO would be
Gross profit for the sales period