CHAPTER 3 The Adjusting Process
3-20
Prob. 3–3B
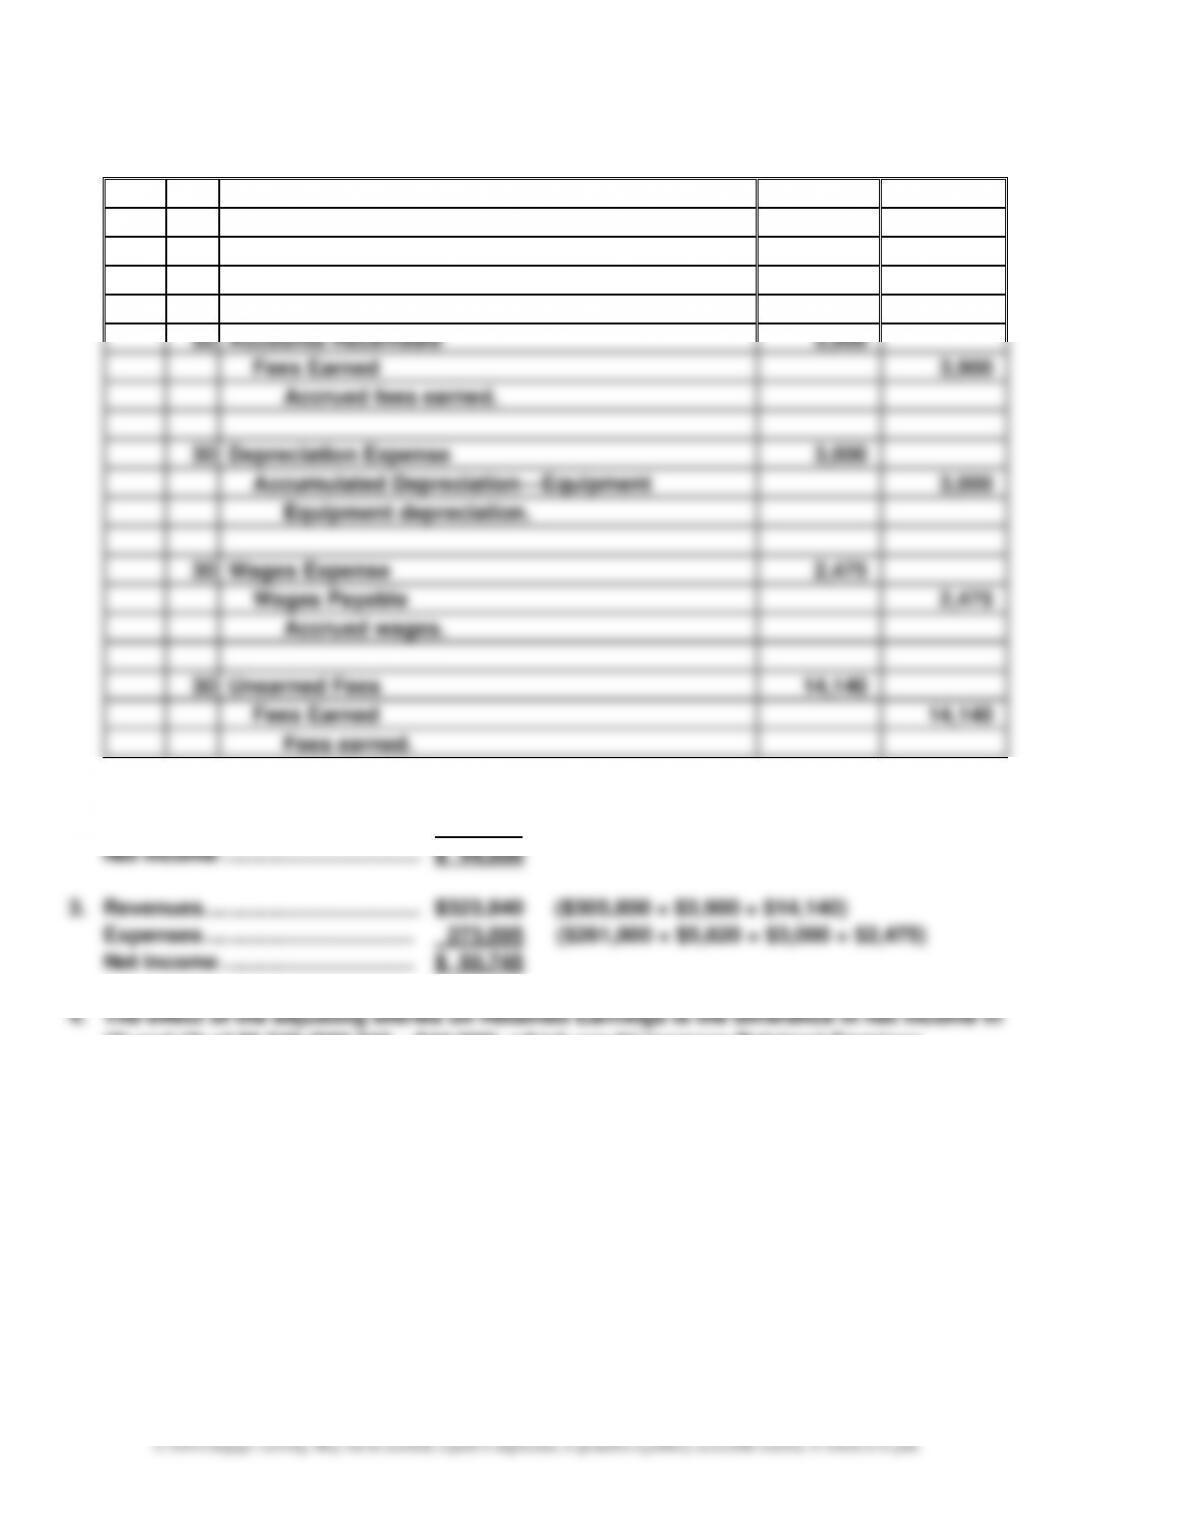
1.
20Y5
Apr.
30
Supplies Expense
5,820
Supplies
5,820
Supplies used ($7,200 – $1,380).
30
Accounts Receivable
3,900
Fees Earned
3,900
Accrued fees earned.
30
Depreciation Expense
3,000
Accumulated Depreciation—Equipment
3,000
Equipment depreciation.
30
Wages Expense
2,475
Wages Payable
2,475
Accrued wages.
30
Unearned Fees
14,140
Fees Earned
14,140
Fees earned.
2. Revenues ……………………………… $305,800
Expenses …………………………………. 261,800 ($157,800 + $55,000 + $42,000 + $7,000)
(3) and (2) of $6,745 ($50,745 – $44,000), which would increase Retained Earnings.
CHAPTER 3 The Adjusting Process
3-21
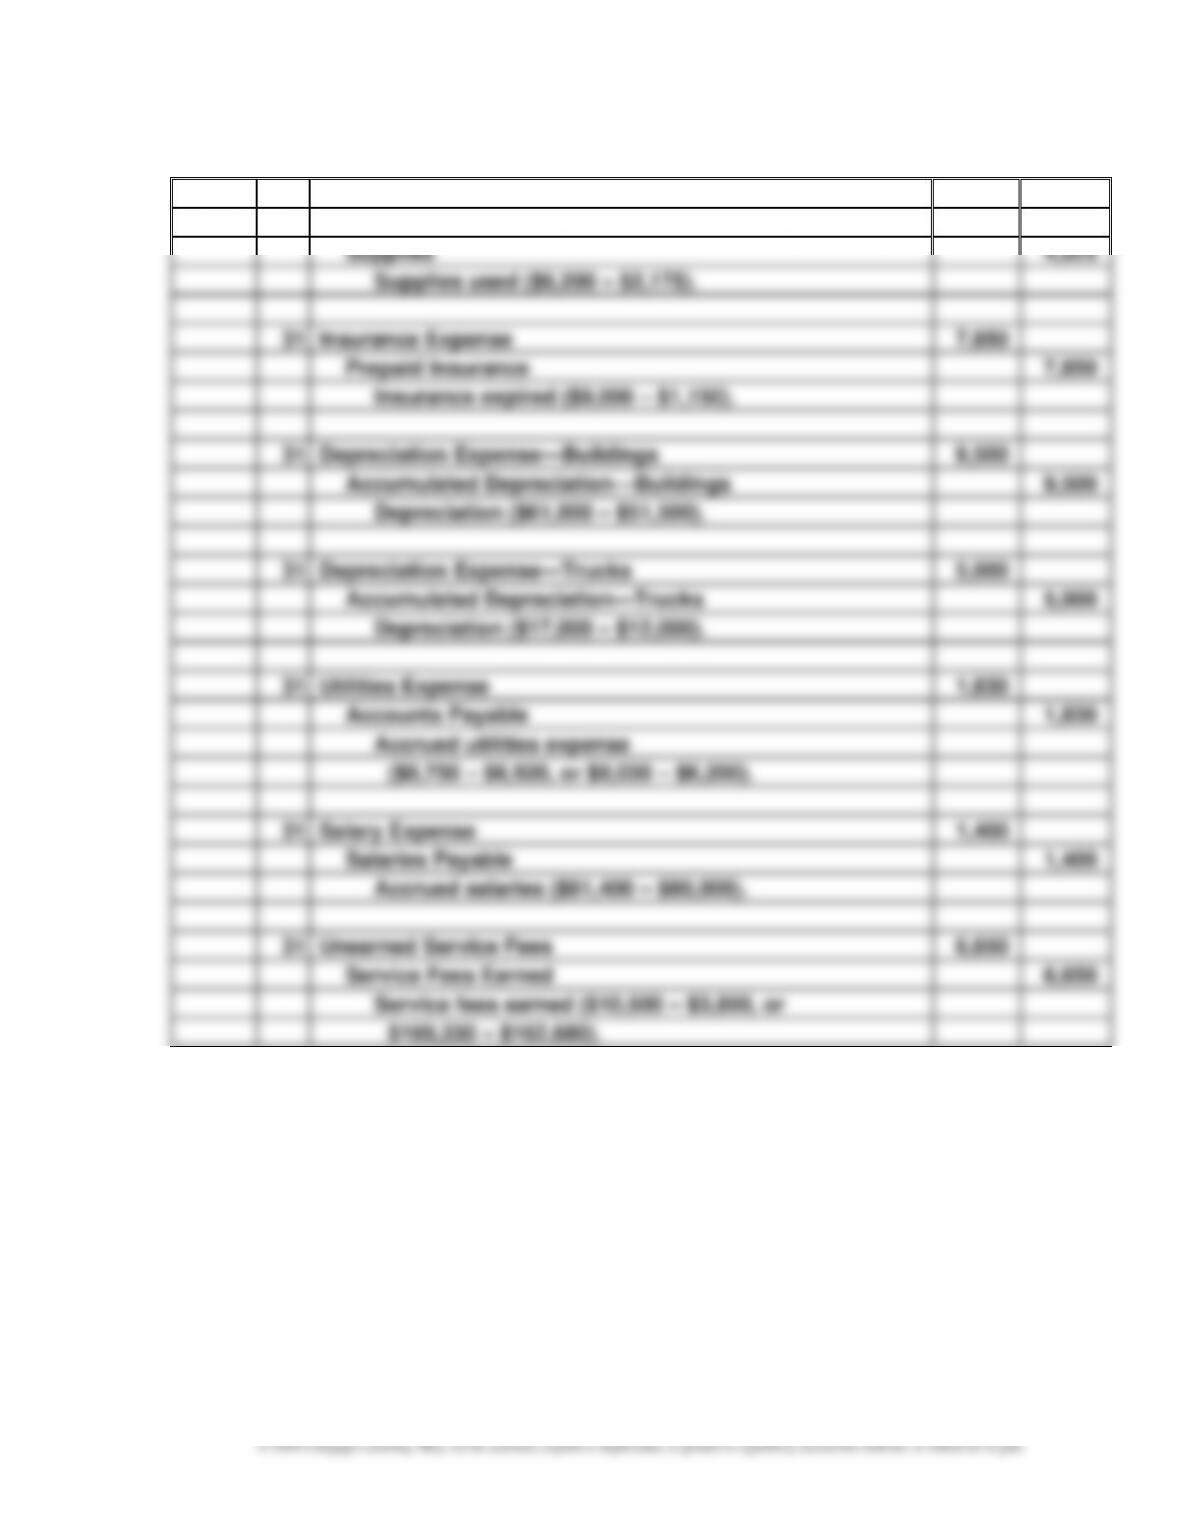
Prob. 3–4B
20Y6
Mar.
31
Supplies Expense
4,025
Supplies
4,025
Supplies used ($6,200 – $2,175).
31
Insurance Expense
7,850
Prepaid Insurance
7,850
Insurance expired ($9,000 – $1,150).
31
Depreciation Expense—Buildings
9,500
Accumulated Depreciation—Buildings
9,500
Depreciation ($61,000 – $51,500).
31
Depreciation Expense—Trucks
5,000
Accumulated Depreciation—Trucks
5,000
Depreciation ($17,000 – $12,000).
31
Utilities Expense
1,830
Accounts Payable
1,830
Accrued utilities expense
($8,750 – $6,920, or $8,030 – $6,200).
31
Salary Expense
1,400
Salaries Payable
1,400
Accrued salaries ($81,400 – $80,000).
31
Unearned Service Fees
6,650
Service Fees Earned
6,650
Service fees earned ($10,500 – $3,850, or
$169,330 – $162,680).
CHAPTER 3 The Adjusting Process
3-22
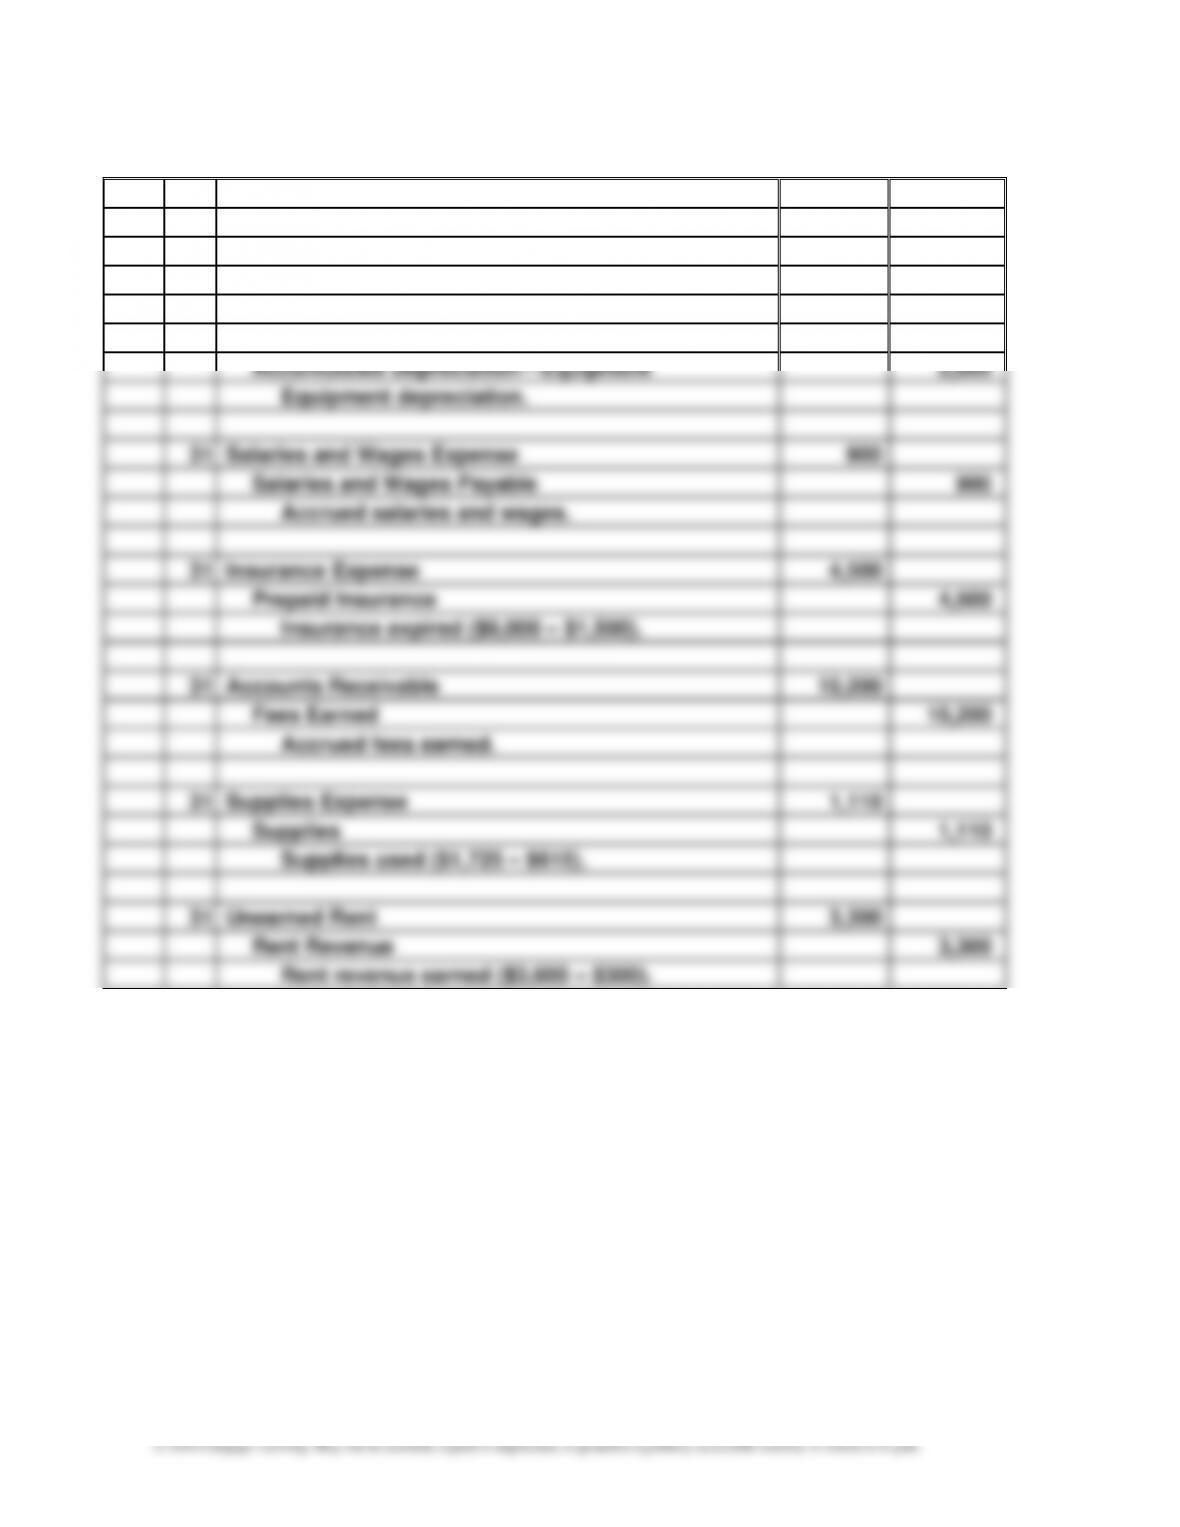
Prob. 3–5B
1.
20Y9
July
31
Depreciation Expense—Building
6,400
Accumulated Depreciation—Building
6,400
Building depreciation.
31
Depreciation Expense—Equipment
2,800
Accumulated Depreciation—Equipment
2,800
Equipment depreciation.
31
Salaries and Wages Expense
900
Salaries and Wages Payable
900
Accrued salaries and wages.
31
Insurance Expense
4,500
Prepaid Insurance
4,500
Insurance expired ($6,000 – $1,500).
31
Accounts Receivable
10,200
Fees Earned
10,200
Accrued fees earned.
31
Supplies Expense
1,110
Supplies
1,110
Supplies used ($1,725 – $615).
31
Unearned Rent
3,300
Rent Revenue
3,300
Rent revenue earned ($3,600 – $300).
CHAPTER 3 The Adjusting Process
3-23
Prob. 3–5B (Concluded)
2.
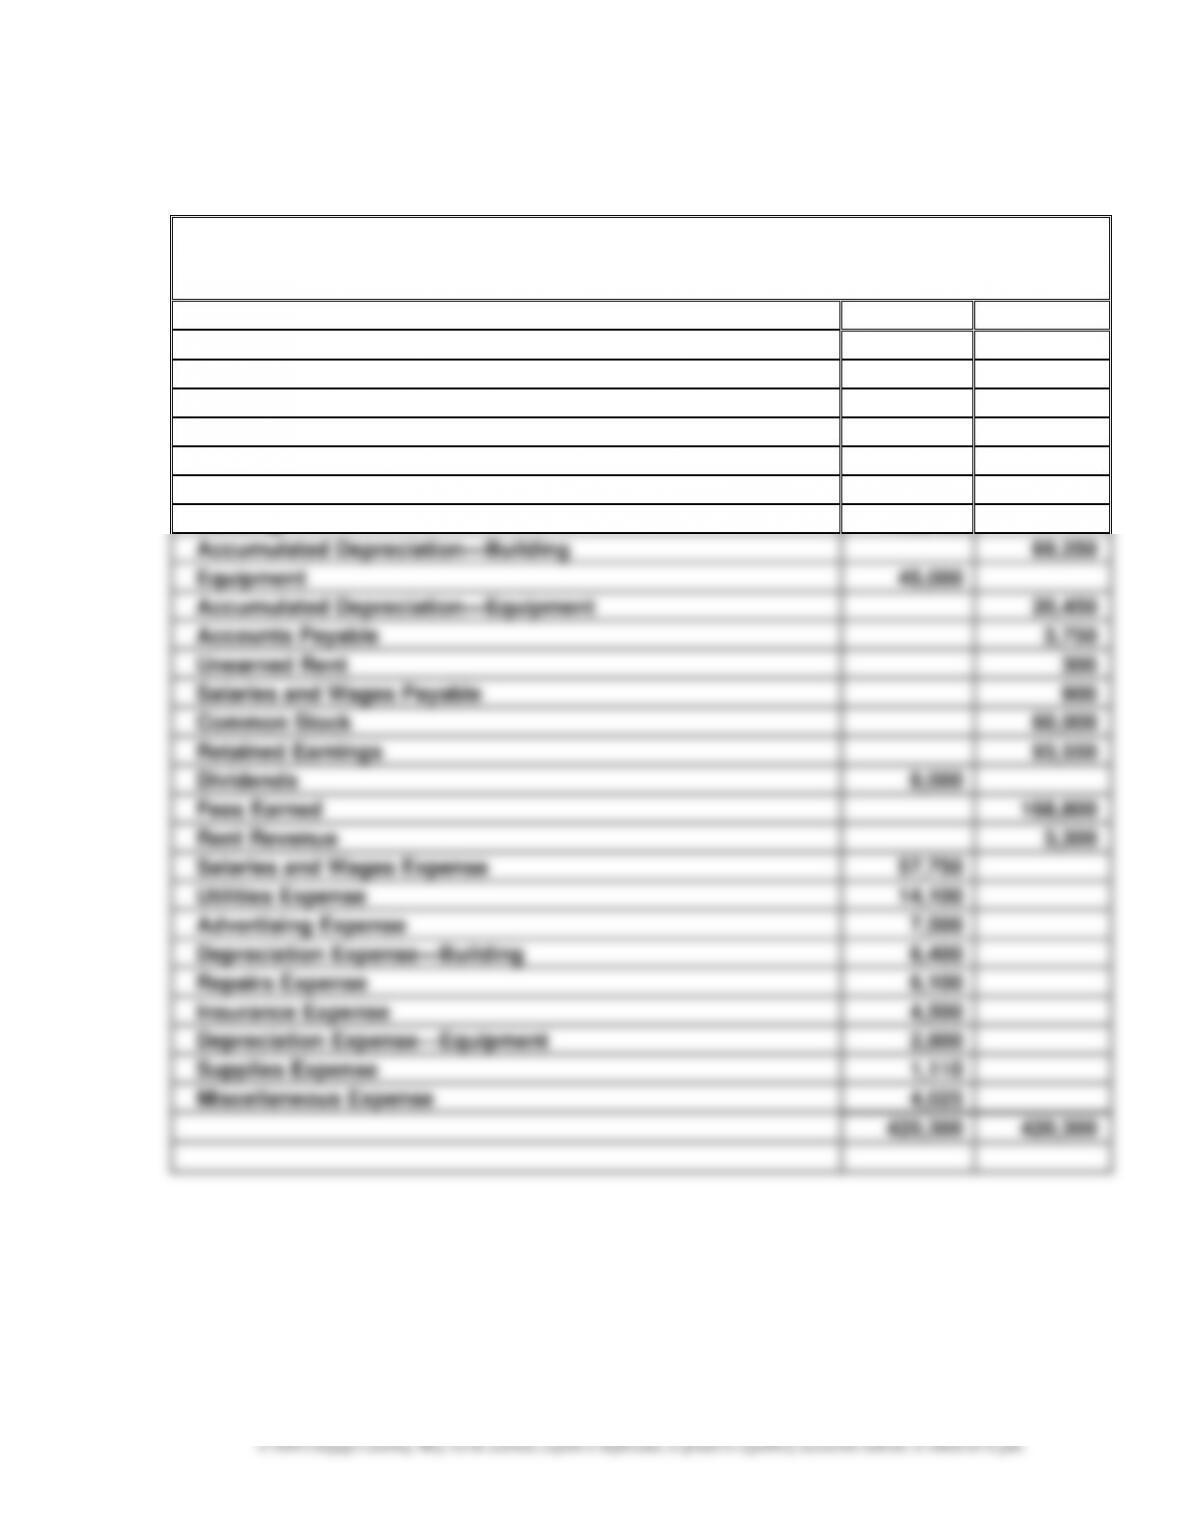
Reece Financial Services Co.
Adjusted Trial Balance
July 31, 20Y9
Debit
Credit
Balances
Balances
Cash
10,200
Accounts Receivable
44,950
Prepaid Insurance
1,500
Supplies
615
Land
50,000
Building
155,750
Accumulated Depreciation—Building
69,250
Equipment
45,000
Accumulated Depreciation—Equipment
20,450
Accounts Payable
3,750
Unearned Rent
300
Salaries and Wages Payable
900
Common Stock
60,000
Retained Earnings
93,550
Dividends
8,000
Fees Earned
168,800
Rent Revenue
3,300
Salaries and Wages Expense
57,750
Utilities Expense
14,100
Advertising Expense
7,500
Depreciation Expense—Building
6,400
Repairs Expense
6,100
Insurance Expense
4,500
Depreciation Expense—Equipment
2,800
Supplies Expense
1,110
Miscellaneous Expense
4,025
420,300
420,300
CHAPTER 3 The Adjusting Process
3-24
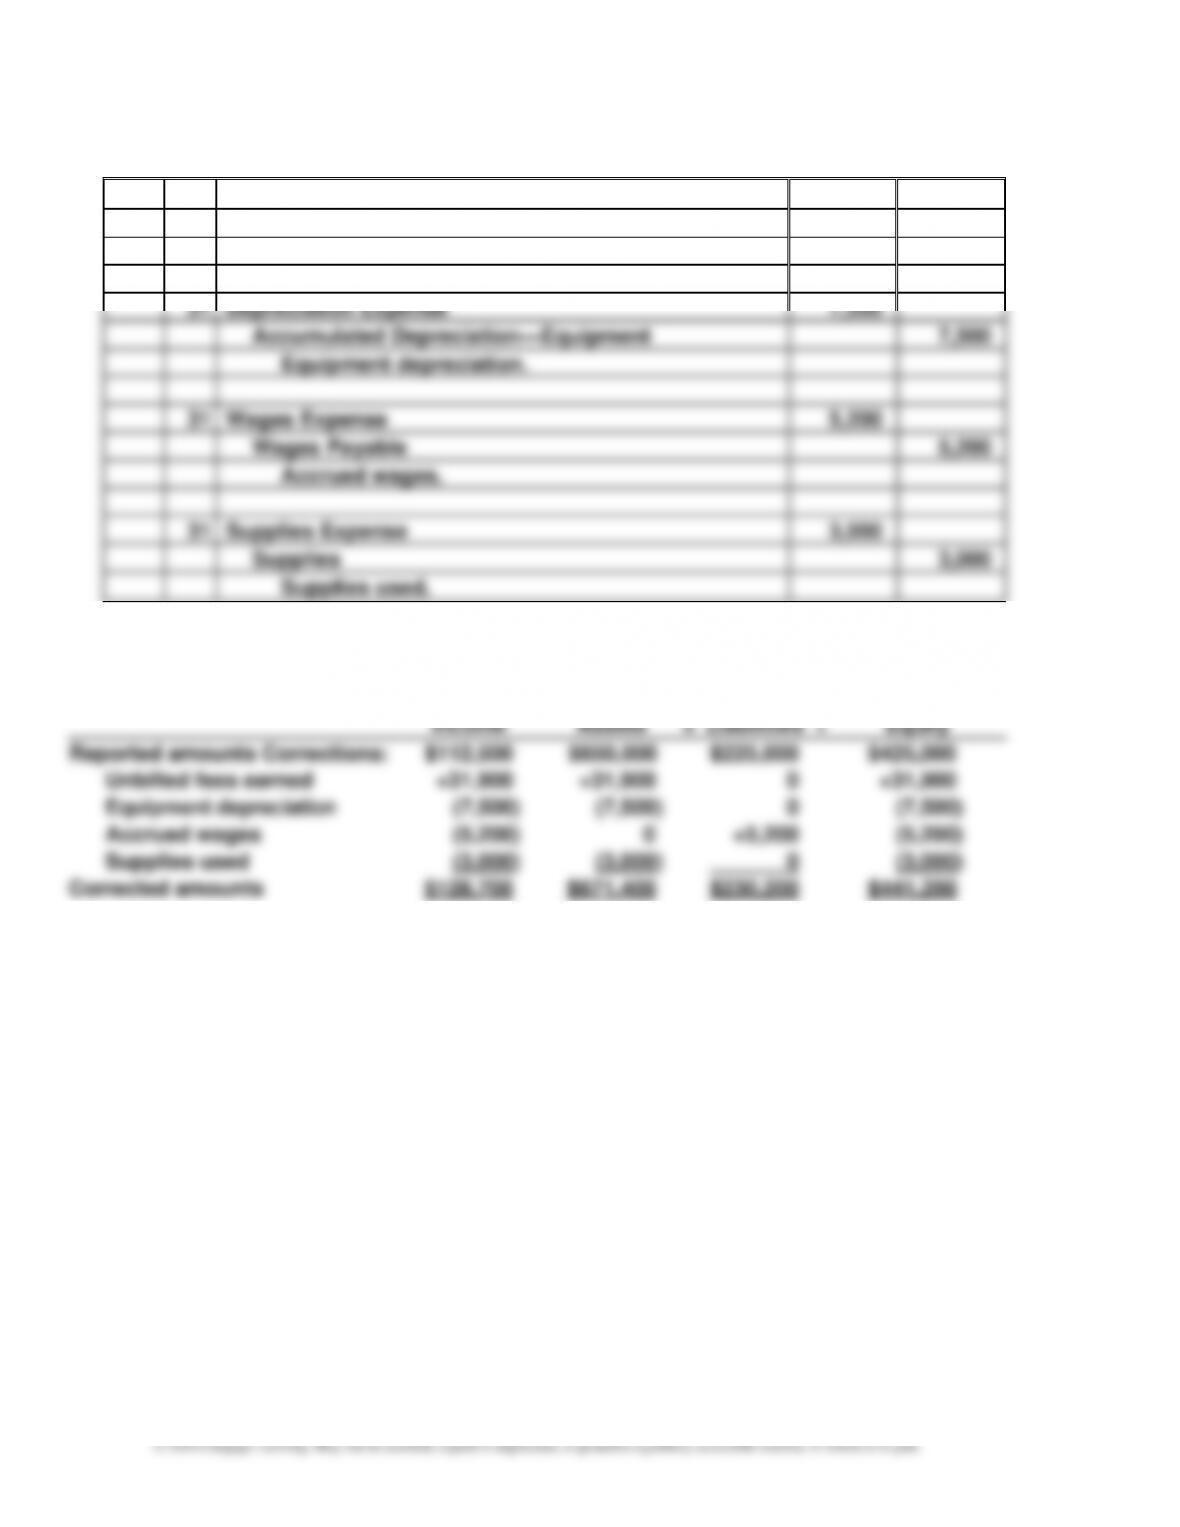
Prob. 3–6B
1.
Aug.
31
Accounts Receivable
31,900
Fees Earned
31,900
Accrued fees earned.
31
Depreciation Expense
7,500
Accumulated Depreciation—Equipment
7,500
Equipment depreciation.
31
Wages Expense
5,200
Wages Payable
5,200
Accrued wages.
31
Supplies Expense
3,000
Supplies
3,000
Supplies used.
2.
Net
Income
Total
Assets
=
Total
Liabilities
+
Total
Stockholders’
Equity
Reported amounts Corrections:
$112,500
$650,000
$225,000
$425,000
Unbilled fees earned
+31,900
+31,900
0
+31,900
Equipment depreciation
(7,500)
(7,500)
0
(7,500)
Accrued wages
(5,200)
0
+5,200
(5,200)
Supplies used
(3,000)
(3,000)
0
(3,000)
Corrected amounts
$128,700
$671,400
$230,200
$441,200
CHAPTER 3 The Adjusting Process
3-25
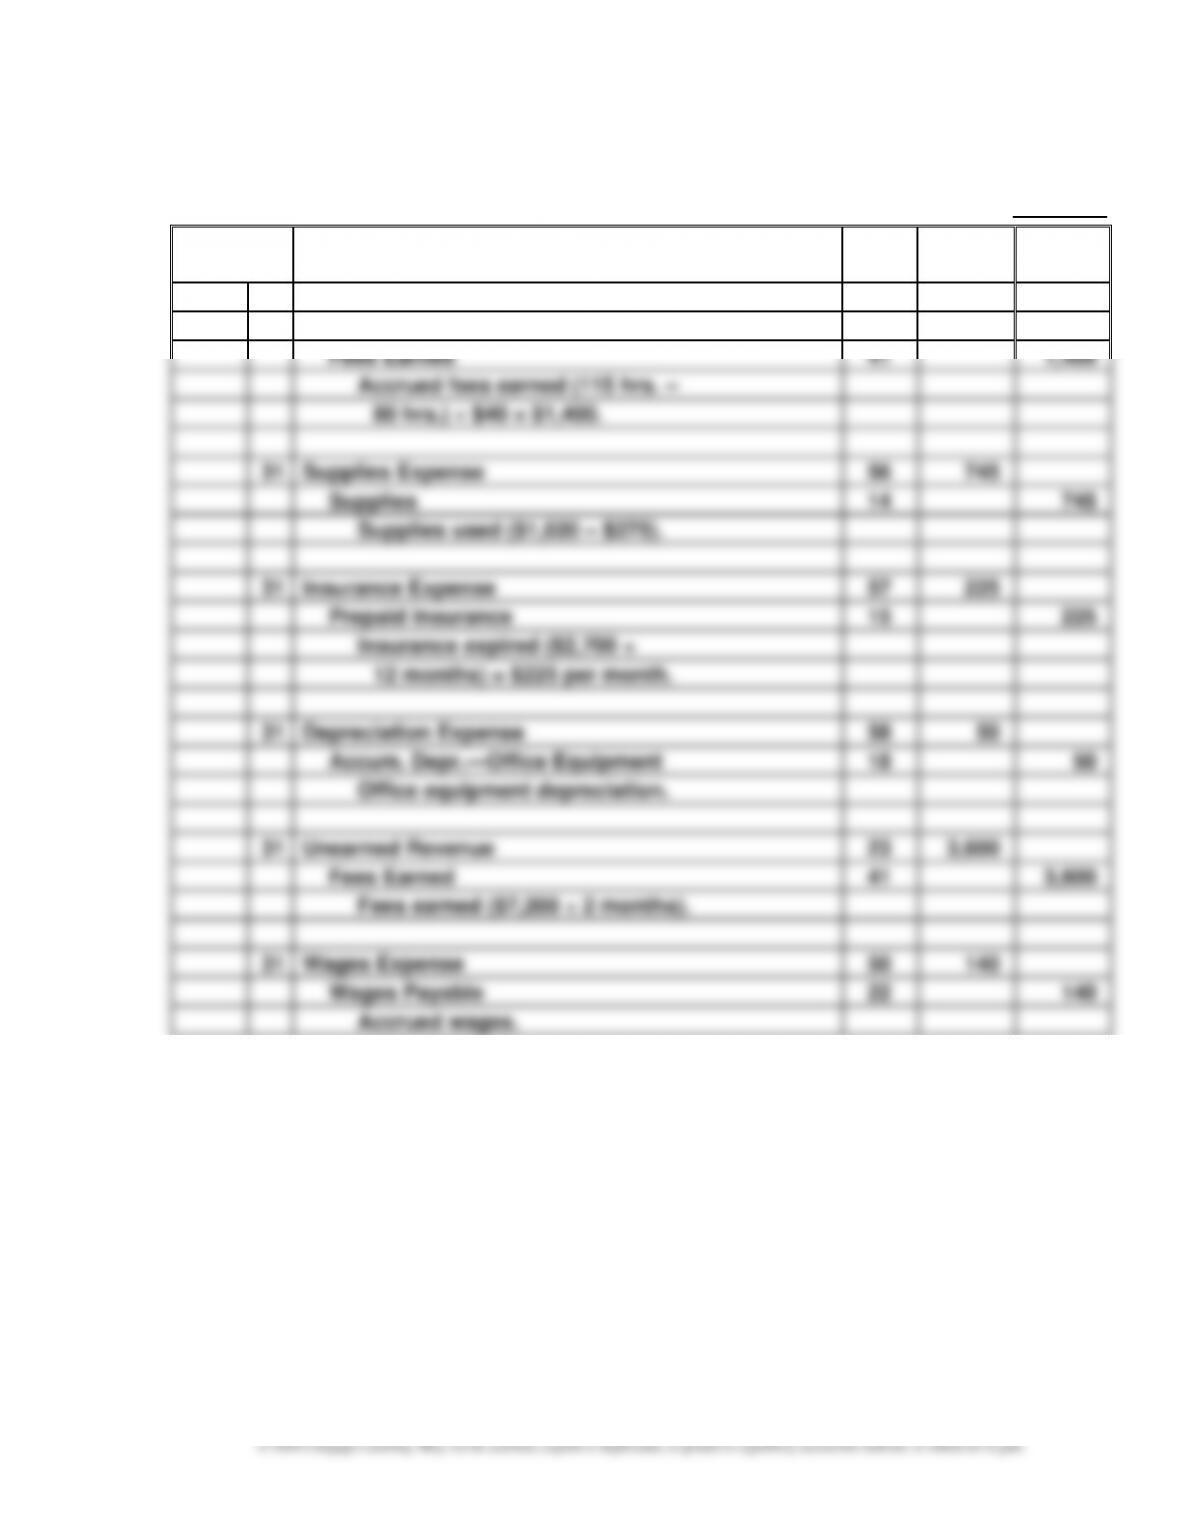
CONTINUING PROBLEM
1. JOURNAL Page 3
Date
Description
Post.
Ref.
Debit
Credit
20Y5
Adjusting Entries
July
31
Accounts Receivable
12
1,400
Fees Earned
41
1,400
Accrued fees earned (115 hrs. –
80 hrs.) $40 = $1,400.
31
Supplies Expense
56
745
Supplies
14
745
Supplies used ($1,020 – $275).
31
Insurance Expense
57
225
Prepaid Insurance
15
225
Insurance expired ($2,700 ÷
12 months) = $225 per month.
31
Depreciation Expense
58
50
Accum. Depr.—Office Equipment
18
50
Office equipment depreciation.
31
Unearned Revenue
23
3,600
Fees Earned
41
3,600
Fees earned ($7,200 ÷ 2 months).
31
Wages Expense
50
140
Wages Payable
22
140
Accrued wages.
CHAPTER 3 The Adjusting Process
3-26
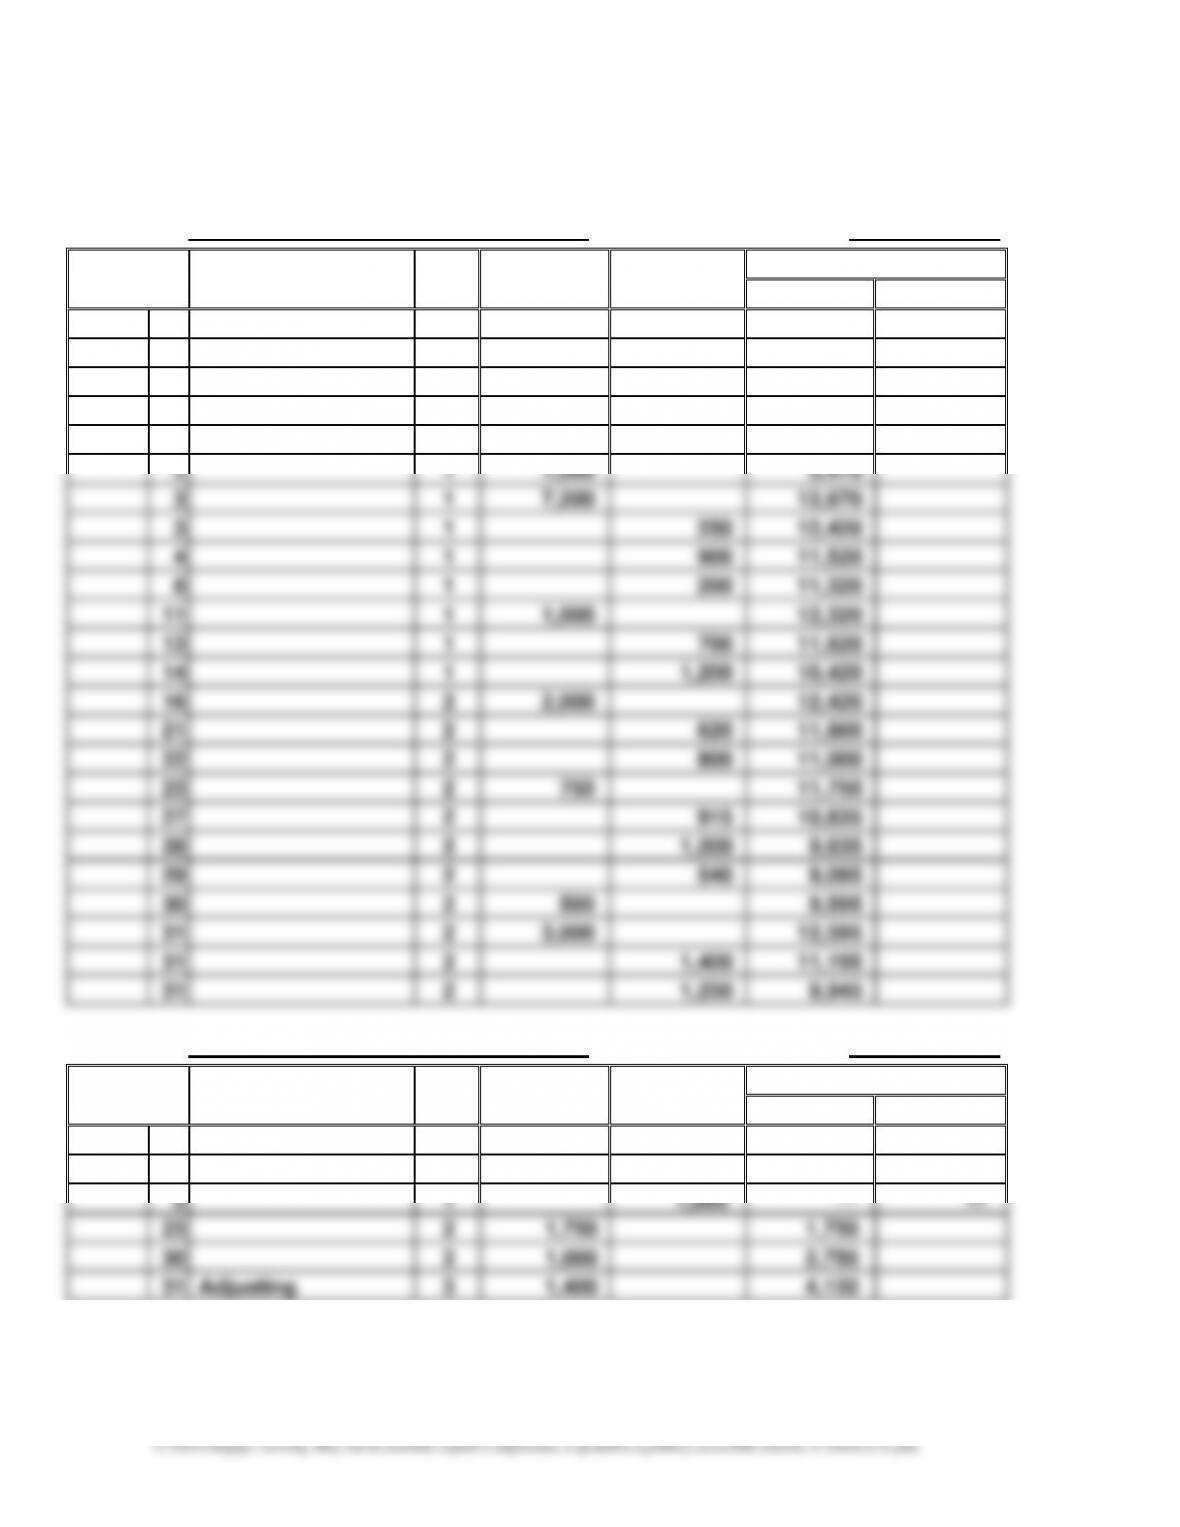
Continuing Problem (Continued)
2.
Account: Cash Account No. 11
Date
Item
Post.
Ref.
Debit
Balance
Credit
Debit
Credit
20Y5
July
1
Balance
✓
3,920
1
1
5,000
8,920
1
1
1,750
7,170
1
1
2,700
4,470
2
1
1,000
5,470
3
1
7,200
12,670
3
1
250
12,420
4
1
900
11,520
8
1
200
11,320
11
1
1,000
12,320
13
1
700
11,620
14
1
1,200
10,420
16
2
2,000
12,420
21
2
620
11,800
22
2
800
11,000
23
2
750
11,750
27
2
915
10,835
28
2
1,200
9,635
29
2
540
9,095
30
2
500
9,595
31
2
3,000
12,595
31
2
1,400
11,195
31
2
1,250
9,945
Account: Accounts Receivable Account No. 12
Date
Item
Post.
Ref.
Debit
Balance
Credit
Debit
Credit
20Y5
July
1
Balance
✓
1,000
2
1
1,000
—
—
23
2
1,750
1,750
30
2
1,000
2,750
31
Adjusting
3
1,400
4,150
CHAPTER 3 The Adjusting Process
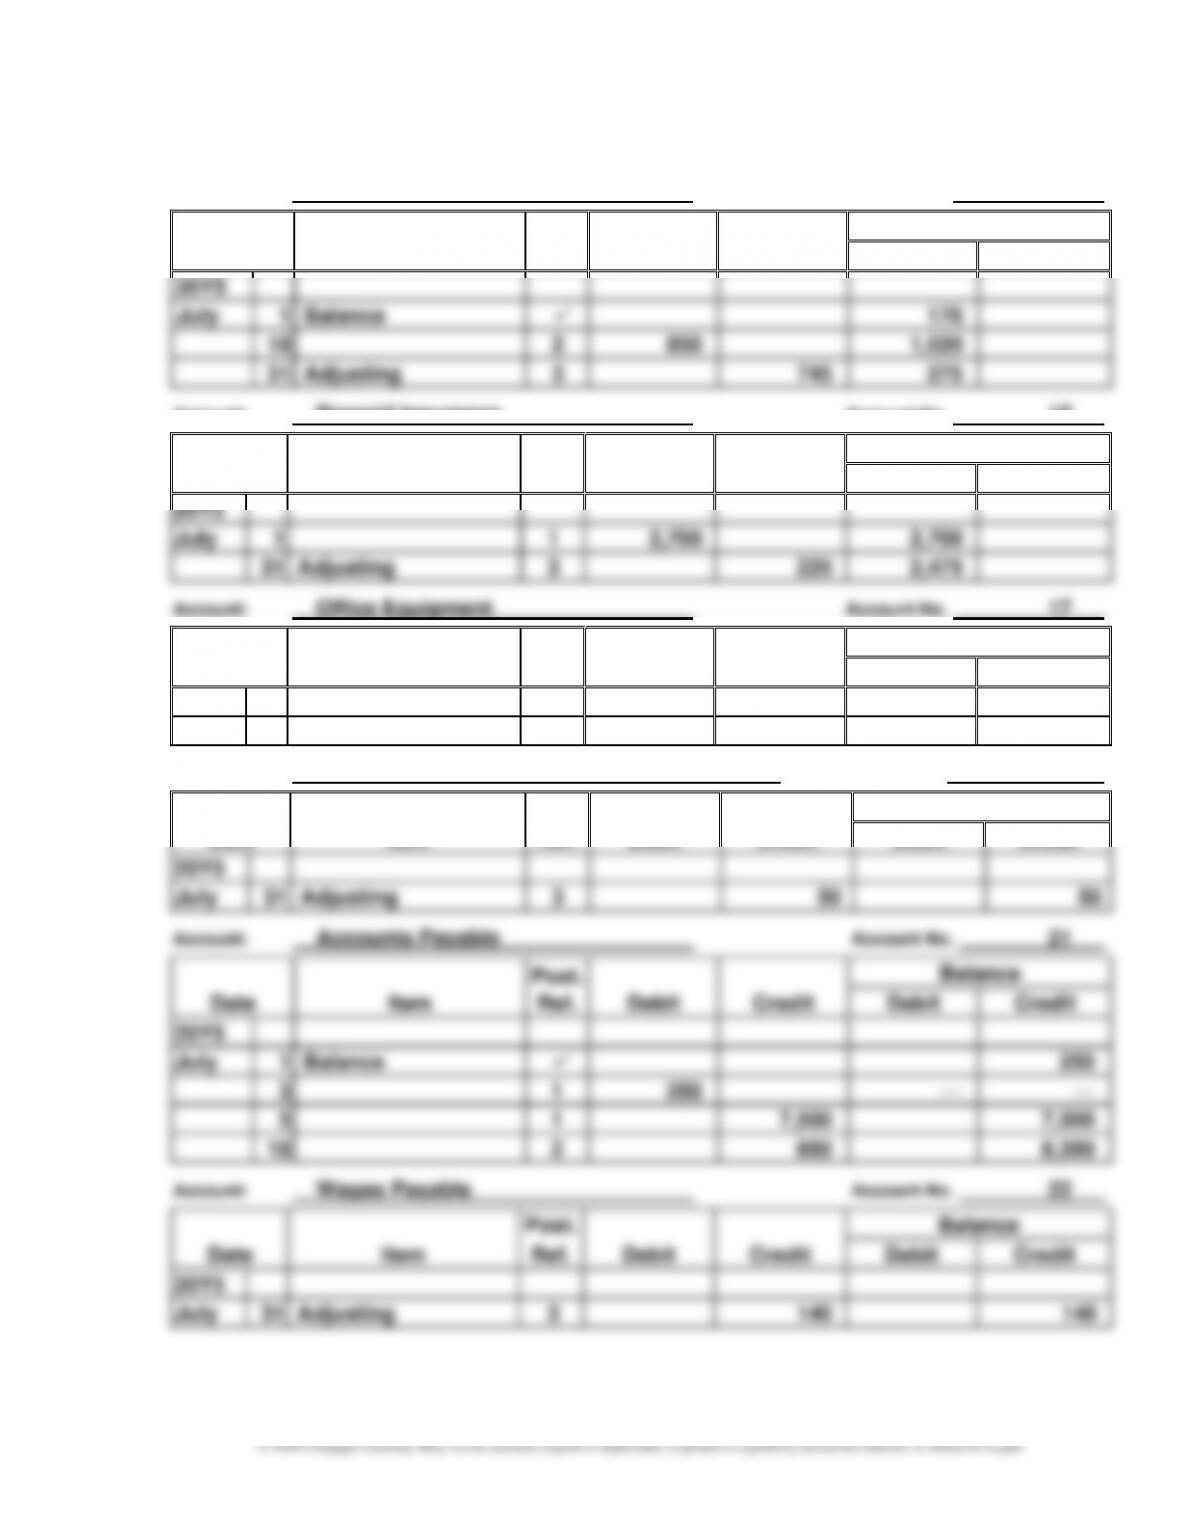
Continuing Problem (Continued)
Account: Supplies Account No. 14
Date
Item
Post.
Ref.
Debit
Credit
Balance
Debit
Credit
20Y5
July
1
Balance
✓
170
18
2
850
1,020
31
Adjusting
3
745
275
Account: Prepaid Insurance Account No. 15
Post.
Balance
Date
Item
Ref.
Debit
Credit
Debit
Credit
20Y5
July
1
1
2,700
2,700
31
Adjusting
3
225
2,475
Post.
Balance
Date
Item
Ref.
Debit
Credit
Debit
Credit
20Y5
July
5
1
7,500
7,500
Account: Accumulated Depreciation—Office Equipment Account No. 18
Post.
Balance
Date
Item
Ref.
Debit
Credit
Debit
Credit
20Y5
July
31
Adjusting
3
50
50
Account: Accounts Payable Account No. 21
Date
Item
Post.
Ref.
Debit
Credit
Balance
Debit
Credit
20Y5
July
1
Balance
✓
250
3
1
250
—
—
5
1
7,500
7,500
18
2
850
8,350
Post.
Balance
Date
Item
Ref.
Debit
Credit
Debit
Credit
20Y5
July
31
Adjusting
3
CHAPTER 3 The Adjusting Process
3-28
Continuing Problem (Continued)
Account: Unearned Revenue Account No. 23
Post.
Balance
Date
Item
Ref.
Debit
Credit
Debit
Credit
20Y5
July
3
1
7,200
7,200
31
Adjusting
3
3,600
3,600
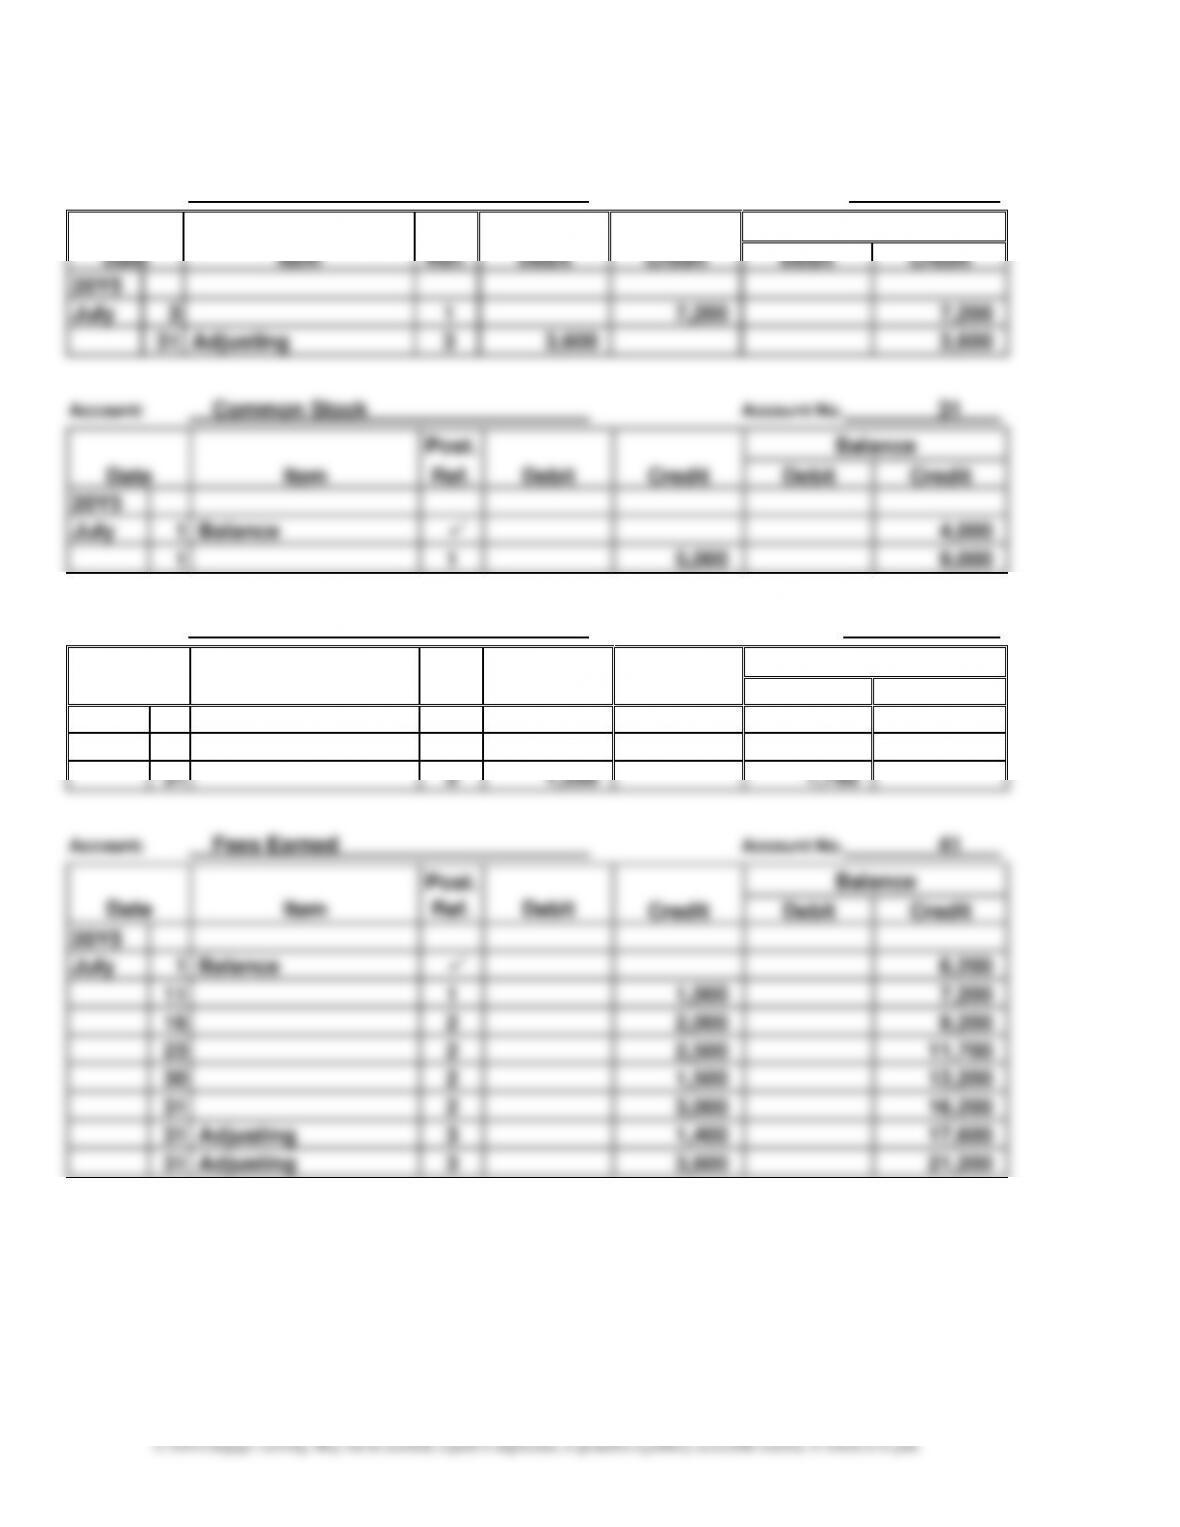
Account: Common Stock Account No. 31
Post.
Balance
Date
Item
Ref.
Debit
Credit
Debit
Credit
20Y5
July
1
Balance
✓
4,000
1
1
5,000
9,000
Account: Dividends Account No. 33
Post.
Balance
Date
Item
Ref.
Debit
Credit
Debit
Credit
20Y5
July
1
Balance
✓
500
31
2
1,250
1,750
Account: Fees Earned Account No. 41
Date
Item
Post.
Ref.
Debit
Balance
Credit
Debit
Credit
20Y5
July
1
Balance
✓
6,200
11
1
1,000
7,200
16
2
2,000
9,200
23
2
2,500
11,700
30
2
1,500
13,200
31
2
3,000
16,200
31
Adjusting
3
1,400
17,600
31
Adjusting
3
3,600
21,200
CHAPTER 3 The Adjusting Process
Continuing Problem (Continued)
Account: Wages Expense Account No. 50
Date
Item
Post.
Ref.
Debit
Credit
Balance
Debit
Credit
20Y5
July
1
Balance
✓
400
14
1
1,200
1,600
28
2
1,200
2,800
31
Adjusting
3
140
2,940
Balance
1
Balance
800
Balance
13
700
1,375
Balance
Date
Item
Post.
Ref.
Debit
Credit
Balance
July
1
Balance
1,590
31
1,400
3,610
CHAPTER 3 The Adjusting Process
Continuing Problem (Continued)
Account: Advertising Expense Account No. 55
Date
Item
Post.
Ref.
Debit
Credit
Balance
Debit
Credit
20Y5
July
1
Balance
✓
500
8
1
200
700
22
2
800
1,500
Post.
Balance
Date
Item
Ref.
Debit
Credit
Debit
Credit
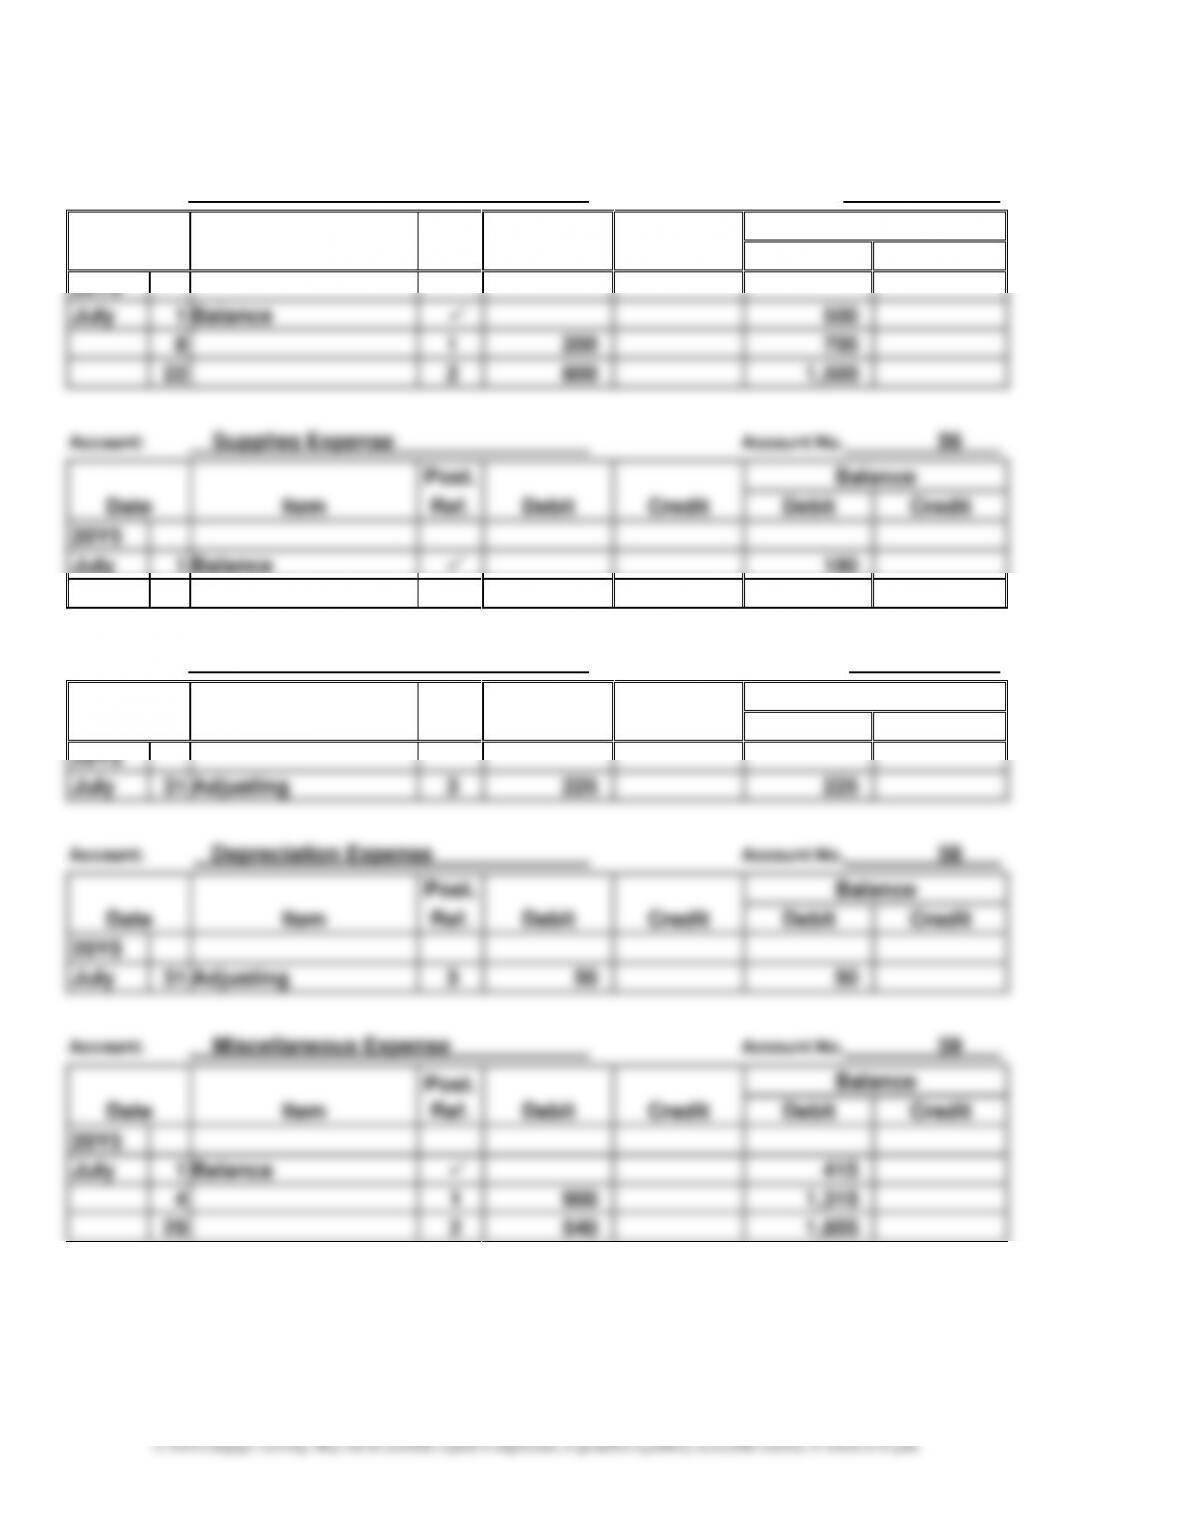
20Y5
July
1
Balance
✓
180
31
Adjusting
3
745
925
Account: Insurance Expense Account No. 57
Post.
Balance
Date
Item
Ref.
Debit
Credit
Debit
Credit
20Y5
July
31
Adjusting
3
225
225
Account: Depreciation Expense Account No. 58
Post.
Balance
Date
Item
Ref.
Debit
Credit
Debit
Credit
20Y5
July
31
Adjusting
3
50
50
Balance
20Y5
July
1
Balance
✓
415
4
900
1,315
29
540
1,855
CHAPTER 3 The Adjusting Process
3-31
Continuing Problem (Concluded)
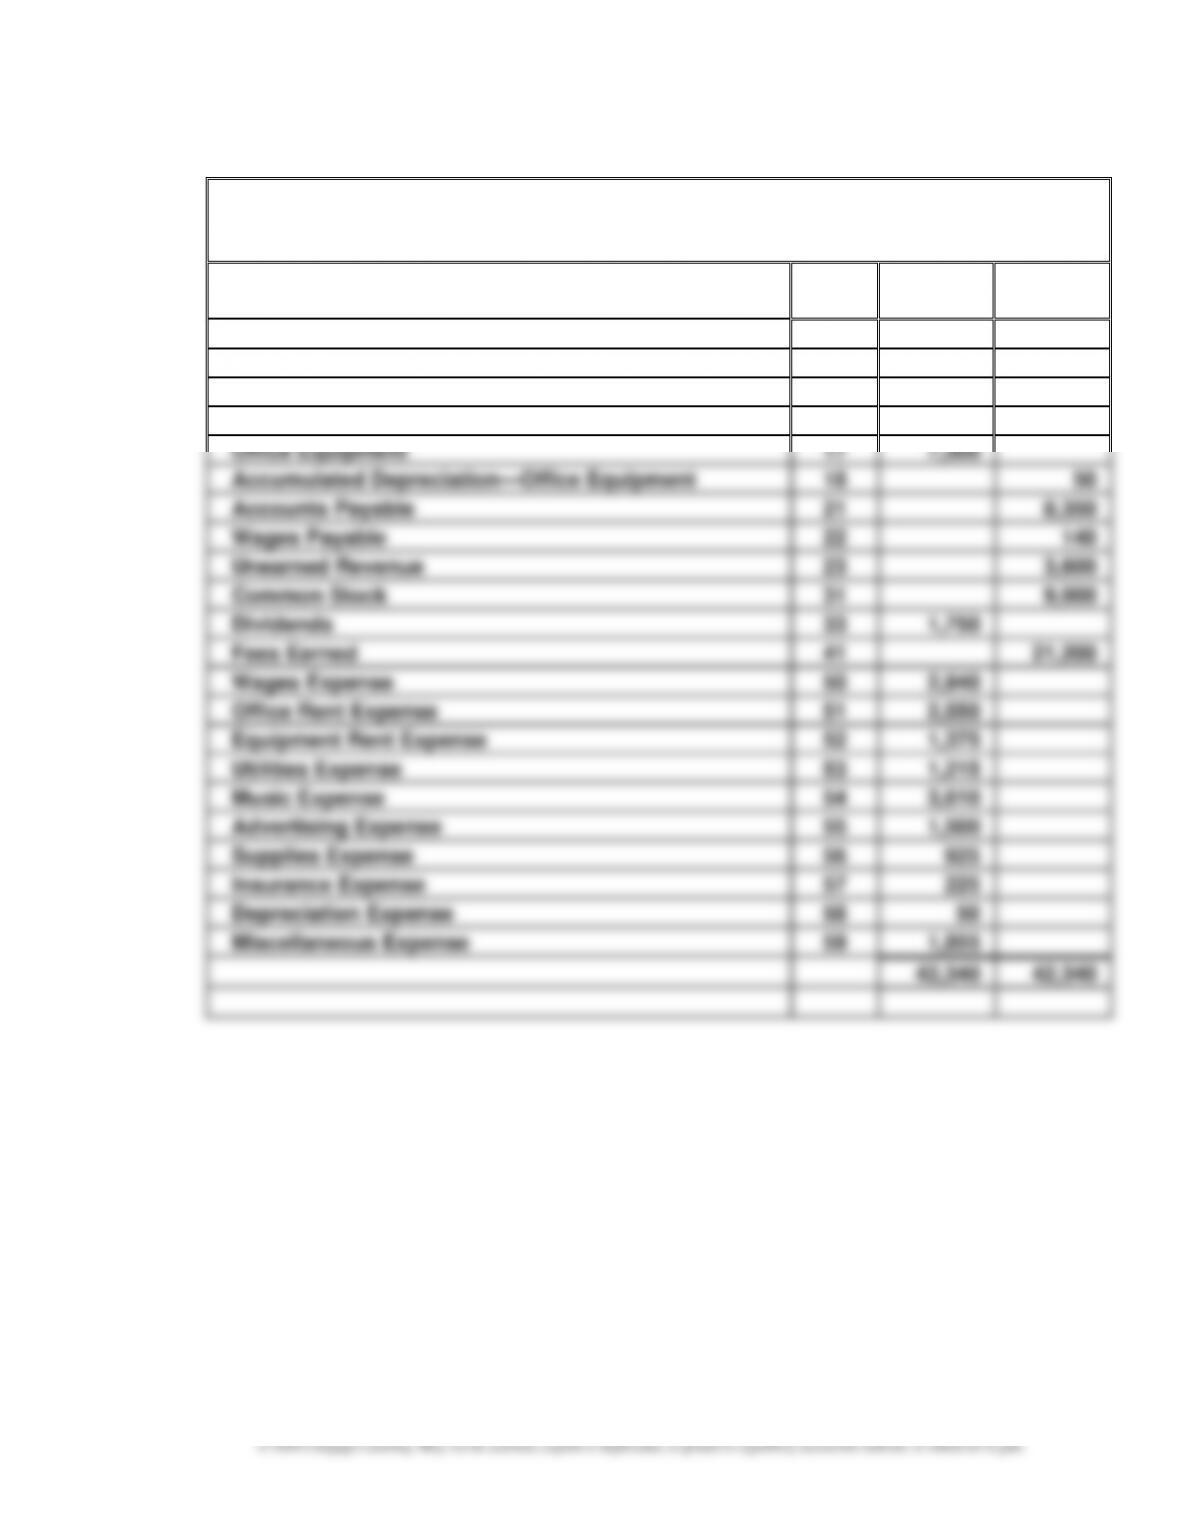
3.
PS Music
Adjusted Trial Balance
July 31, 20Y5
Account
Debit
Credit
No.
Balances
Balances
Cash
11
9,945
Accounts Receivable
12
4,150
Supplies
14
275
Prepaid Insurance
15
2,475
Office Equipment
17
7,500
Accumulated Depreciation—Office Equipment
18
50
Accounts Payable
21
8,350
Wages Payable
22
140
Unearned Revenue
23
3,600
Common Stock
31
9,000
Dividends
33
1,750
Fees Earned
41
21,200
Wages Expense
50
2,940
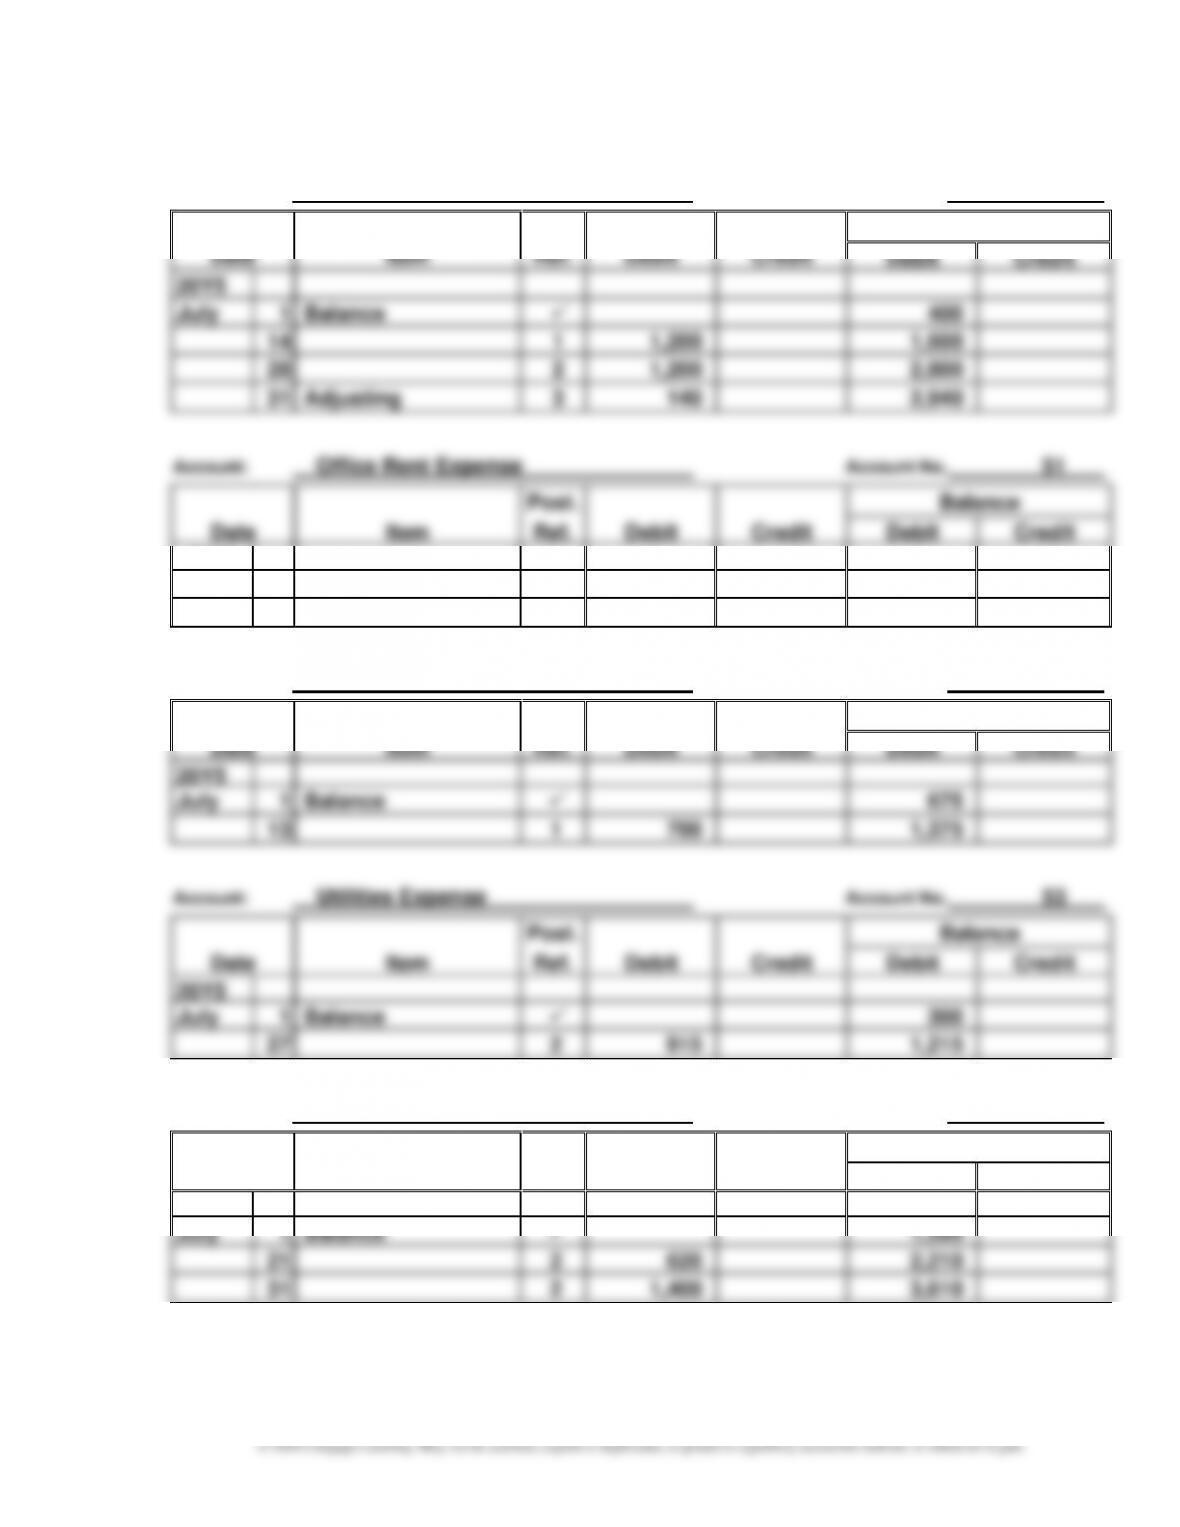
Office Rent Expense
51
2,550
Equipment Rent Expense
52
1,375
Utilities Expense
53
1,215
Music Expense
54
3,610
Advertising Expense
55
1,500
Supplies Expense
56
925
Insurance Expense
57
225
Depreciation Expense
58
50
Miscellaneous Expense
59
1,855
42,340
42,340
CHAPTER 3 The Adjusting Process
MAKE A DECISION
MAD 3–1
a.
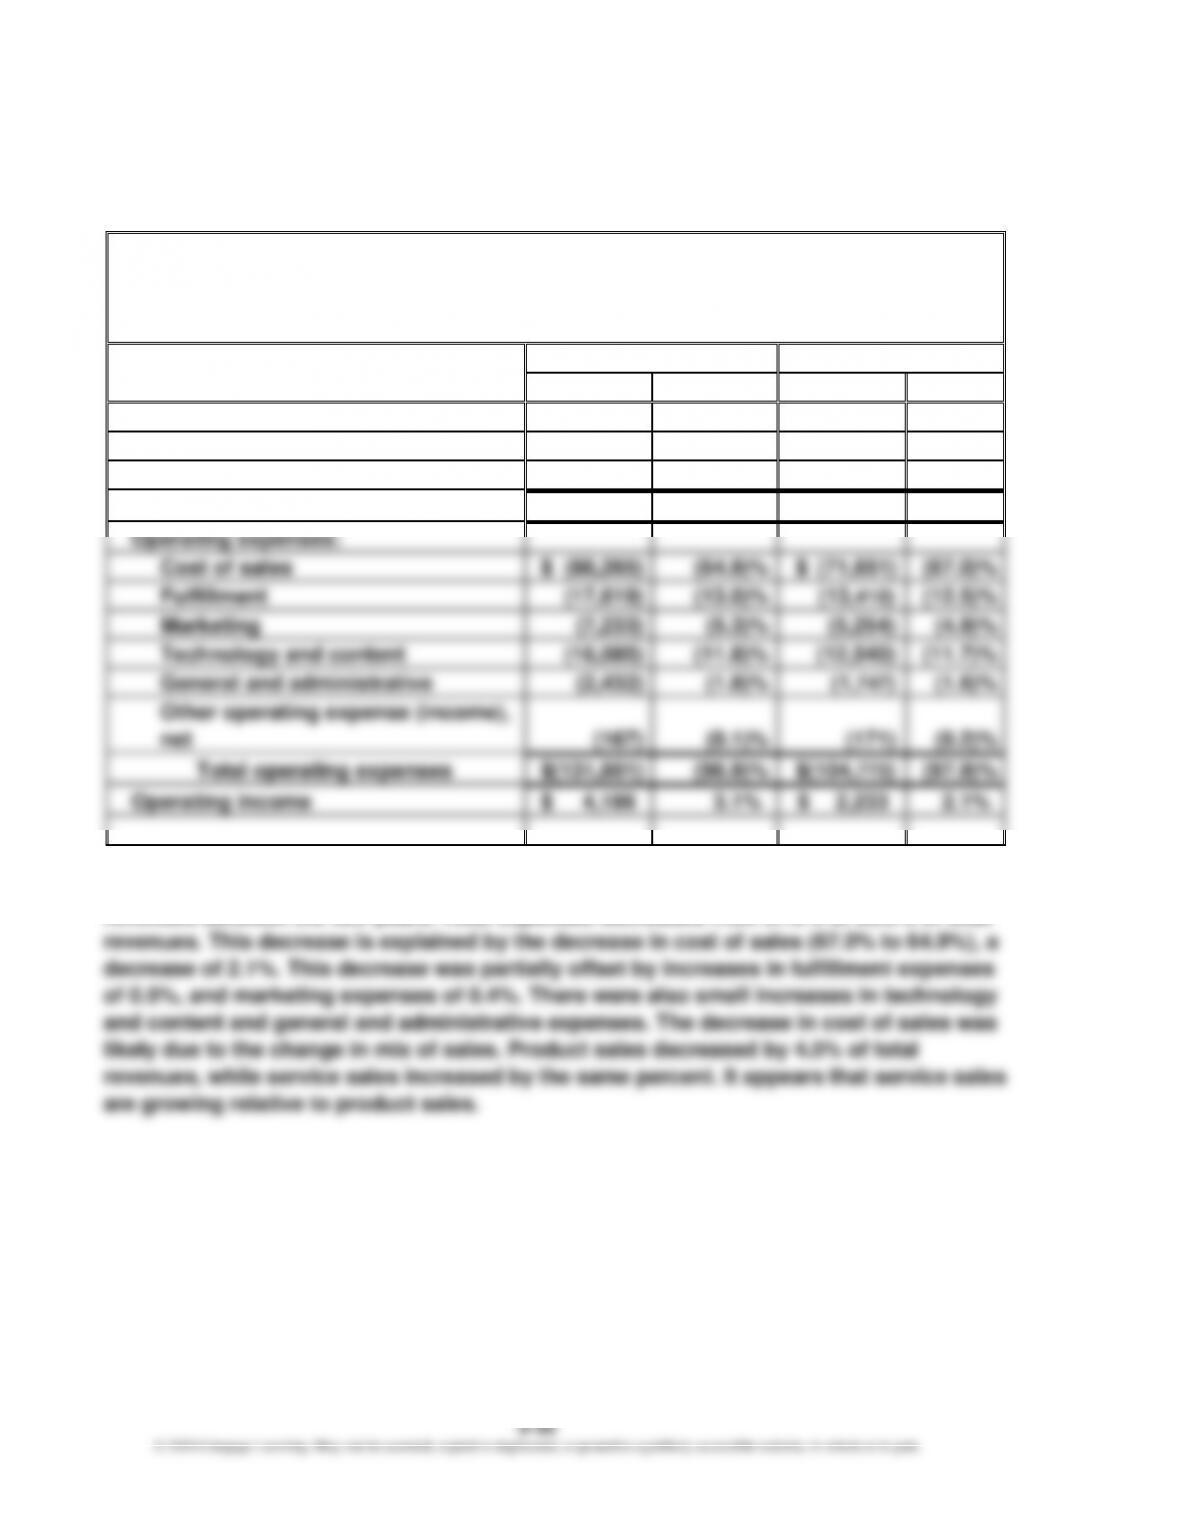
Amazon.com, Inc.
Income Statements
For the Years Ended December 31
(in millions)
Year 2
Year 1
Amount
Percent
Amount
Percent
Revenues:
Product sales
$ 94,665
69.6%
$ 79,268
74.1%
Service sales
41,322
30.4%
27,738
25.9%
Total revenues
$ 135,987
100.0%
$ 107,006
100.0%
Operating expenses:
Cost of sales
$ (88,265)
(64.9)%
$ (71,651)
(67.0)%
Fulfillment
(17,619)
(13.0)%
(13,410)
(12.5)%
Marketing
(7,233)
(5.3)%
(5,254)
(4.9)%
Technology and content
(16,085)
(11.8)%
(12,540)
(11.7)%
General and administrative
(2,432)
(1.8)%
(1,747)
(1.6)%
Other operating expense (income),
net
(167)
(0.1)%
(171)
(0.2)%
Total operating expenses
$(131,801)
(96.9)%
$(104,773)
(97.9)%
Operating income
$ 4,186
3.1%
$ 2,233
2.1%
b. The vertical analysis indicates that operating income increased from 2.1% to 3.1% of total
revenues between the two years. Total expenses decreased from 97.9% to 96.9% of total
3-33
MAD 3–2
a.
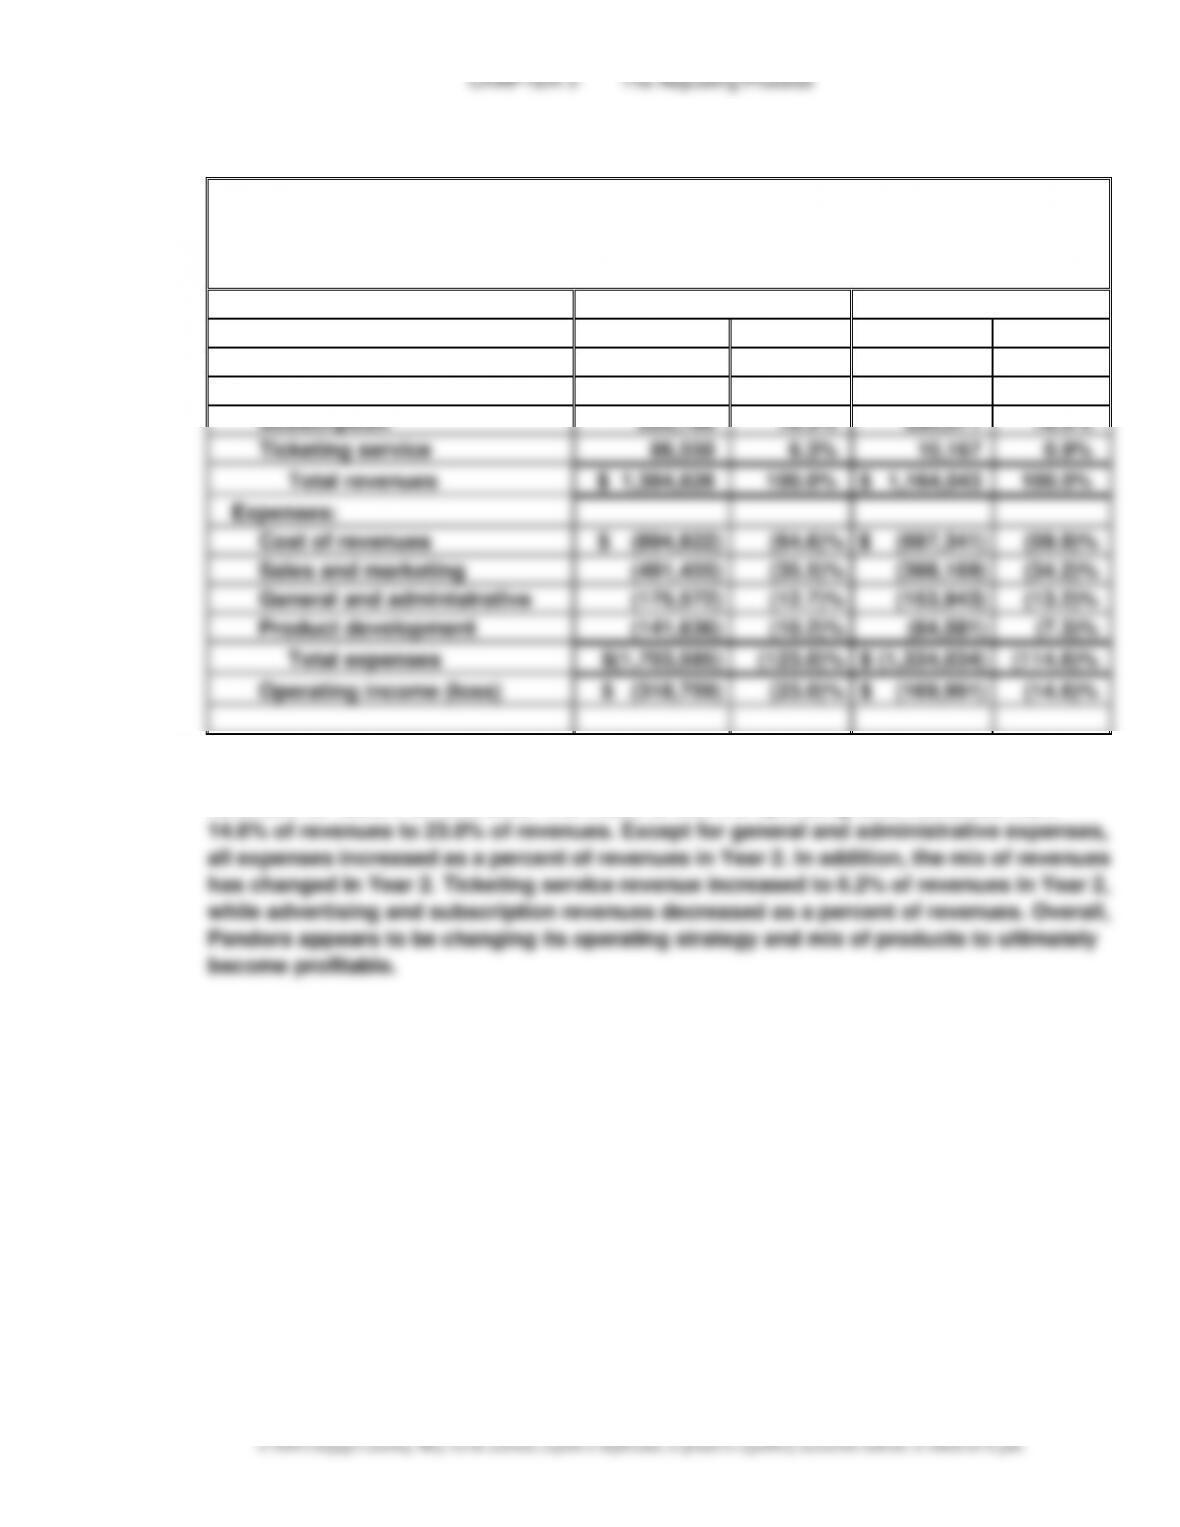
Pandora Media, Inc.
Income Statements
For the Years Ended January 31
(in thousands)
Year 2
Year 1
Amount
Percent
Amount
Percent
Revenues:
Advertising
$ 1,072,490
77.4%
$ 933,305
80.2%
Subscription
225,786
16.3%
220,571
18.9%
Ticketing service
86,550
6.3%
10,167
0.9%
Total revenues
$ 1,384,826
100.0%
$ 1,164,043
100.0%
Expenses:
Cost of revenues
$ (894,922)
(64.6)%
$ (697,341)
(59.9)%
Sales and marketing
(491,455)
(35.5)%
(398,169)
(34.2)%
General and administrative
(175,572)
(12.7)%
(153,943)
(13.2)%
Product development
(141,636)
(10.2)%
(84,581)
(7.3)%
Total expenses
$(1,703,585)
(123.0)%
$ (1,334,034)
(114.6)%
Operating income (loss)
$ (318,759)
(23.0)%
$ (169,991)
(14.6)%
b. Although revenues have increased in Year 2, expenses also increased from 114.6% of
revenues to 123.0% of revenues. The result is that the operating loss increased from
CHAPTER 3 The Adjusting Process
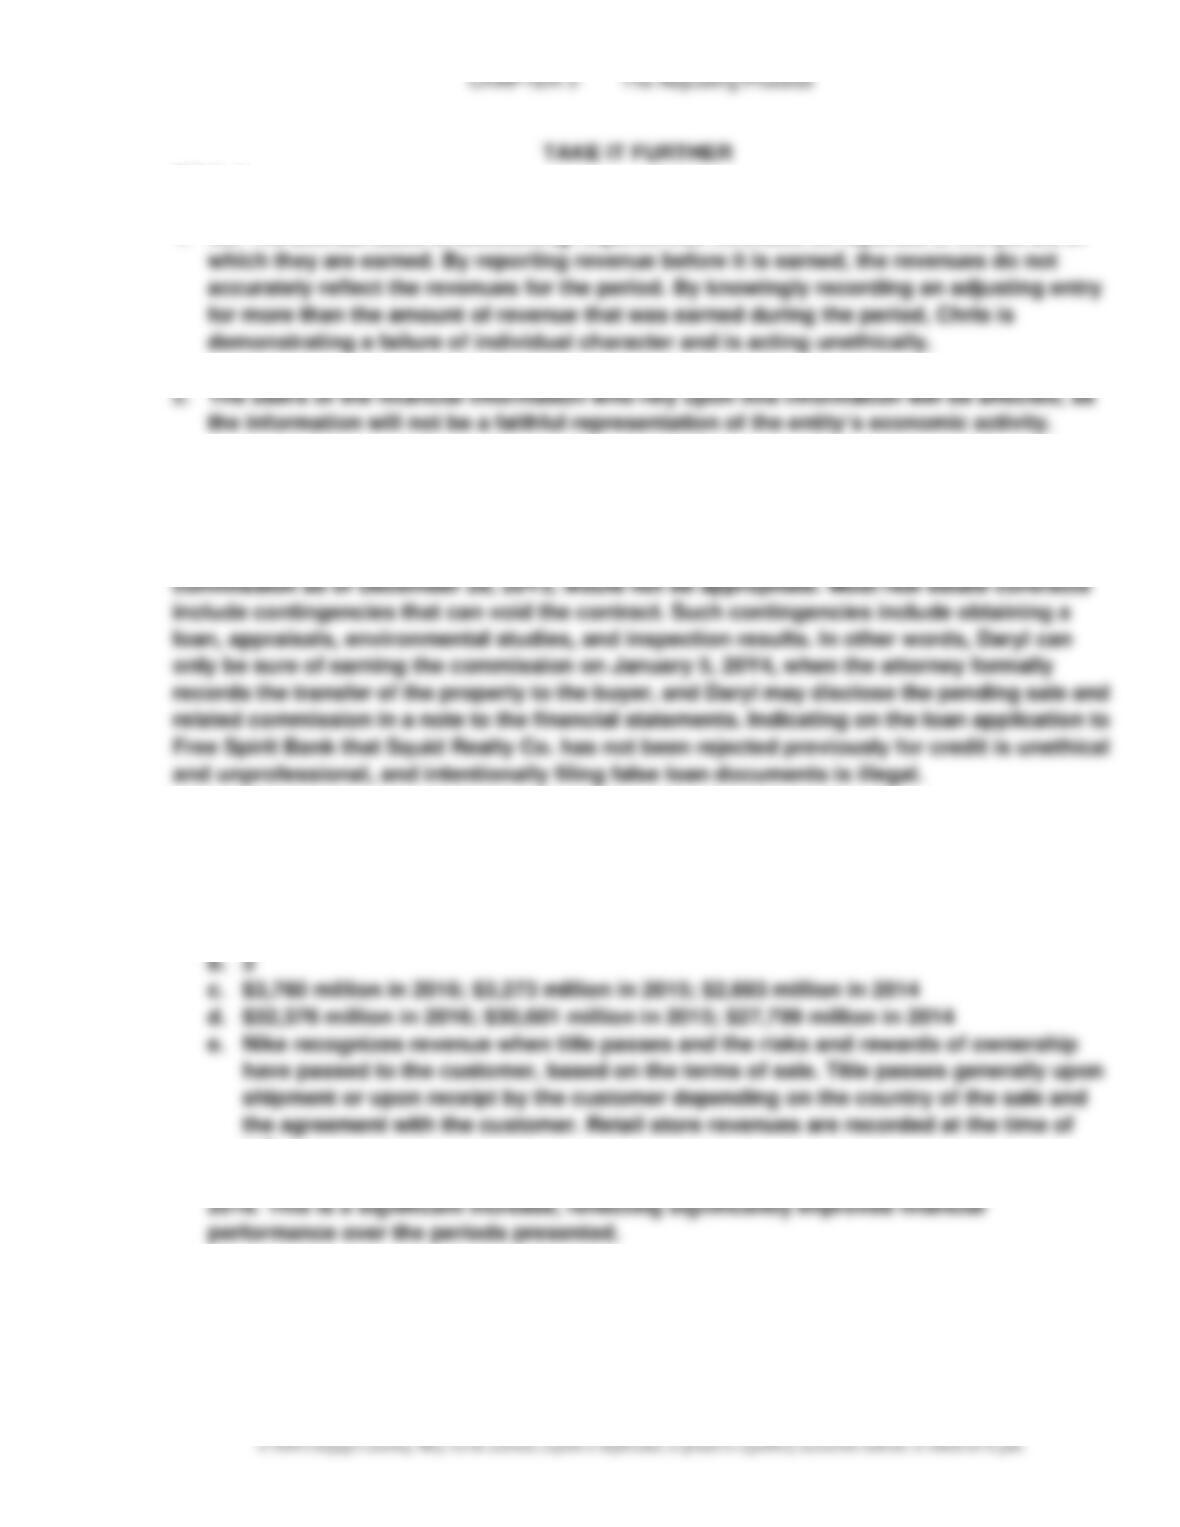
MAD 3–3
a.
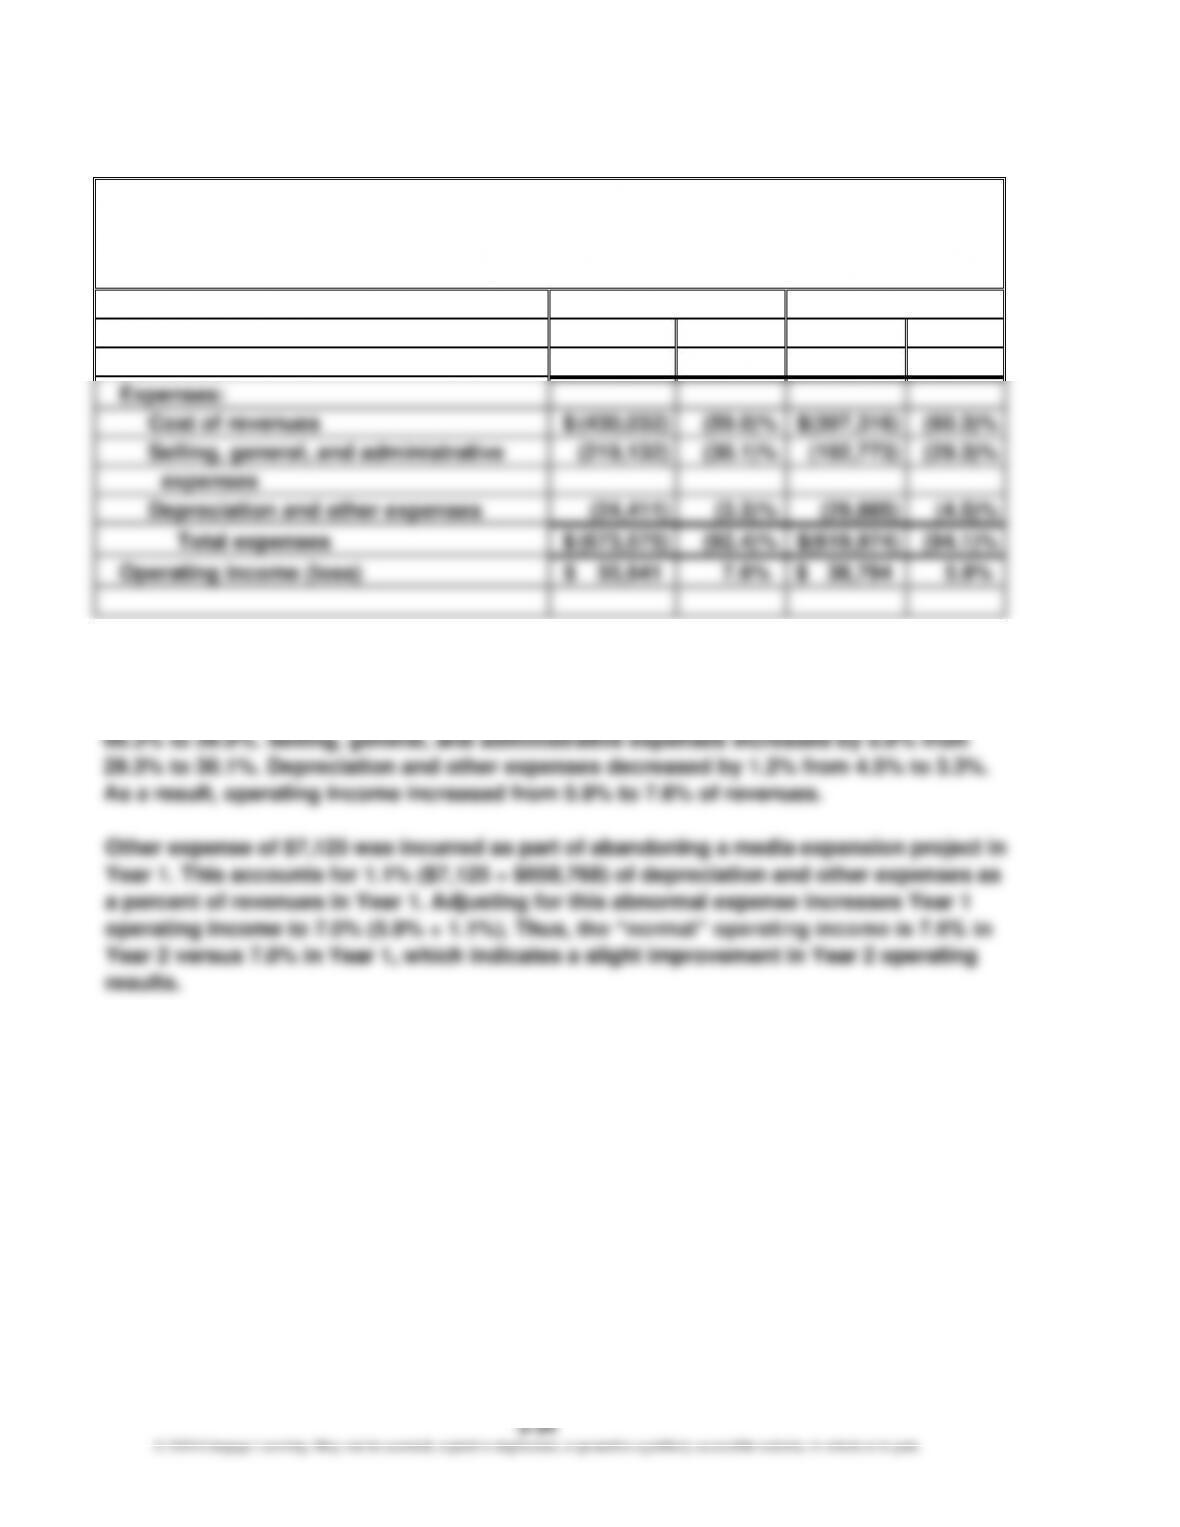
World Wrestling Entertainment, Inc.
Income Statements
For the Years Ended December 31
(in thousands)
Year 2
Year 1
Amount
Percent
Amount
Percent
Revenues
$ 729,216
100.0%
$ 658,768
100.0%
Expenses:
Cost of revenues
$ (430,032)
(59.0)%
$(397,316)
(60.3)%
Selling, general, and administrative
(219,132)
(30.1)%
(192,773)
(29.3)%
expenses
Depreciation and other expenses
(24,411)
(3.3)%
(29,885)
(4.5)%
Total expenses
$ (673,575)
(92.4)%
$(619,974)
(94.1)%
Operating income (loss)
$ 55,641
7.6%
$ 38,794
5.9%
b. The vertical analysis indicates a decrease in total expenses as a percent of revenues from
94.1% in Year 1 to 92.4% in Year 2. Cost of revenues decreased by 1.3% of revenues from
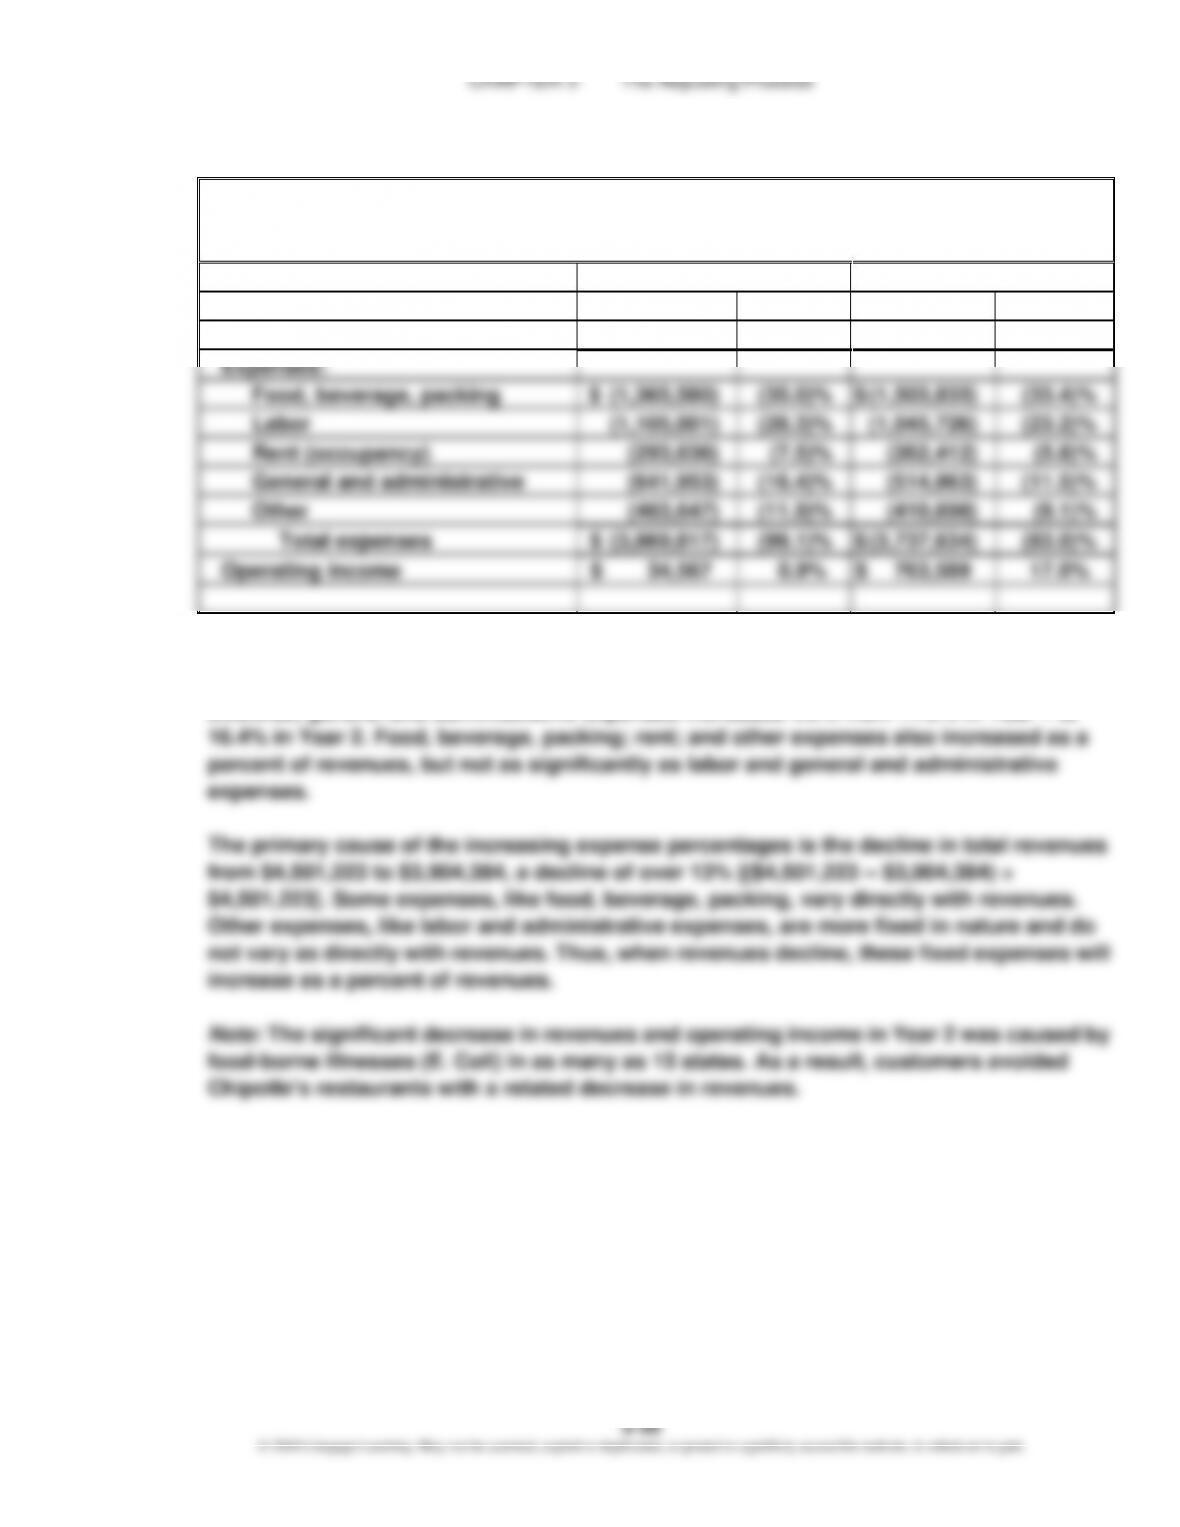
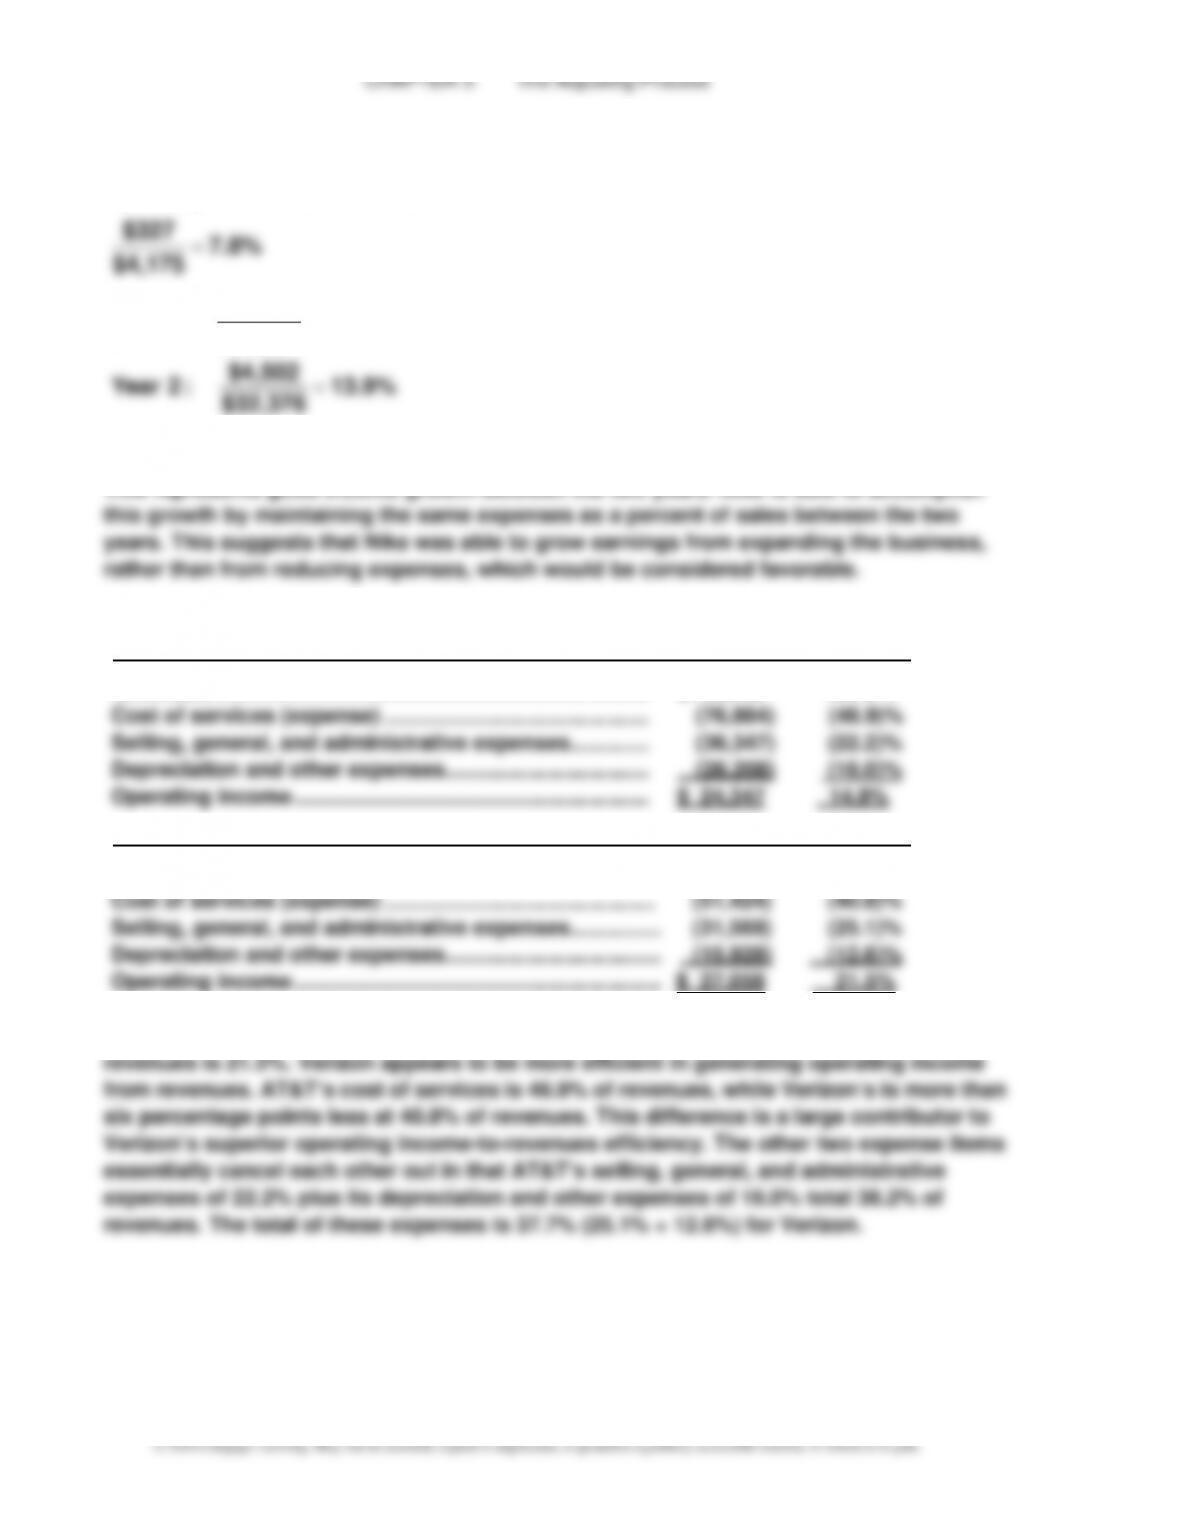
MAD 3–5
a. Operating income: $4,502 – $4,175 = $327 million
$4,175
$327 =
b.
13.6%
$30,601
$4,175
:1 Year
=
3-37
TIF 3–2
1. No. The accrual basis of accounting requires that revenues be reported in the period in
TIF 3–2
It is acceptable for Daryl to prepare the financial statements for Squid Realty Co. on an
accrual basis. The revision of the financial statements to include the accrual of the $30,000
TIF 3–3
A sample solution based on Nike Inc.’s Form 10-K for the fiscal year ended May 31, 2016,
follows:
1. a. Footwear
sale.
2. The company’s net income has increased from $2,693 million in 2014 to $3,760 million in
CHAPTER 3 The Adjusting Process
TIF 384
To: My Instructor
From: Ima Student
Re: Revenue Recognition of Ticket Sales at Delta Air Lines
Customers of Delta Air Lines typically purchase tickets for air travel several weeks prior to
their scheduled flight and pay for their tickets using a credit card such as VISA or American
the fact that Delta has provided the service.
TIF 3–5
1. There are several indications that adjusting entries were not recorded before the financial
statements were prepared, including:
2. Likely accounts requiring adjustment include:
a. Accumulated Depreciation—Truck for depreciation expense