CHAPTER 14 Financial Statement Analysis
14–39
Prob. 14–2B
1.
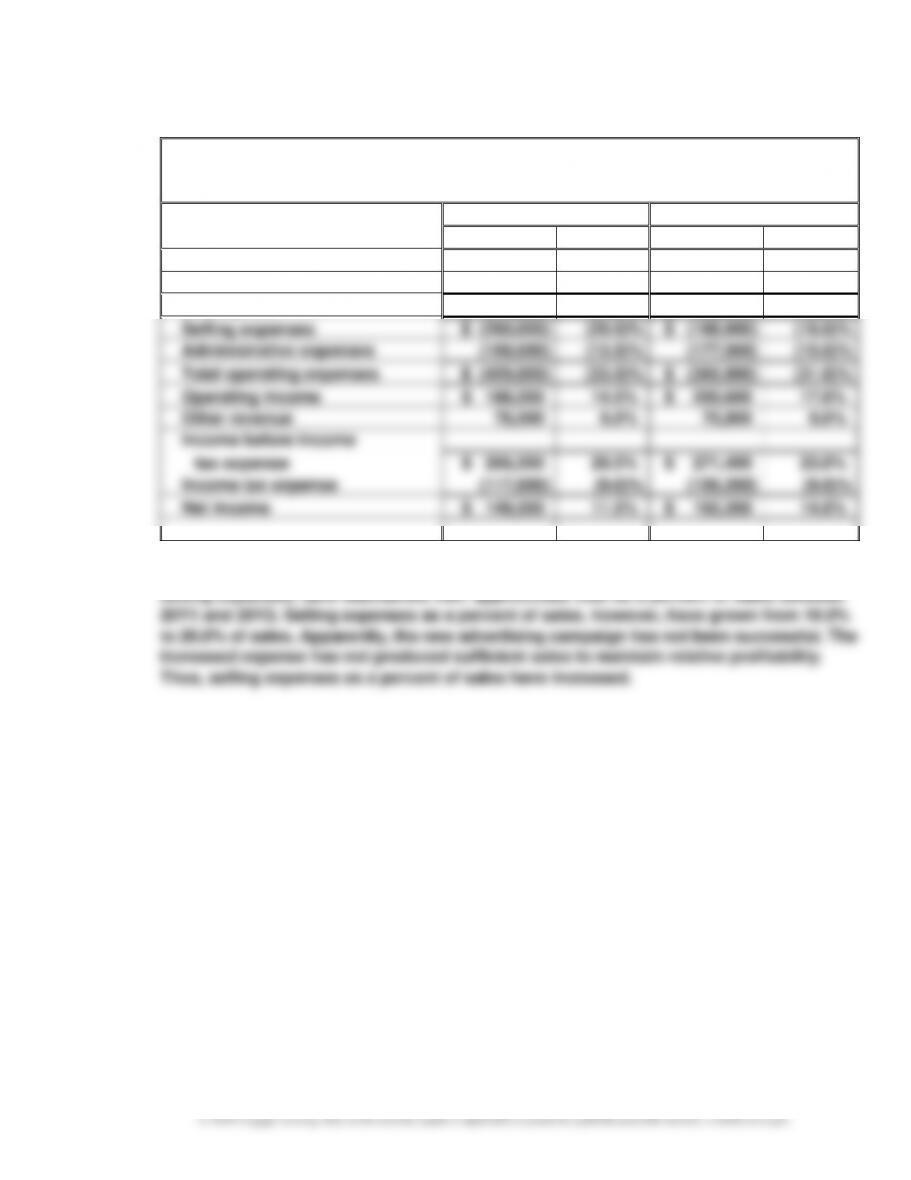
Fielder Industries Inc.
Comparative Income Statement
For the Years Ended December 31, 20Y2 and 20Y1
20Y2
20Y1
Amount
Percent
Amount
Percent
Sales
$1,300,000
100.0%
$ 1,180,000
100.0%
Cost of goods sold
(682,500)
(52.5)%
(613,600)
(52.0)%
Gross profit
$ 617,500
47.5%
$ 566,400
48.0%
Selling expenses
$ (260,000)
(20.0)%
$ (188,800)
(16.0)%
Administrative expenses
(169,000)
(13.0)%
(177,000)
(15.0)%
Total operating expenses
$ (429,000)
(33.0)%
$ (365,800)
(31.0)%
Operating income
$ 188,500
14.5%
$ 200,600
17.0%
Other revenue
78,000
6.0%
70,800
6.0%
Income before income
tax expense
$ 266,500
20.5%
$ 271,400
23.0%
Income tax expense
(117,000)
(9.0)%
(106,200)
(9.0)%
Net income
$ 149,500
11.5%
$ 165,200
14.0%
2. The net income as a percent of sales has declined. All the costs and expenses, other than
selling expenses, have maintained their approximate cost as a percent of sales between
CHAPTER 14 Financial Statement Analysis
14–40
Prob. 14–3B
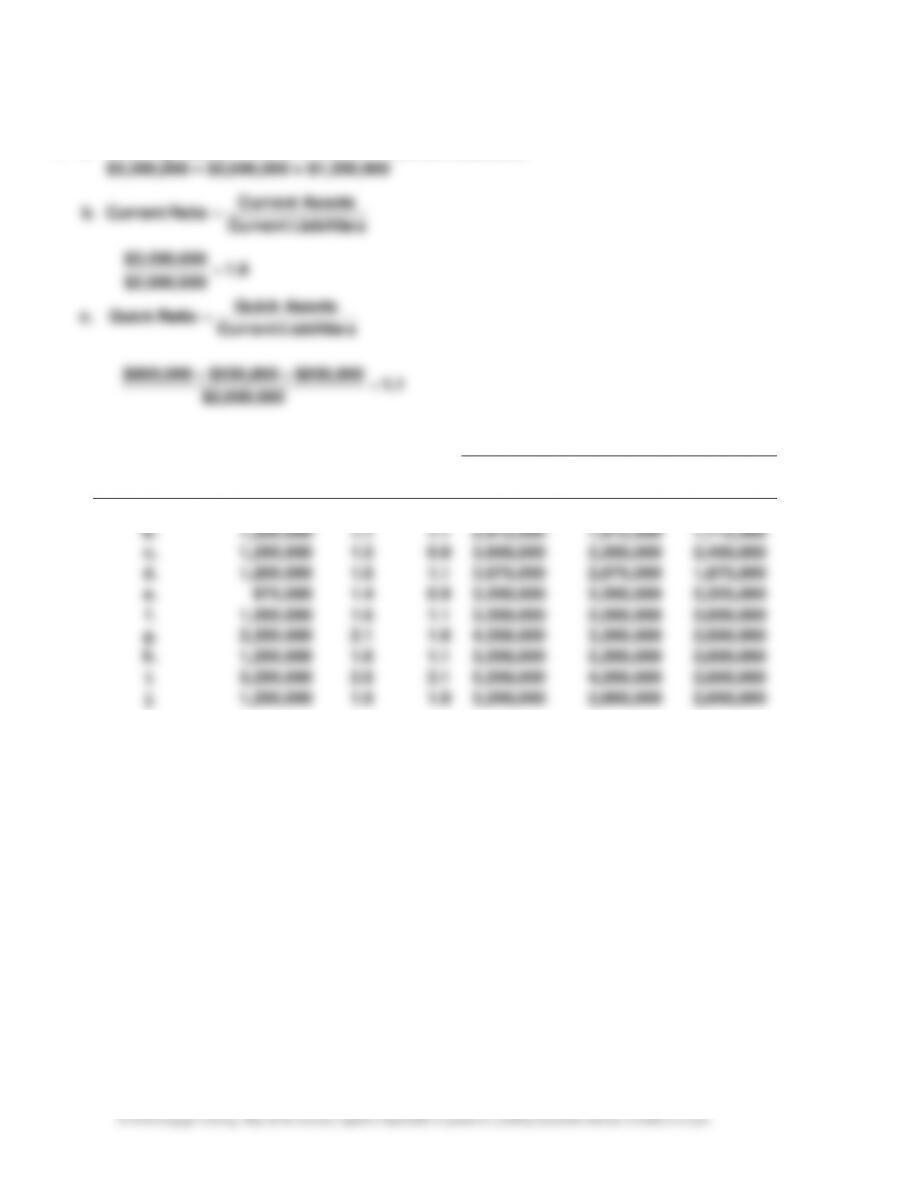
1. a. Working Capital = Current Assets – Current Liabilities
1.1
$2,000,000
2. Supporting Data
Transaction
Working
Capital
Current
Ratio
Quick
Ratio
Current
Assets
Quick
Assets
Current
Liabilities
a.
$1,200,000
1.6
1.1
$3,200,000
$2,200,000
$2,000,000
b.
1,200,000
1.7
1.1
2,912,500
1,912,500
1,712,500
c.
1,200,000
1.5
0.9
3,600,000
2,200,000
2,400,000
d.
1,200,000
1.6
1.1
3,075,000
2,075,000
1,875,000
e.
875,000
1.4
0.9
3,200,000
2,200,000
2,325,000
f.
1,200,000
1.6
1.1
3,200,000
2,200,000
2,000,000
g.
2,200,000
2.1
1.6
4,200,000
3,200,000
2,000,000
h.
1,200,000
1.6
1.1
3,200,000
2,200,000
2,000,000
i.
3,200,000
2.6
2.1
5,200,000
4,200,000
2,000,000
j.
1,200,000
1.6
1.0
3,200,000
2,000,000
2,000,000
CHAPTER 14 Financial Statement Analysis
14–41
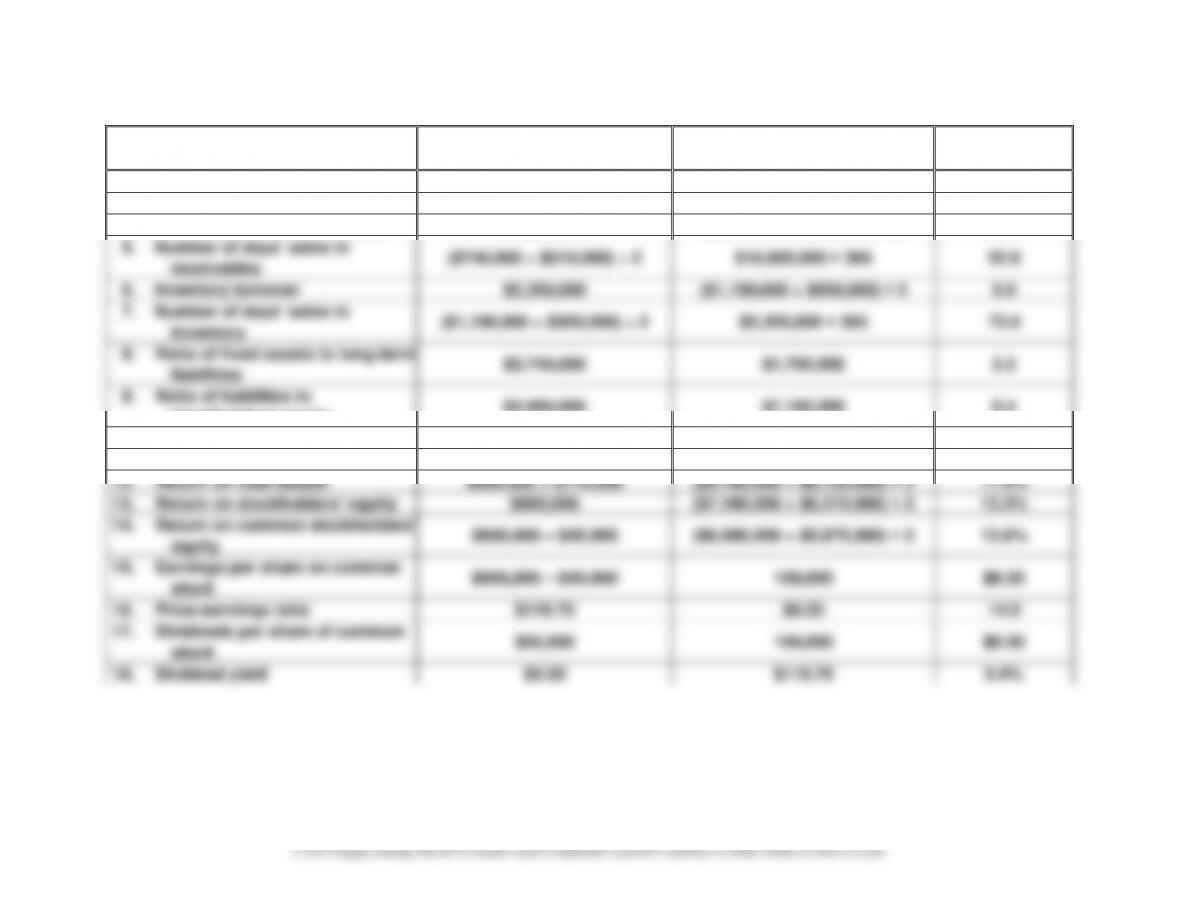
Prob.14–4B
1. Working Capital: $3,690,000 – $900,000 = $2,790,000
Calculated
Value
Ratio
Numerator
Denominator
2.
Current ratio
$3,690,000
$900,000
4.1
3.
Quick ratio
$2,250,000
$900,000
2.5
4.
Accounts receivable turnover
$10,000,000
($740,000 + $510,000) ÷ 2
16.0
5.
Number of days’ sales in
receivables
($740,000 + $510,000) ÷ 2
$10,000,000 ÷ 365
22.8
6.
Inventory turnover
$5,350,000
($1,190,000 + $950,000) ÷ 2
5.0
7.
Number of days’ sales in
inventory
($1,190,000 + $950,000) ÷ 2
$5,350,000 ÷ 365
73.0
8.
Ratio of fixed assets to long-term
liabilities
$3,740,000
$1,700,000
2.2
9.
Ratio of liabilities to
stockholders’ equity
$2,600,000
$7,180,000
0.4
10.
Times interest earned
$1,130,000 + $170,000
$170,000
7.6
11.
Asset turnover
$10,000,000
($7,430,000 + $6,455,000) ÷ 2
1.4
12.
Return on total assets
$900,000 + $170,000
($9,780,000 + $8,755,000) ÷ 2
11.5%
13.
Return on stockholders’ equity
$900,000
($7,180,000 + $6,375,000) ÷ 2
13.3%
14.
Return on common stockholders’
equity
$900,000 – $45,000
($6,680,000 + $5,875,000) ÷ 2
13.6%
15.
Earnings per share on common
stock
$900,000 – $45,000
100,000
$8.55
16.
Price-earninqs ratio
$119.70
$8.55
14.0
17.
Dividends per share of common
stock
$50,000
100,000
$0.50
18.
Dividend yield
$0.50
$119.70
0.4%
CHAPTER 14 Financial Statement Analysis
14–42
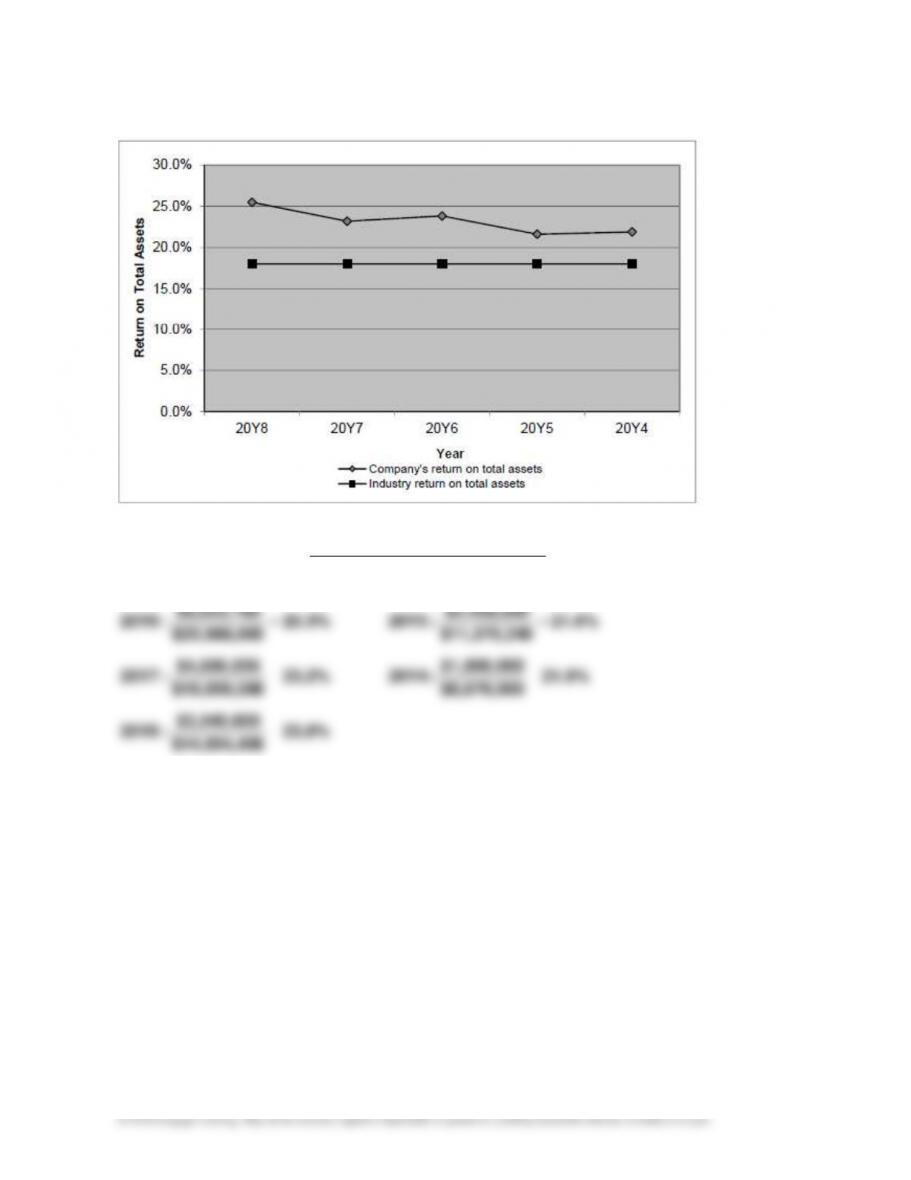
Prob. 14–5B
1.
a.
AssetsTotal Average
ExpenseInterest IncomeNet
AssetsTotal on Return +
=
23.8%
6$14,854,40
$3,540,600
:20Y6
21.9%
$8,676,000
$1,900,000
:20Y423.2%
6$19,859,58
$4,606,056
:20Y7
21.6%
0$11,370,24
$2,458,000
:20Y525.5%
5$25,988,66
$6,623,780
:20Y8
=
==
==
CHAPTER 14 Financial Statement Analysis
14–43
Prob. 14–5B (Continued)
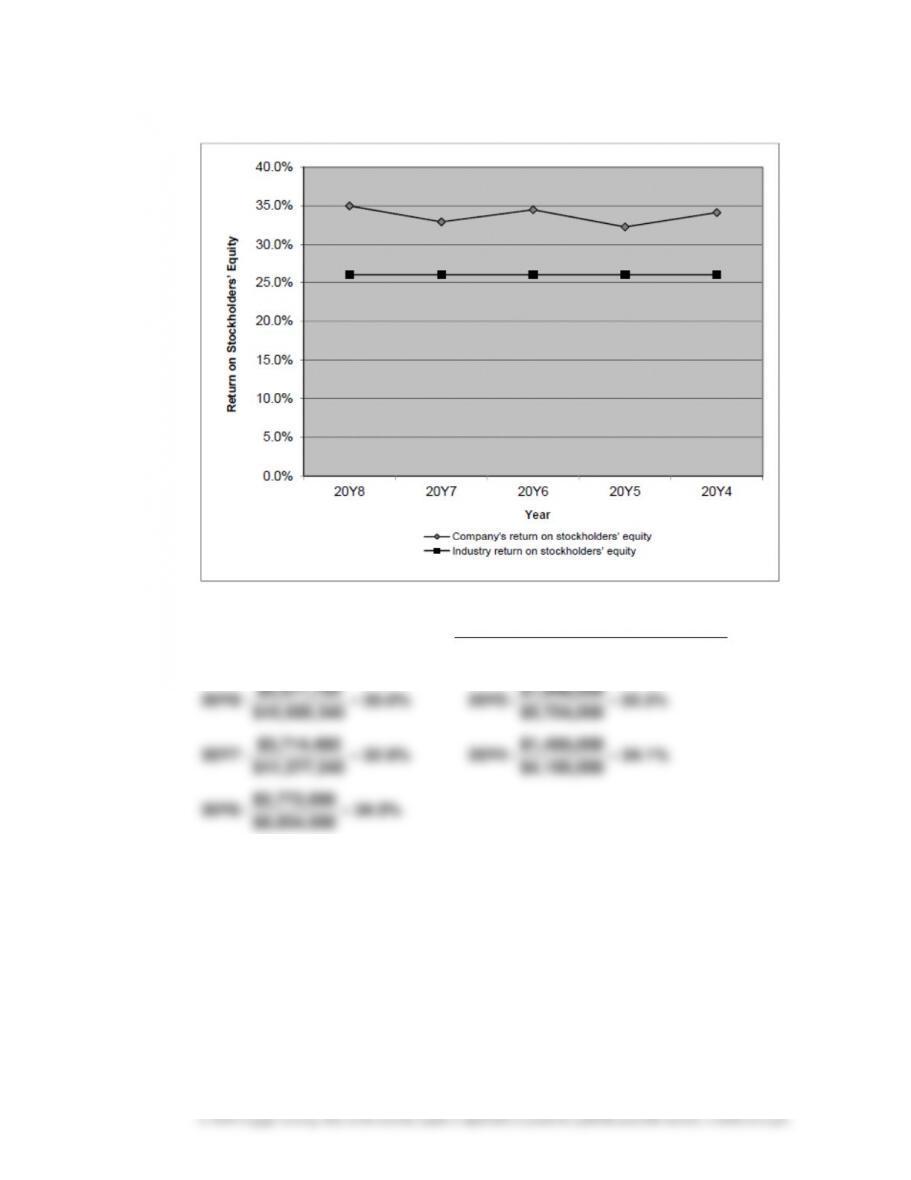
1.
b.
Equity rs’Stockholde Total Average
IncomeNet
Equity rs’Stockholde on Return =
34.5%
$8,034,000
$2,772,000
:20Y6
34.1%
$4,100,000
$1,400,000
:20Y432.9%
0$11,277,24
$3,714,480
:20Y7
32.3%
$5,724,000
$1,848,000
:20Y535.0%
0$15,920,34
$5,571,720
:20Y8
=
==
==
CHAPTER 14 Financial Statement Analysis
14–44
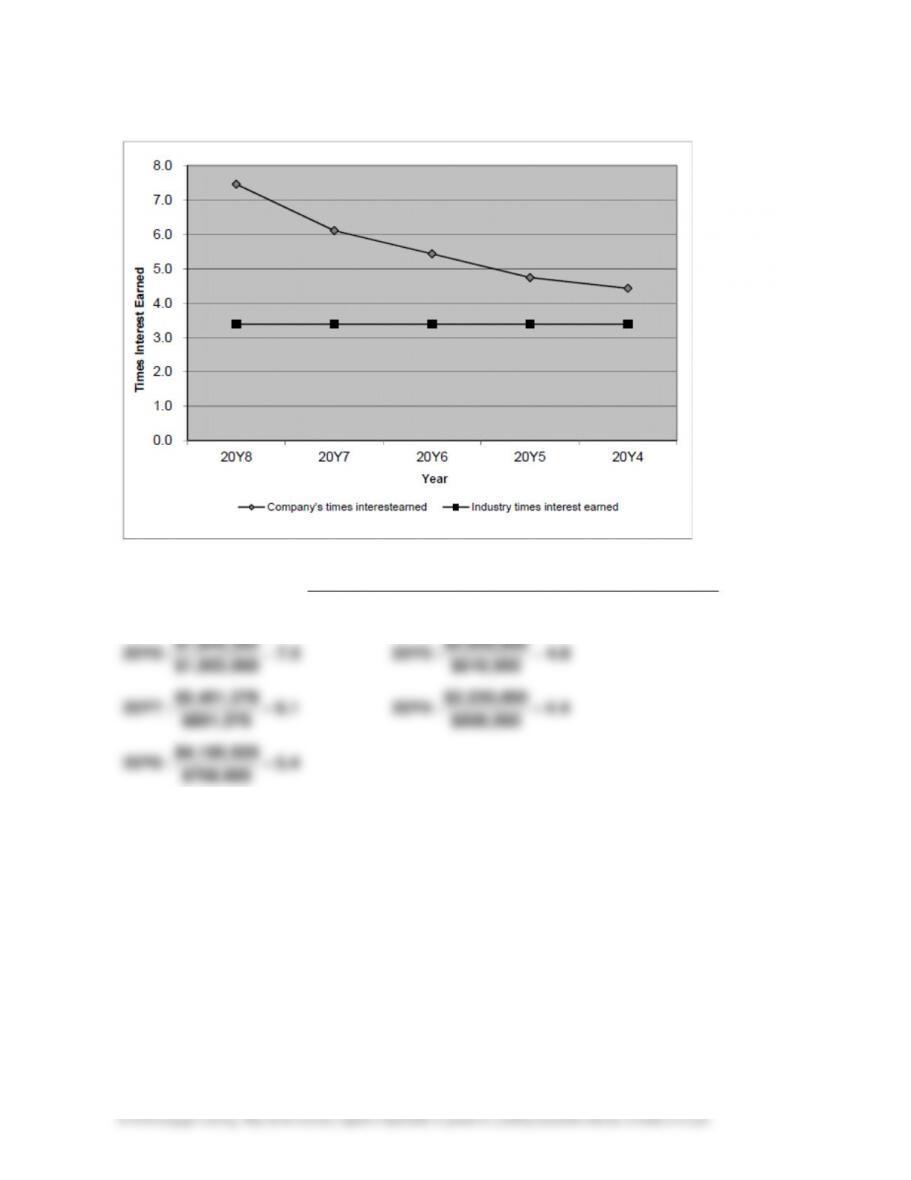
Prob. 14–5B (Continued)
1.
c.
ExpenseInterest
ExpenseInterest Expense Tax Income IncomeNet
EarnedInterest Times ++
=
5.4
$768,600
$4,180,920
:20Y6
4.4
$500,000
$2,220,000
:20Y46.1
$891,576
$5,451,278
:20Y7
4.8
$610,000
$2,899,600
:20Y57.5
$1,052,060
$7,849,352
:20Y8
=
==
==
CHAPTER 14 Financial Statement Analysis
14–45
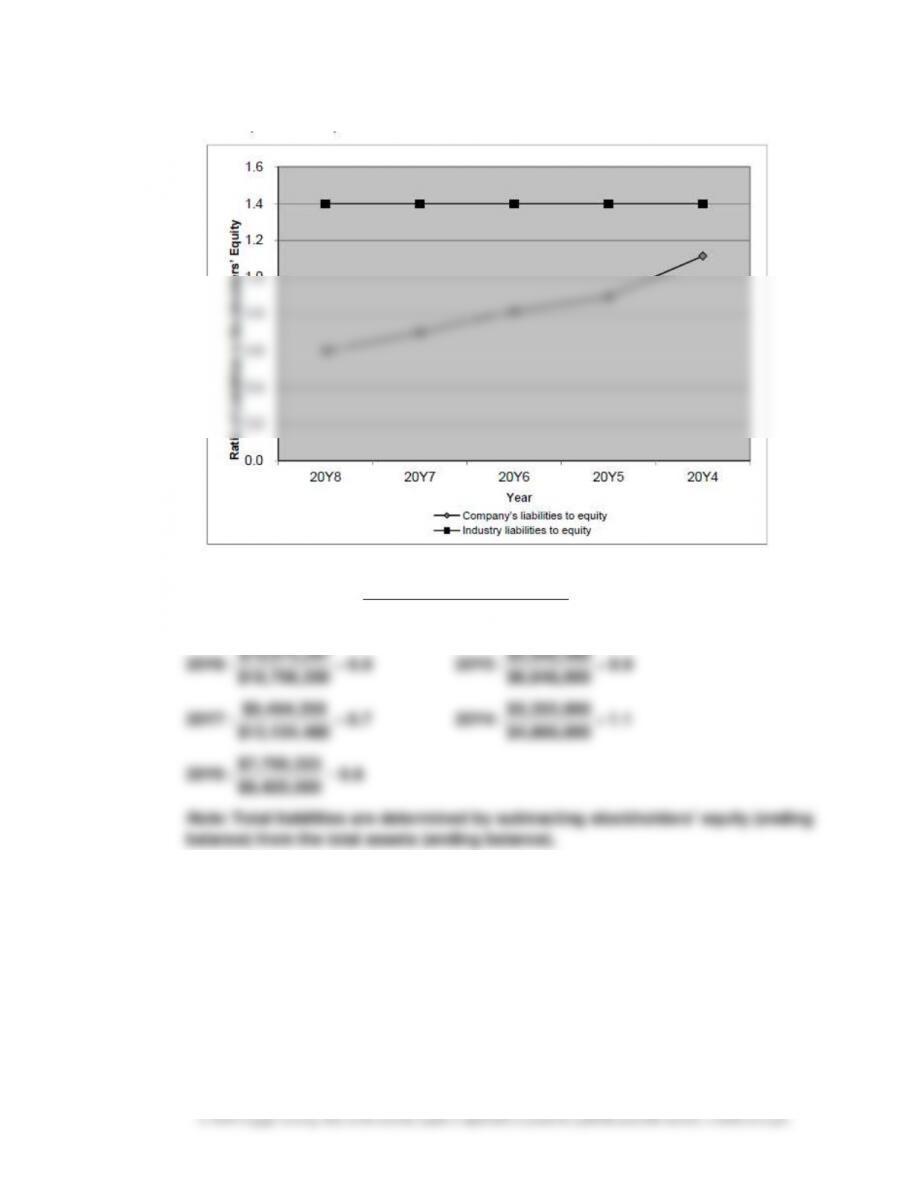
Prob. 14–5B (Continued)
1.
d.
Equity rs’Stockholde Total
sLiabilitie Total
Equity rs’Stockholde
to sLiabilitie of Ratio =
0.8
$9,420,000
$7,700,333
:20Y6
1.1
$4,800,000
$5,352,000
:20Y40.7
0$13,134,48
$9,464,359
:20Y7
0.9
$6,648,000
$5,940,480
:20Y50.6
0$18,706,20
1$10,672,29
:20Y8
=
==
==
Note: Total liabilities are determined by subtracting stockholders’ equity (ending
balance) from the total assets (ending balance).
CHAPTER 14 Financial Statement Analysis
14–46
Prob. 14–5B (Concluded)
2. Both the return on total assets and the return on stockholders’ equity are above the
industry average for all five years. The return on total assets is actually improving
gradually. The return on stockholders’ equity exceeds the return earned on total assets,
CHAPTER 14 Financial Statement Analysis
14–47
MAKE A DECISION
MAD 14–1
1.
Amazon
Best Buy
Wal-Mart
Sales
100.0%
100.0%
100.0%
Cost of sales
(64.9)%
(76.0)%
(74.4)%
Gross profit
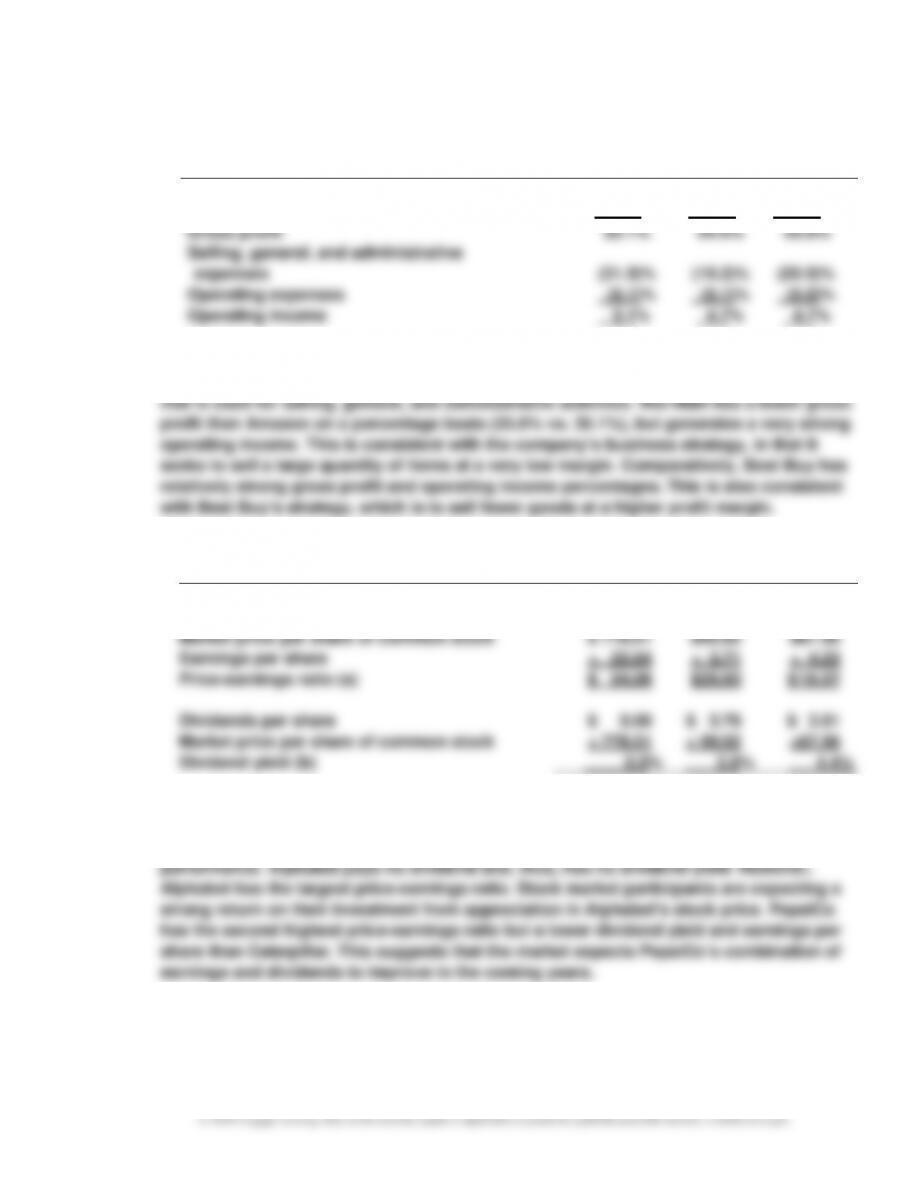
Selling, general, and administrative
35.1%
24.0%
25.6%
expenses
(31.9)%
(19.2)%
(20.9)%
Operating expenses
(0.1)%
(0.1)%
(0.0)%
Operating income
3.1%
4.7%
4.7%
2. Amazon has the highest gross profit on a percentage basis, but has the lowest operating
income on a percentage basis. This is because of the relatively large percentage of sales
MAD 14–2
1.
Alphabet
PepsiCo
Caterpillar
Earnings per share
$ 22.84
$ 3.71
$ 4.23
Market price per share of common stock
Earnings per share
Price-earnings ratio (a)
$ 778.01
÷ 22.84
$ 34.06
$99.92
÷ 3.71
$26.93
$67.96
÷ 4.23
$ 16.07
Dividends per share
Market price per share of common stock
Dividend yield (b)
$ 0.00
÷ 778.01
0.0%
$ 2.76
÷ 99.92
2.8%
$ 3.01
÷67.96
4.4%
2. Caterpillar has the largest dividend yield and strong earnings per share but has the lowest
price-earnings ratio. Stock market participants seem to be skeptical about Caterpillar’s
future prospects and are discounting its stock price despite its relatively solid
CHAPTER 14 Financial Statement Analysis
MAD 14–3
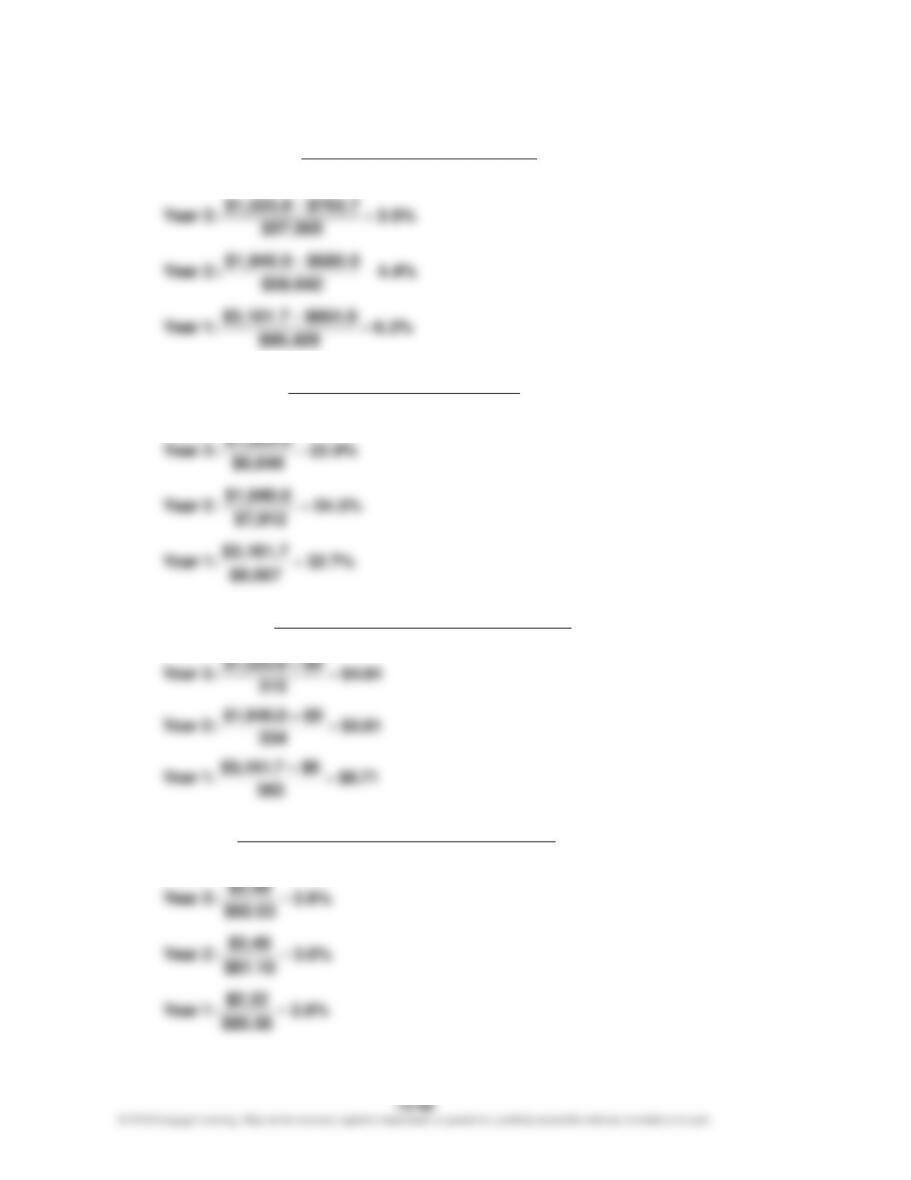
1. a.
AssetsTotal Average
ExpenseInterest IncomeNet
AssetsTotal on Return +
=
6.3%
$60,429
$664.0 $3,161.7
:1 Year
$59,642
$680.0 $1,940.0
3.9%
$57,965
$763.7 $1,523.9
:3 Year
=
+
+
=
+
b.
Equity rs’Stockholde Average
IncomeNet
Equity rs’Stockholde
Total on Return =
32.7%
$9,667
$3,161.7
:1 Year
$7,912
$1,940.0
22.9%
$6,644
$1,523.9
:3 Year
=
=
c.
gOutstandin Stock Common of Shares
Dividends Preferred – IncomeNet
Share per Earnings =
$8.71
363
$0 – $3,161.7
:1 Year
334
$0 – $1,940.0
$4.84
315
$0 – $1,523.9
:3 Year
=
=
d.
Stock Common of Share per PriceMarket
Stock Common of Share per Dividend
Yield Dividend =
$2.40
2.6%
$92.03
$2.40
:3 Year
=
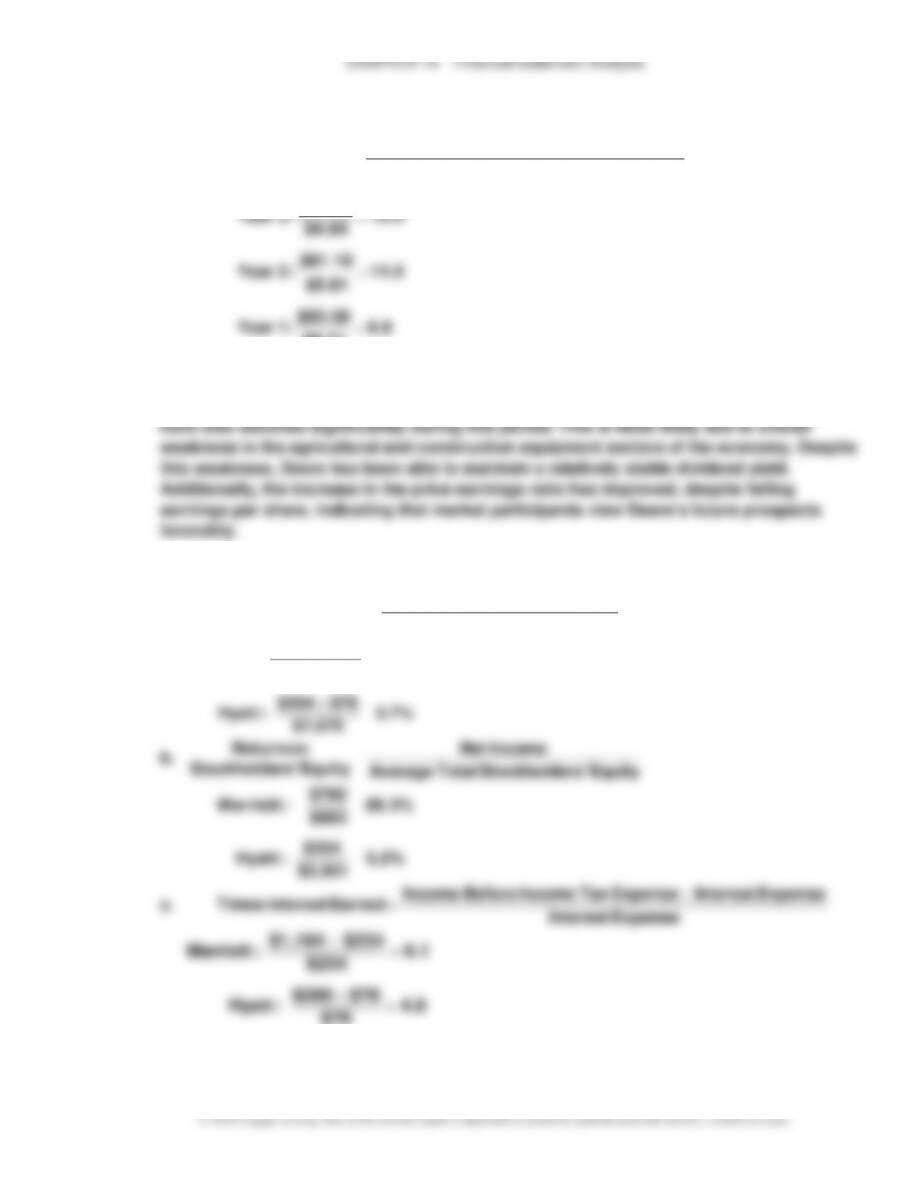
MAD 14–3 (Concluded)
e.
Share per Earnings
Stock Common of Share per PriceMarket
Ratio Earnings–Price =
$81.10
19.0
$4.84
$92.03
:3 Year
=
CHAPTER 14 Financial Statement Analysis
MAD 14–4 (Concluded)
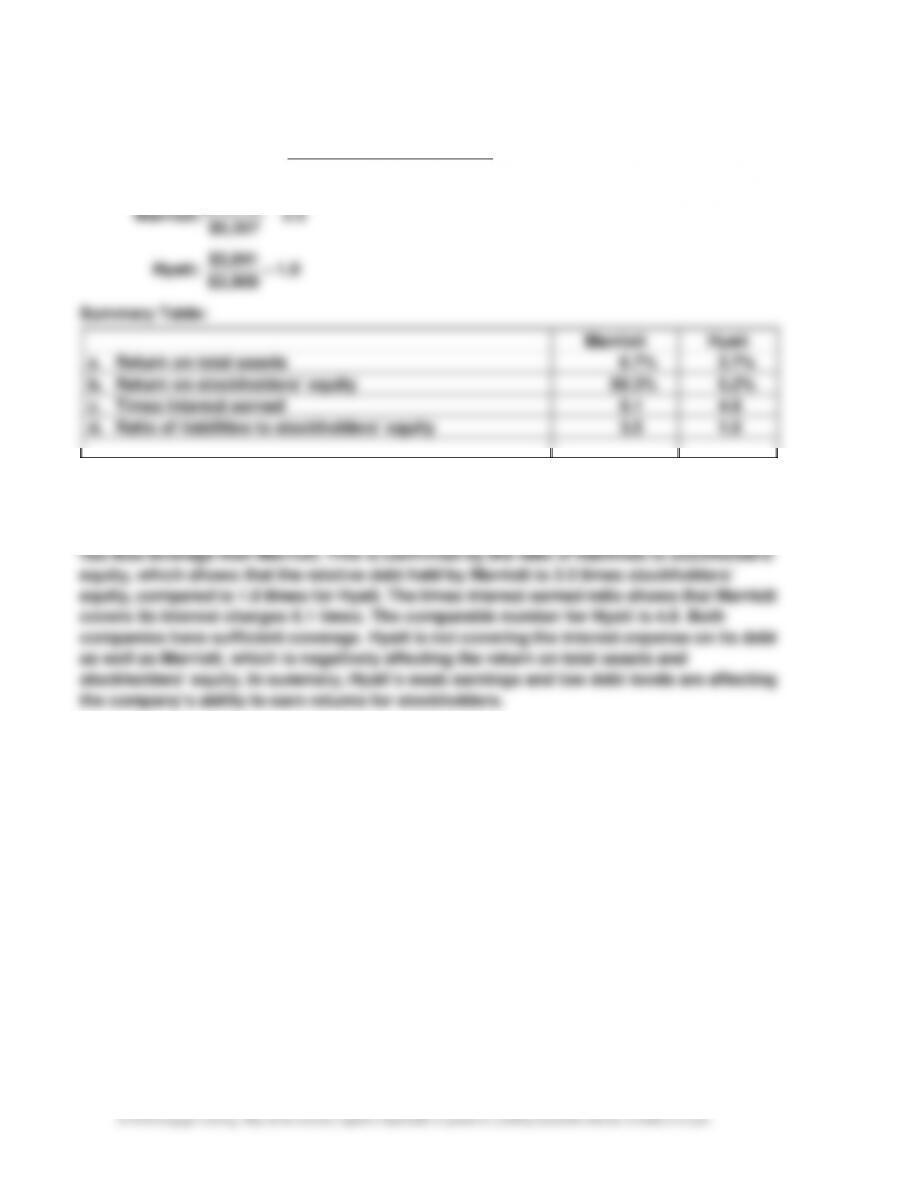
d.
Equity rs’Stockholde Total
sLiabilitie Total
Equity rs’Stockholde
to sLiabilitie of Ratio =
3.5
$5,357
$18,783
:Marriott
=
CHAPTER 14 Financial Statement Analysis
TAKE IT FURTHER
TIF 14–1
No, Josh did not behave ethically. The Sarbanes-Oxley Act of 2002 requires a report on
14–52
TIF 14–2
Fiscal
2017
Fiscal
2016
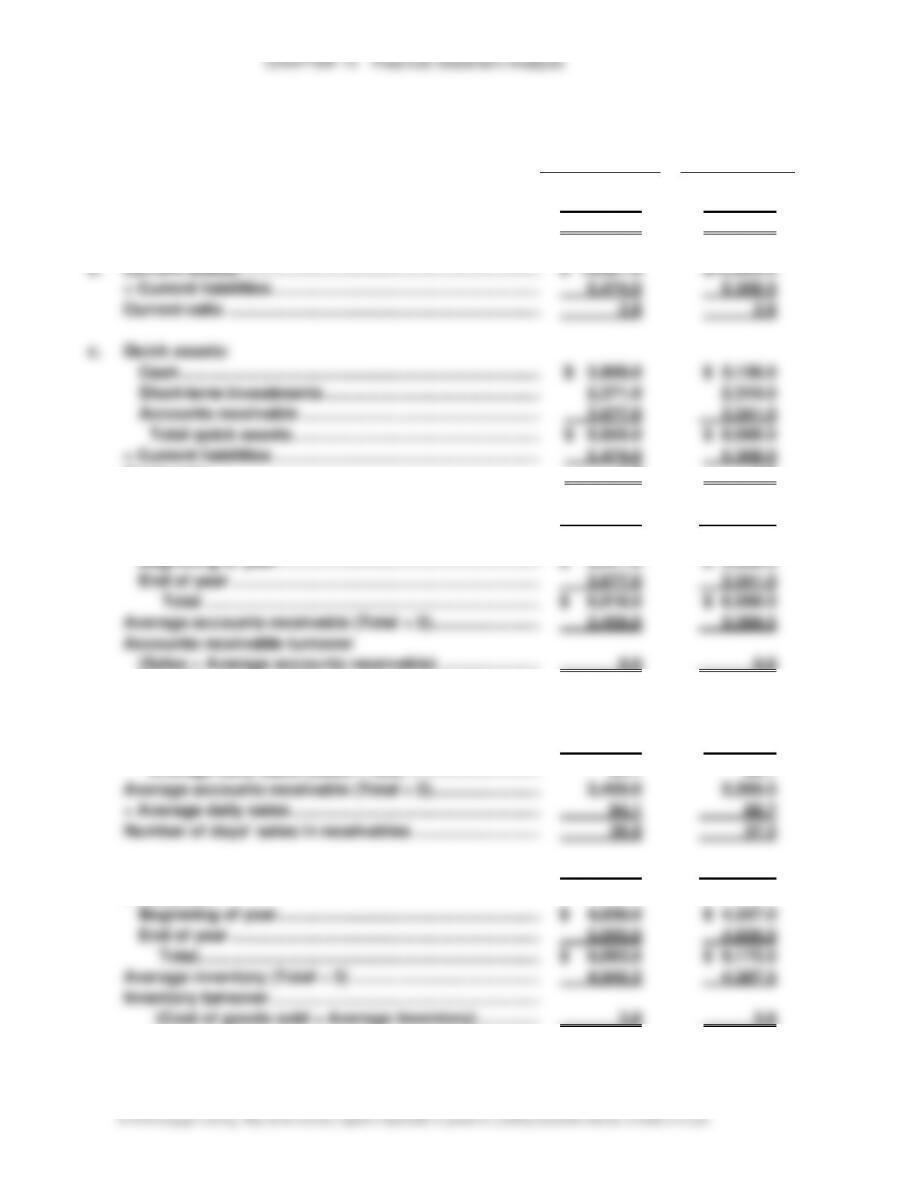
1.
a.
Current assets ………………………………………………………………..
$ 16,061.0
$15,025.0
Current liabilities ……………………………………………………….
5,474.0
5,358.0
Working capital……………………………………………………….
$ 10,587.0
$ 9,667.0
b.
Current assets ………………………………………………………………..
$ 16,061.0
$15,025.0
÷ Current liabilities ……………………………………………………….
5,474.0
5,358.0
Current ratio …………………………………………………………………..
2.9
2.8
c.
Quick assets:
Cash ……………………………………………………………………………
$ 3,808.0
$ 3,138.0
Short-term investments ………………………………………………..
2,371.0
2,319.0
Accounts receivable …………………………………………………….
3,677.0
3,241.0
Total quick assets ………………………………………………………
$ 9,856.0
$ 8,698.0
÷ Current liabilities ……………………………………………………….
5,474.0
5,358.0
Quick ratio ……………………………………………………………………..
1.8
1.6
d.
Sales ………………………………………………………………………………
$ 34,350.0
$ 32,376.0
Accounts receivable (net):
Beginning of year ……………………………………………………….
$ 3,241.0
$ 3,358.0
End of year ………………………………………………………………….
3,677.0
3,241.0
Total ……………………………………………………………………….
$ 6,918.0
$ 6,599.0
Average accounts receivable (Total ÷ 2) …………………………..
3,459.0
3,299.5
Accounts receivable turnover
(Sales ÷ Average accounts receivable) ………………………….
9.9
9.8
e.
Average daily sales:
Sales …………………………………………………………………………..
$ 34,350.0
$32,376.0
÷ 365 ………………………………………………………………………………
365
365
Average daily sales (Sales ÷ 365) …………………………..
94.1
88.7
Average accounts receivable (Total ÷ 2) …………………………..
3,459.0
3,299.5
÷ Average daily sales ………………………………………………………
94.1
88.7
Number of days’ sales in receivables …………………………..
36.8
37.2
f.
Cost of goods sold ……………………………………………………….
$ 19,038.0
$17,405.0
Inventories:
Beginning of year ……………………………………………………….
$ 4,838.0
$ 4,337.0
End of year ………………………………………………………………….
5,055.0
4,838.0
Total ………………………………………………………………………..
$ 9,893.0
$ 9,175.0
Average inventory (Total ÷ 2) …………………………………………..
4,946.5
4,587.5
Inventory turnover ……………………………………………………….
(Cost of goods sold ÷ Average inventory) …………………..
3.8
3.8
CHAPTER 14 Financial Statement Analysis
TIF 14–2 (Continued)
Fiscal
2017
Fiscal
2016
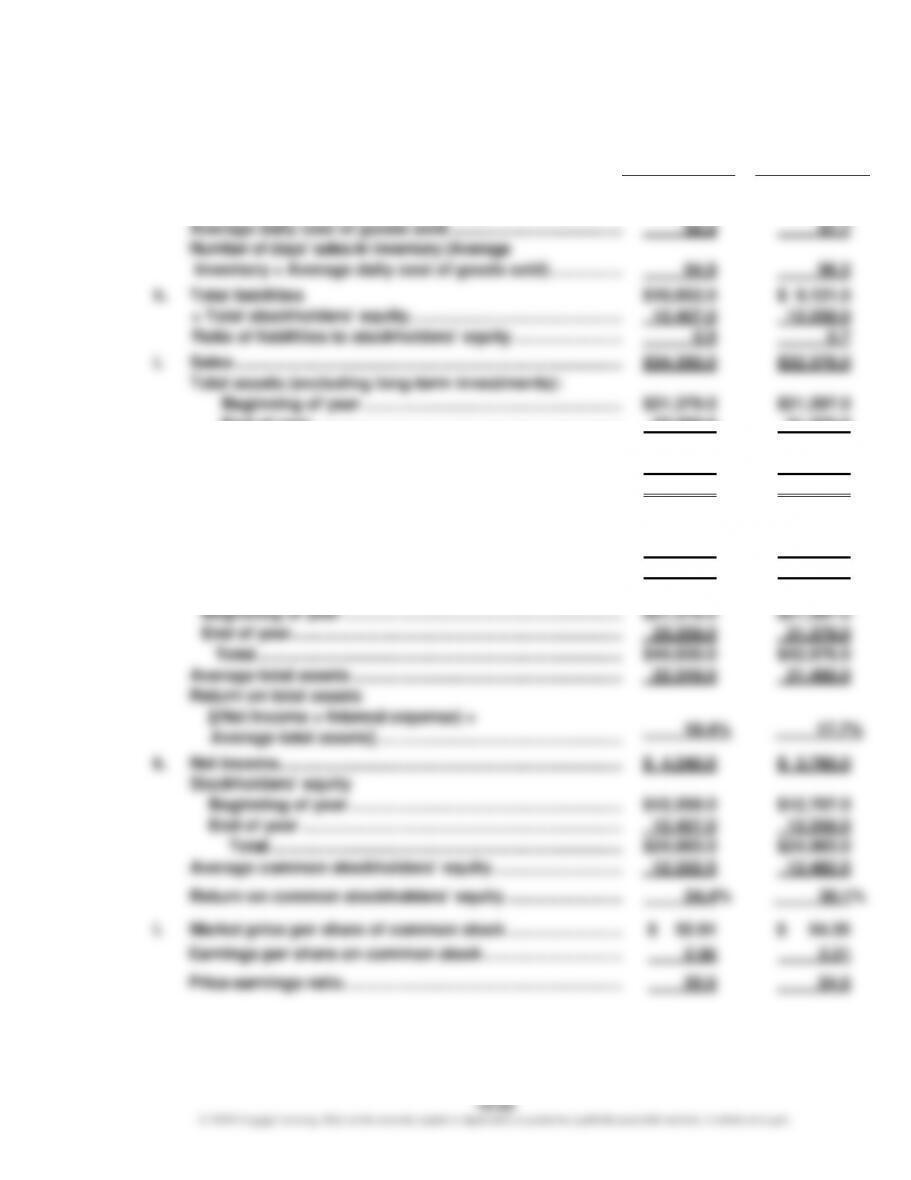
g.
Inventory (average) ……………………………………………………….
$ 4,946.5
$ 4,587.5
Cost of goods sold ……………………………………………………….
19,038.0
17,405.0
Average daily cost of goods sold …………………………………….
52.2
47.7
Number of days’ sales in inventory (Average
inventory ÷ Average daily cost of goods sold) …………………
94.8
96.2
h.
Total liabilities
$10,852.0
$ 9,121.0
÷ Total stockholders’ equity…………………………………………….
12,407.0
12,258.0
Ratio of liabilities to stockholders’ equity ………………………..
0.9
0.7
i.
Sales ……………………………………………………………………………..
$34,350.0
$32,376.0
Total assets (excluding long-term investments):
Beginning of year ……………………………………………………..
$21,379.0
$21,597.0
End of year ………………………………………………………………
23,259.0
21,379.0
Total ……………………………………………………………………..
$44,638.0
$42,976.0
Average total assets ……………………………………………………….
22,319.0
21,488.0
Asset turnover ………………………………………………………………..
1.5
1.5
j.
Net income……………………………………………………………………..
$ 4,240.0
$ 3,760.0
Interest expense ……………………………………………………………..
82.0
33.0
Total ………………………………………………………………………..
$ 4,322.0
$ 3,793.0
Total assets:
Beginning of year ……………………………………………………….
$21,379.0
$21,597.0
End of year …………………………………………………………………..
23,259.0
21,379.0
Total ………………………………………………………………………….
$44,638.0
$42,976.0
Average total assets ……………………………………………………….
22,319.0
21,488.0
Return on total assets
[(Net income + Interest expense) ÷
Average total assets] …………………………………………………..
19.4%
17.7%
k.
Net income……………………………………………………………………..
$ 4,240.0
$ 3,760.0
Stockholders’ equity
Beginning of year ……………………………………………………….
$12,258.0
$12,707.0
End of year …………………………………………………………………
12,407.0
12,258.0
Total ……………………………………………………………………….
$24,665.0
$24,965.0
Average common stockholders’ equity …………………………..
12,332.5
12,482.5
Return on common stockholders’ equity ………………………….
34.4%
30.1%
l.
Market price per share of common stock ………………………….
$ 52.81
$ 54.35
Earnings per share on common stock …………………………..
2.56
2.21
Price-earnings ratio ……………………………………………………….
20.6
24.6
14–54
TIF 14–2 (Concluded)
Fiscal
2017
Fiscal
2016
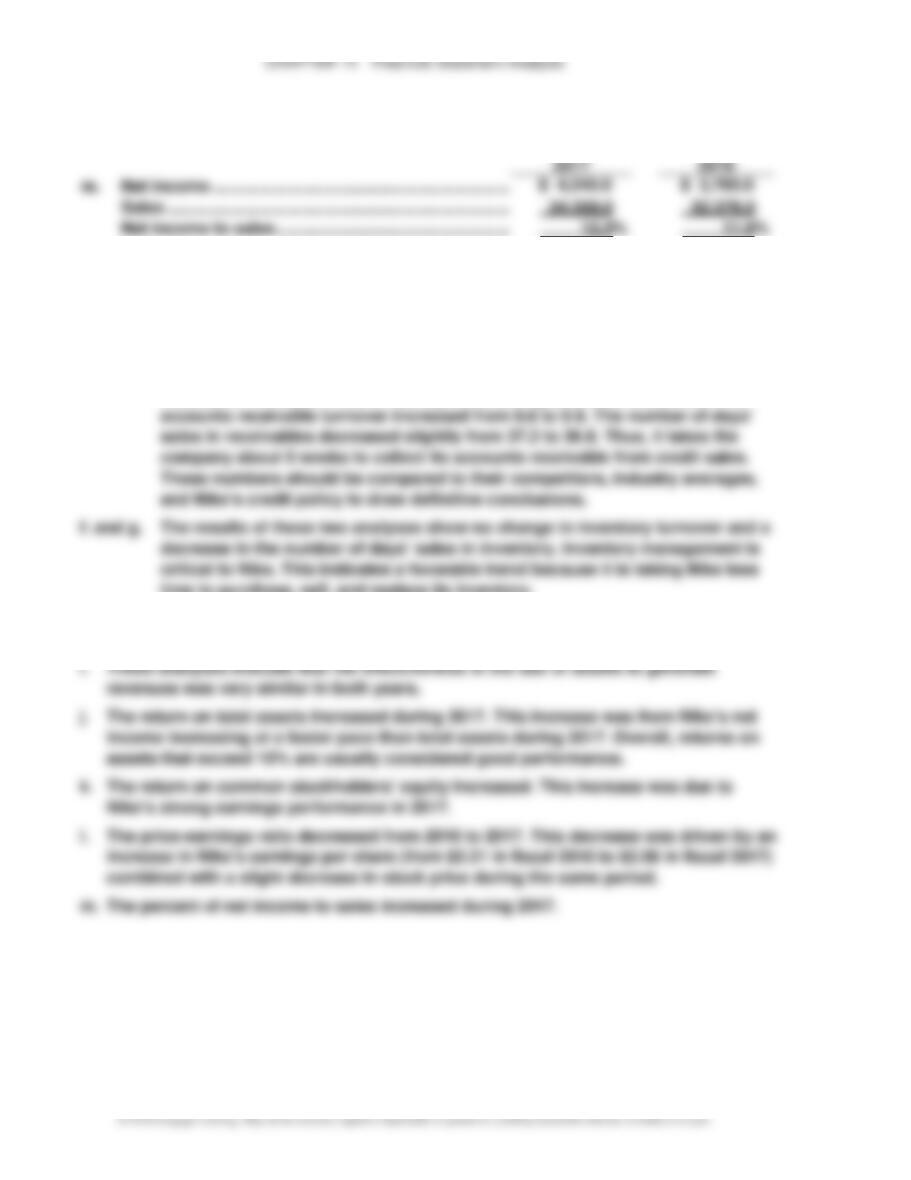
m.
Net income ……………………………………………………….
$ 4,240.0
$ 3,760.0
Sales ……………………………………………………………………………..
34,350.0
32,376.0
Net income to sales ……………………………………………………….
12.3%
11.6%
2. Before reaching definitive conclusions, each measure should be compared with past
years, industry averages, and similar firms in the industry.
a. The working capital increased between 2016 and 2017.
b. and c. The current and quick ratios both increased during 2017.
d. and e. The accounts receivable turnover and the number of days’ sales in receivables
indicate an increase in the efficiency of collecting accounts receivable. The
time to purchase, sell, and replace its inventory.
h. The margin of protection to creditors declined slightly as liabilities increased relative
to stockholders’ equity. Overall, Nike still provides sound protection to its creditors.
CHAPTER 14 Financial Statement Analysis
TIF 14–3
To: Boss Freeman
From: A+ Student
Re: Debt vs. Equity Financing
I have reviewed your company history and appreciate the challenges your company has faced
during economic downturns. While your conservative approach to debt financing is
commendable, your unwillingness to issue debt could limit your potential for future success.
Financing future growth exclusively through retained earnings and additional stock sales

14–56