14–1
CHAPTER 14
FINANCIAL STATEMENT ANALYSIS
DISCUSSION QUESTIONS
1. Liquidity is the ability of a company to convert assets into cash. Short-term creditors such as banks and
financial institutions are most concerned with liquidity. Solvency is the ability of a company to pay its
3. Before this question can be answered, the increase in net income should be compared with changes in sales,
4. Generally, the two ratios would be very close because most service businesses sell services and hold very
little inventory.
5. a. A high inventory turnover minimizes the amount invested in inventories, thus freeing funds for other
uses. Storage costs, administrative expenses, losses caused by obsolescence, and potential decreases in
6. The ratio of fixed assets to long-term liabilities increased from 3.4 ($1,360,000 ÷ $400,000) in the
7. a. The return on total assets measures the profitability of the total assets, without regard for how the assets
CHAPTER 14 Financial Statement Analysis
14–2
DISCUSSION QUESTIONS (Concluded)
8. The price-earnings ratio measures the market’s expectations of a company’s future earnings prospects.
9. The dividend yield measures the return common stockholders receive from a cash dividend. The high
10. One report is the Report on Internal Control, which verifies management’s conclusions on internal
CHAPTER 14 Financial Statement Analysis
BASIC EXERCISES
BE 14–1
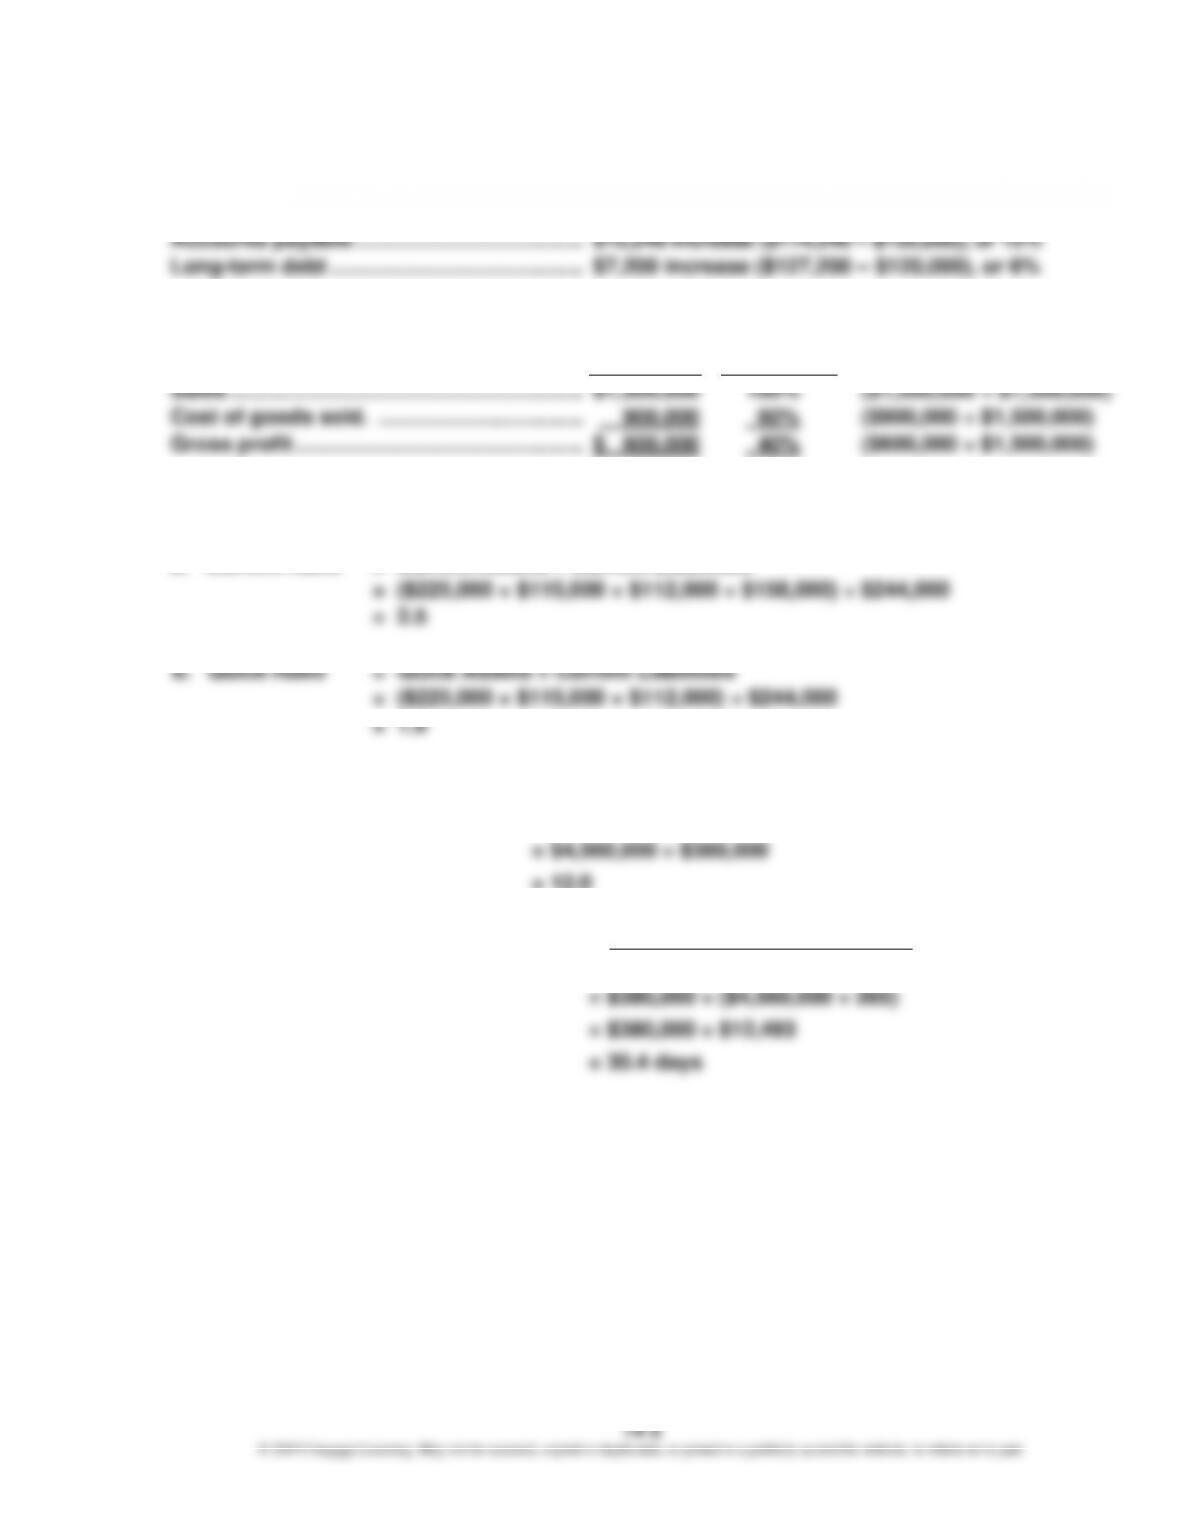
Accounts payable ……………………………….. $12,240 increase ($114,240 – $102,000), or 12%
Long-term debt …………………………………… $7,200 increase ($127,200 – $120,000), or 6%
BE 14–2
Amount
Percentage
Sales ………………………………………………….. $1,500,000
100% ($1,500,000 ÷ $1,500,000)
Cost of goods sold. ……………………………. 900,000
60% ($900,000 ÷ $1,500,000)
Gross profit ………………………………………… $ 600,000
40% ($600,000 ÷ $1,500,000)
BE 14–3
a. Current Ratio = Current Assets ÷ Current Liabilities
BE 14–4
a. Accounts Receivable Turnover = Sales ÷ Average Accounts Receivable
= 12.0
b.
Sales Daily Average
Receivable AccountsAverage
sReceivable in Sales Days’ of Number =
14–5
BE 14–8
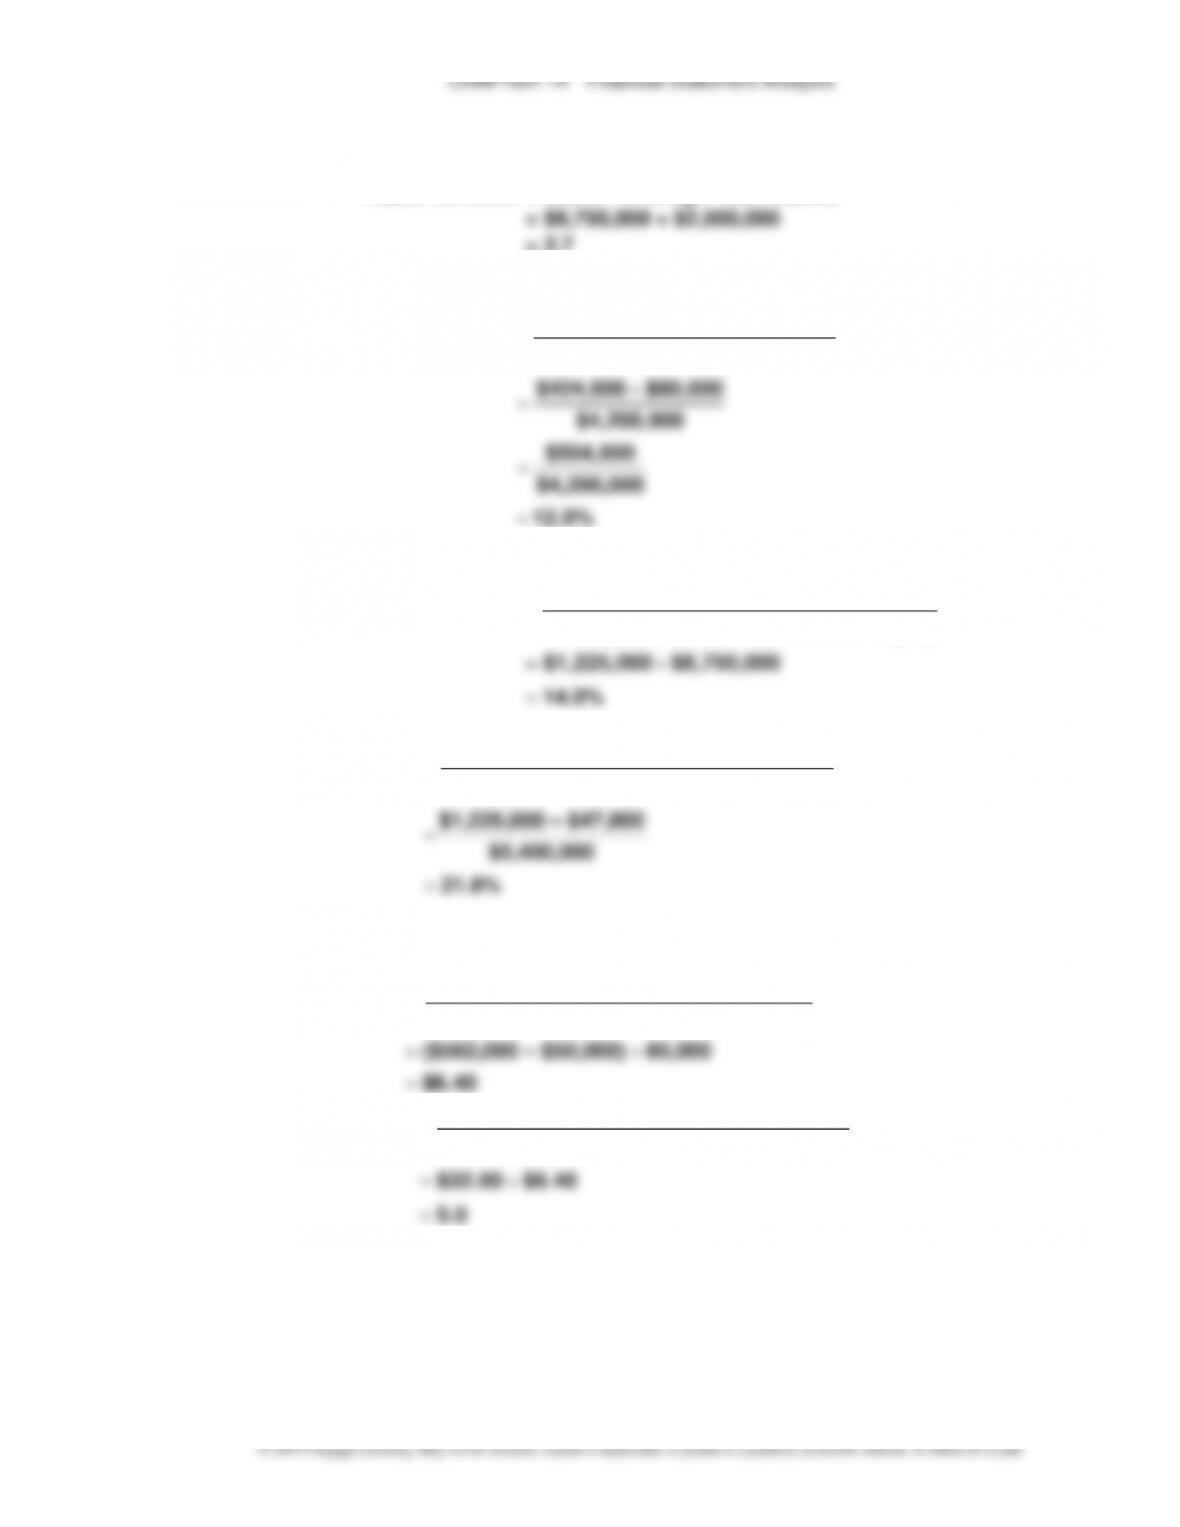
Asset Turnover = Sales ÷ Average Total Assets
= 2.7
BE 14–9
12.0%
$4,200,000
$504,000
$4,200,000
$80,000 $424,000
AssetsTotal Average
ExpenseInterest IncomeNet
AssetsTotal on Return
=
=
+
=
+
=
BE 14–10
a.
14.0%
Equity
rs’
Stockholde Common Average
IncomeNet
Equity
rs’
Stockholde on Return
=
=
b.
21.8%
$5,400,000
$47,800 – $1,225,000
Equity rs’Stockholde Common Average
Dividends Preferred – IncomeNet
Equity rs’Stockholde
Common on Return
=
=
BE 14–11
a.
gOutstandin Stock Common of Shares
Dividends Preferred – IncomeNet
Stock Common on
Share per Earnings =
80,000 $50,000) – ($562,000 =
$6.40=
b.
5.0
$6.40 $32.00
Stock Common on Share per Earnings
Stock Common of Share per PriceMarket
Ratio EarningsPrice
=
=
=–
CHAPTER 14 Financial Statement Analysis
14–6
EXERCISES
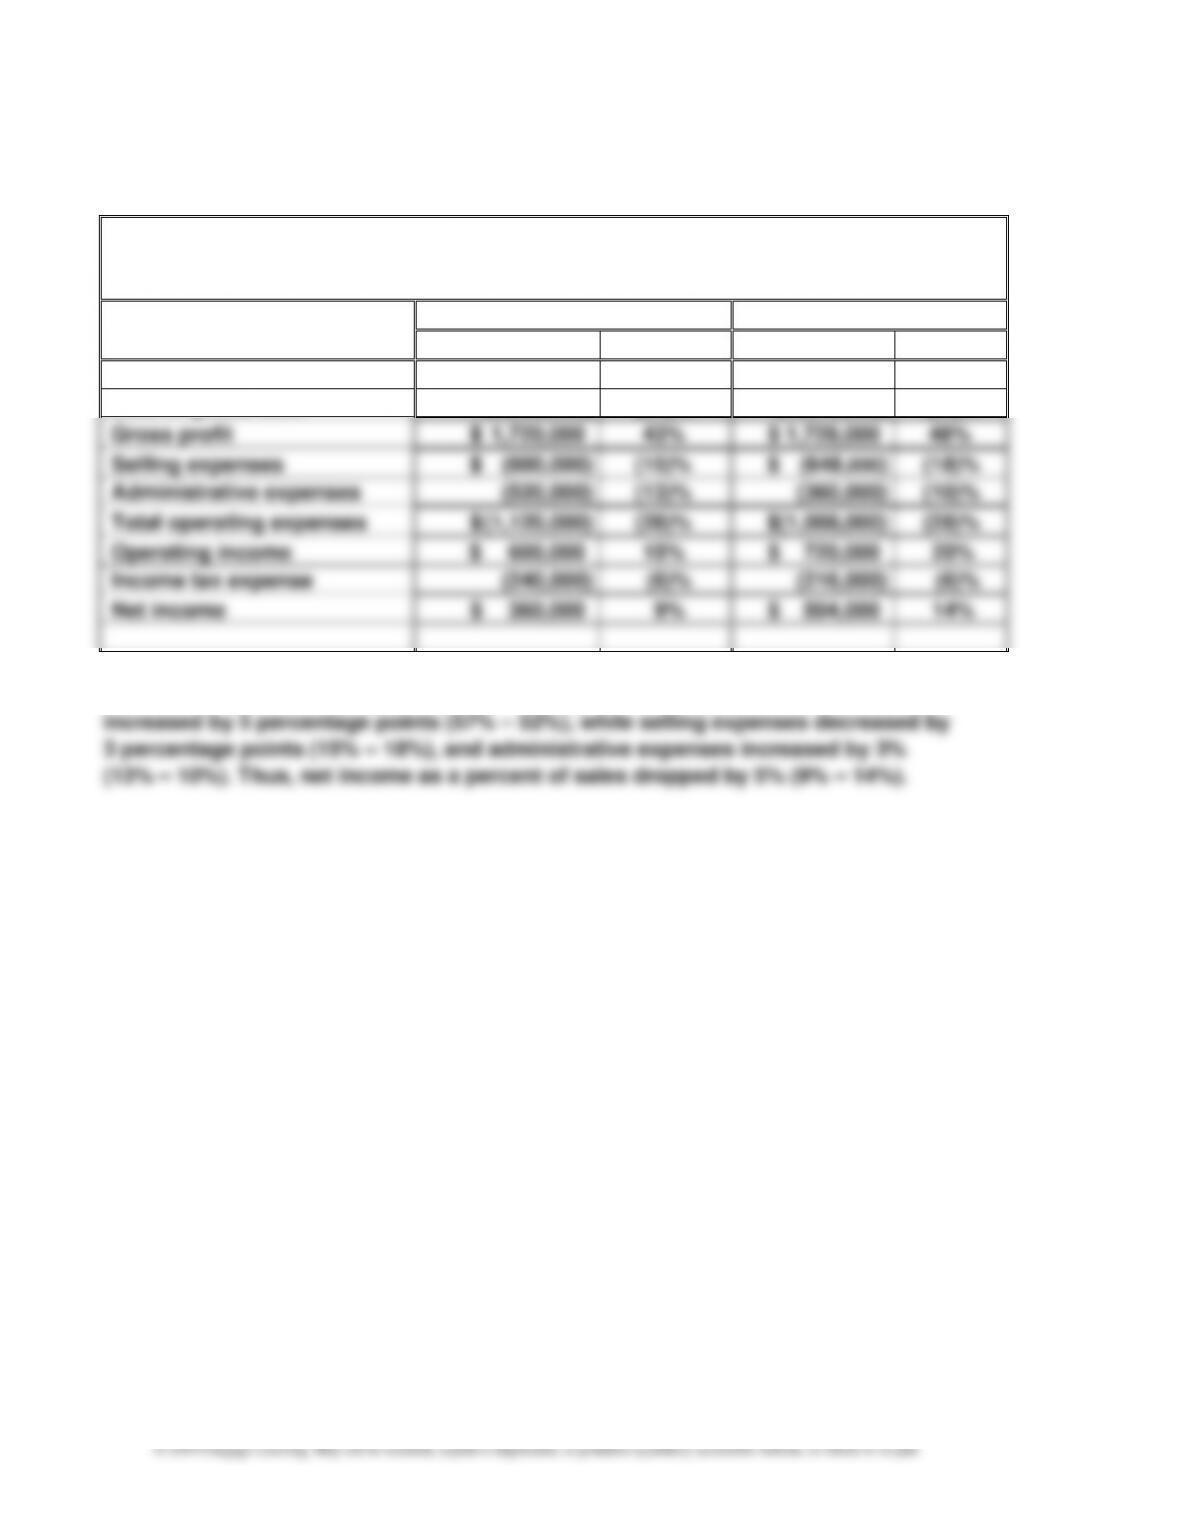
Ex. 14–1
a.
Innovation Quarter Inc.
Comparative Income Statement
For the Years Ended December 31
Current Year
Previous Year
Amount
Percent
Amount
Percent
Sales
$ 4,000,000
100%
$ 3,600,000
100%
Cost of goods sold
(2,280,000)
(57)%
(1,872,000)
(52)%
Gross profit
$ 1,720,000
43%
$ 1,728,000
48%
Selling expenses
$ (600,000)
(15)%
$ (648,000)
(18)%
Administrative expenses
(520,000)
(13)%
(360,000)
(10)%
Total operating expenses
$ (1,120,000)
(28)%
$(1,008,000)
(28)%
Operating income
$ 600,000
15%
$ 720,000
20%
Income tax expense
(240,000)
(6)%
(216,000)
(6)%
Net income
$ 360,000
9%
$ 504,000
14%
b. The vertical analysis indicates that the cost of goods sold as a percent of sales
CHAPTER 14 Financial Statement Analysis
14–7
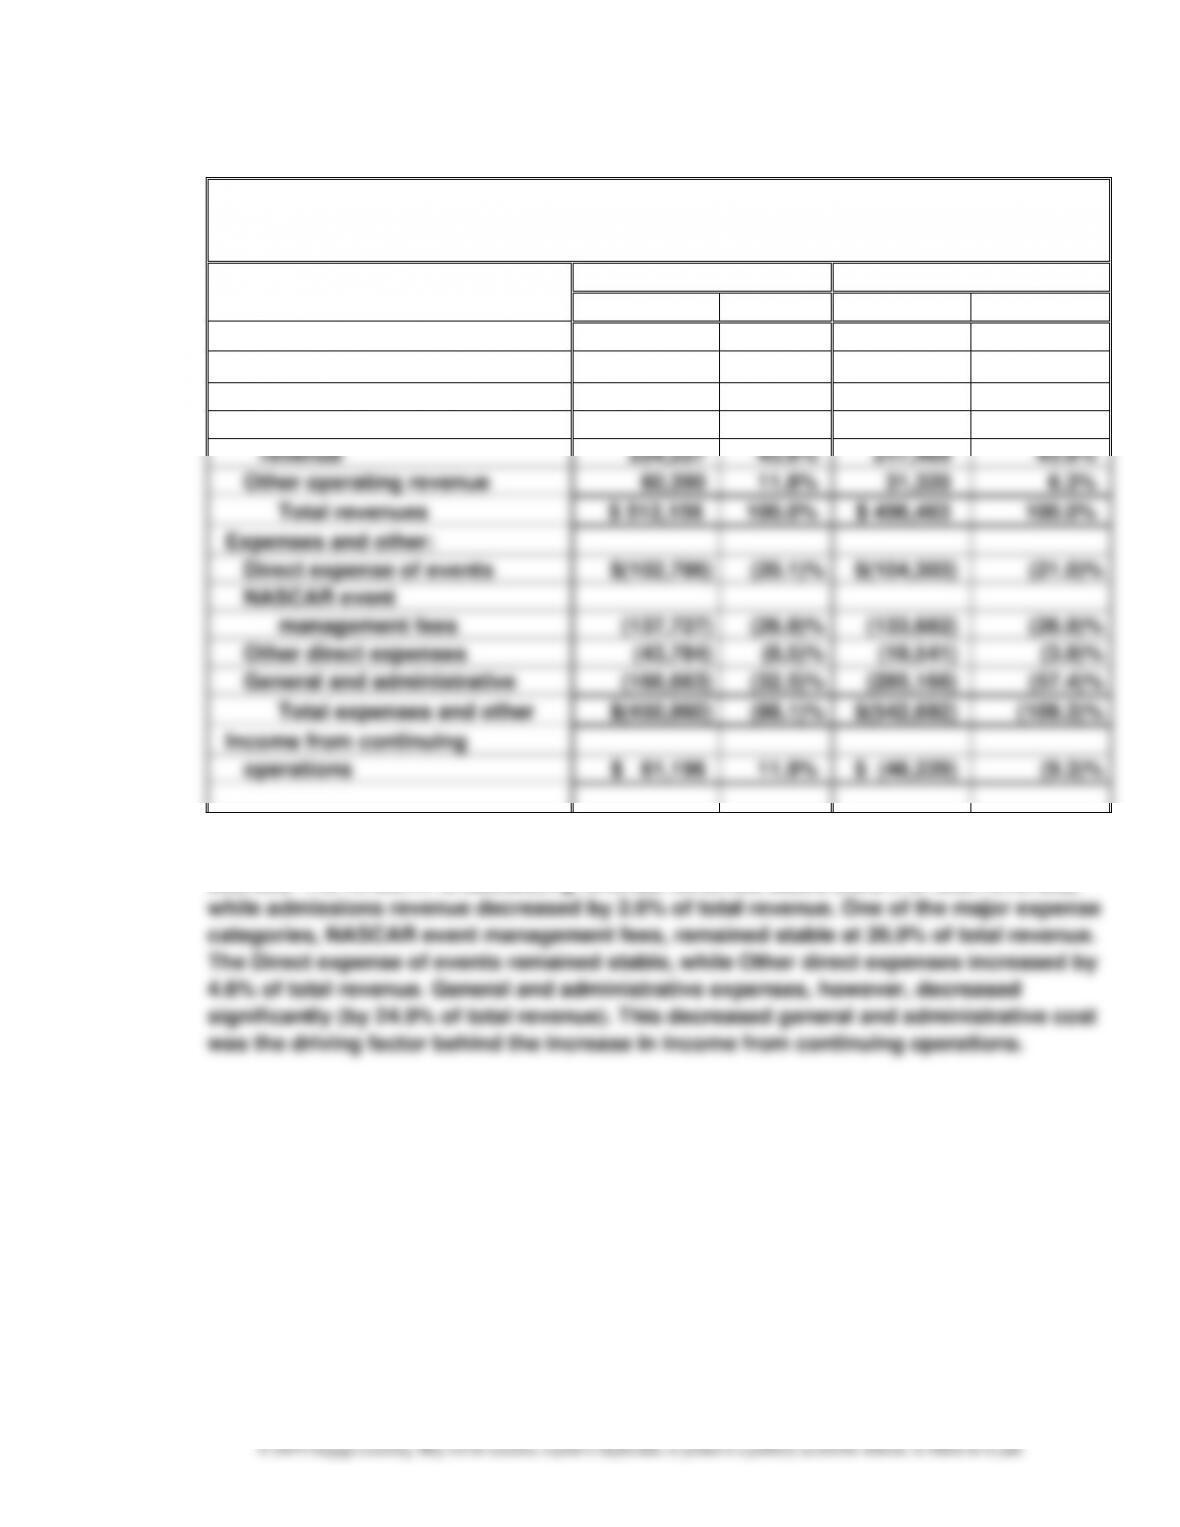
Ex. 14–2
a.
Speedway Motorsports, Inc.
Comparative Income Statement (in thousands of dollars)
For the Years Ended December 31
Current Year
Prior Year
Amount
Percent
Amount
Percent
Revenues:
Admissions
$ 90,639
17.7%
$ 100,694
20.3%
Event-related revenue
136,900
26.7%
146,980
29.6%
NASCAR broadcasting
revenue
224,227
43.8%
217,469
43.8%
Other operating revenue
60,390
11.8%
31,320
6.3%
Total revenues
$ 512,156
100.0%
$ 496,463
100.0%
Expenses and other:
Direct expense of events
$(102,786)
(20.1)%
$(104,303)
(21.0)%
NASCAR event
management fees
(137,727)
(26.9)%
(133,682)
(26.9)%
Other direct expenses
(43,784)
(8.5)%
(19,541)
(3.9)%
General and administrative
(166,663)
(32.5)%
(285,166)
(57.4)%
Total expenses and other
$(450,960)
(88.1)%
$(542,692)
(109.3)%
Income from continuing
operations
$ 61,196
11.9%
$ (46,229)
(9.3)%
b. Overall revenue increased between the two years, with changes in the mix of revenue
sources. The NASCAR broadcasting revenue remained stable (43.8% of total revenue),
CHAPTER 14 Financial Statement Analysis
14–8
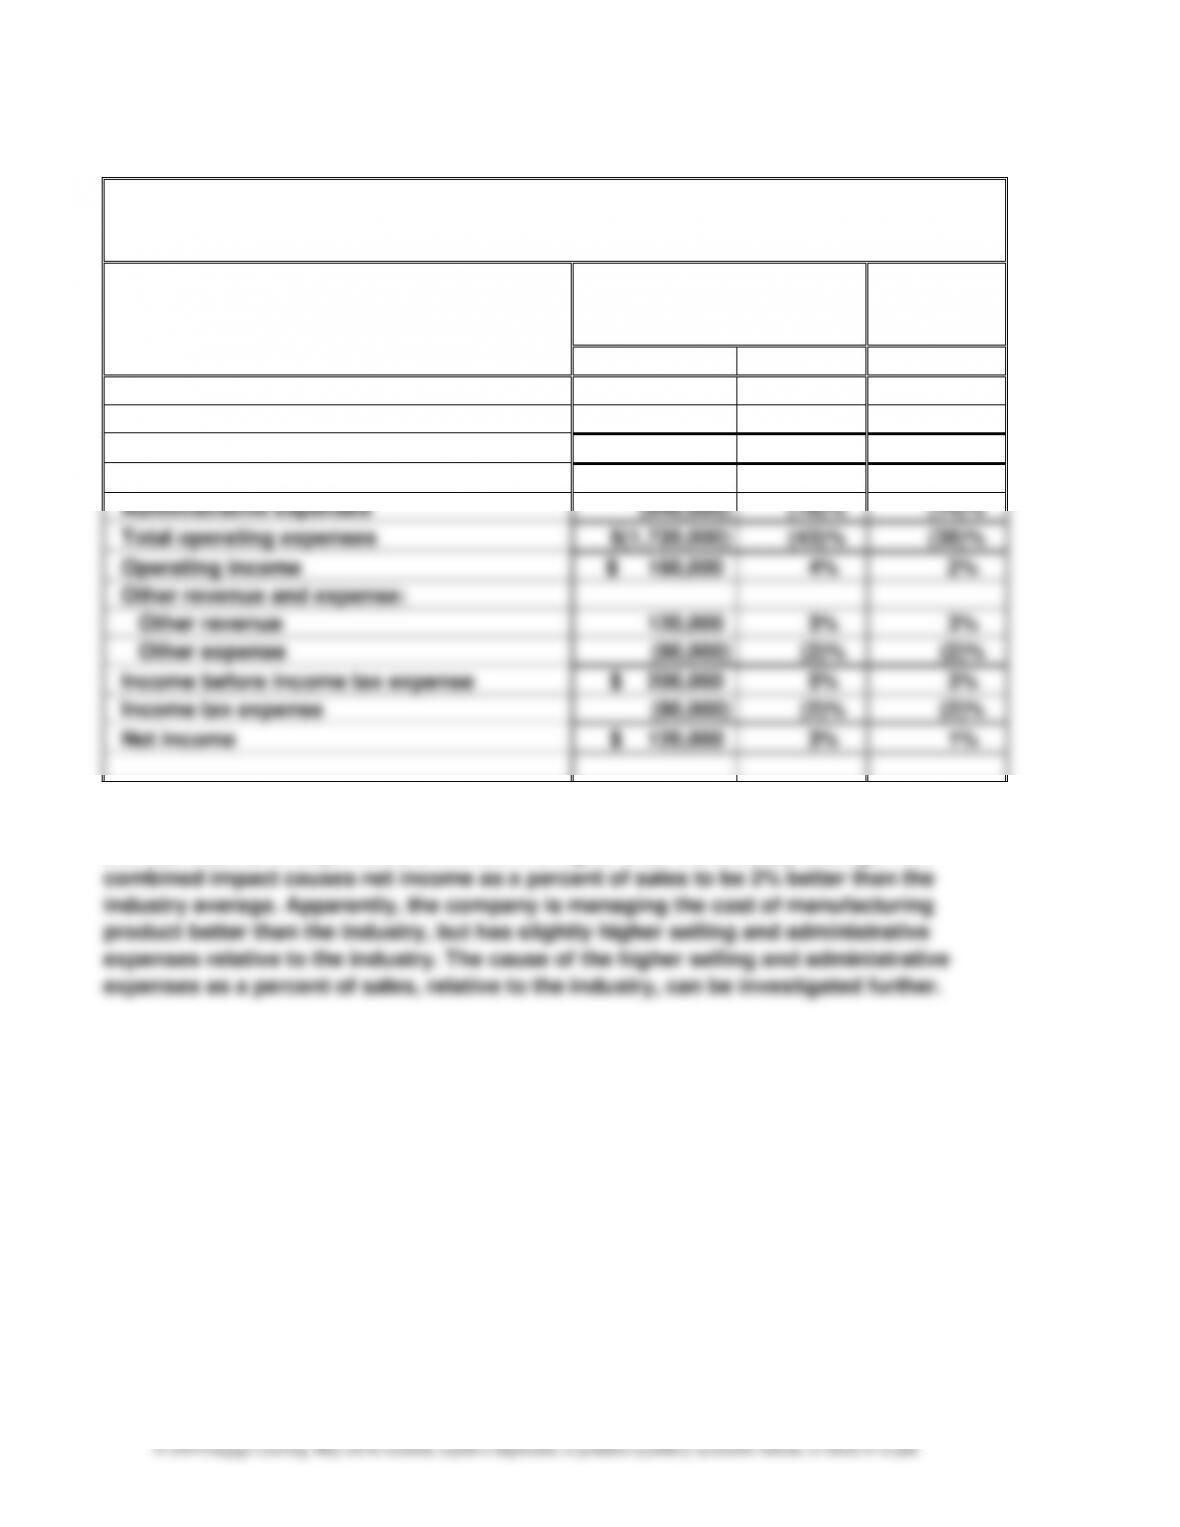
Ex. 14–3
a.
Tannenhill Company
Common-Sized Income Statement
For the Year Ended December 31
Tannenhill
Company
Electronics
Industry
Average
Amount
Percent
Sales
$ 4,000,000
100%
100%
Cost of goods sold
(2,120,000)
(53)%
(60)%
Gross profit
$ 1,880,000
47%
40%
Selling expenses
$(1,080,000)
(27)%
(24)%
Administrative expenses
(640,000)
(16)%
(14)%
Total operating expenses
$(1,720,000)
(43)%
(38)%
Operating income
$ 160,000
4%
2%
Other revenue and expense:
Other revenue
120,000
3%
3%
Other expense
(80,000)
(2)%
(2)%
Income before income tax expense
$ 200,000
5%
3%
Income tax expense
(80,000)
(2)%
(2)%
Net income
$ 120,000
3%
1%
b. The cost of goods sold is 7% lower than the industry average, but the selling expenses
and administrative expenses are 3% and 2% higher than the industry average. The
CHAPTER 14 Financial Statement Analysis
14–9
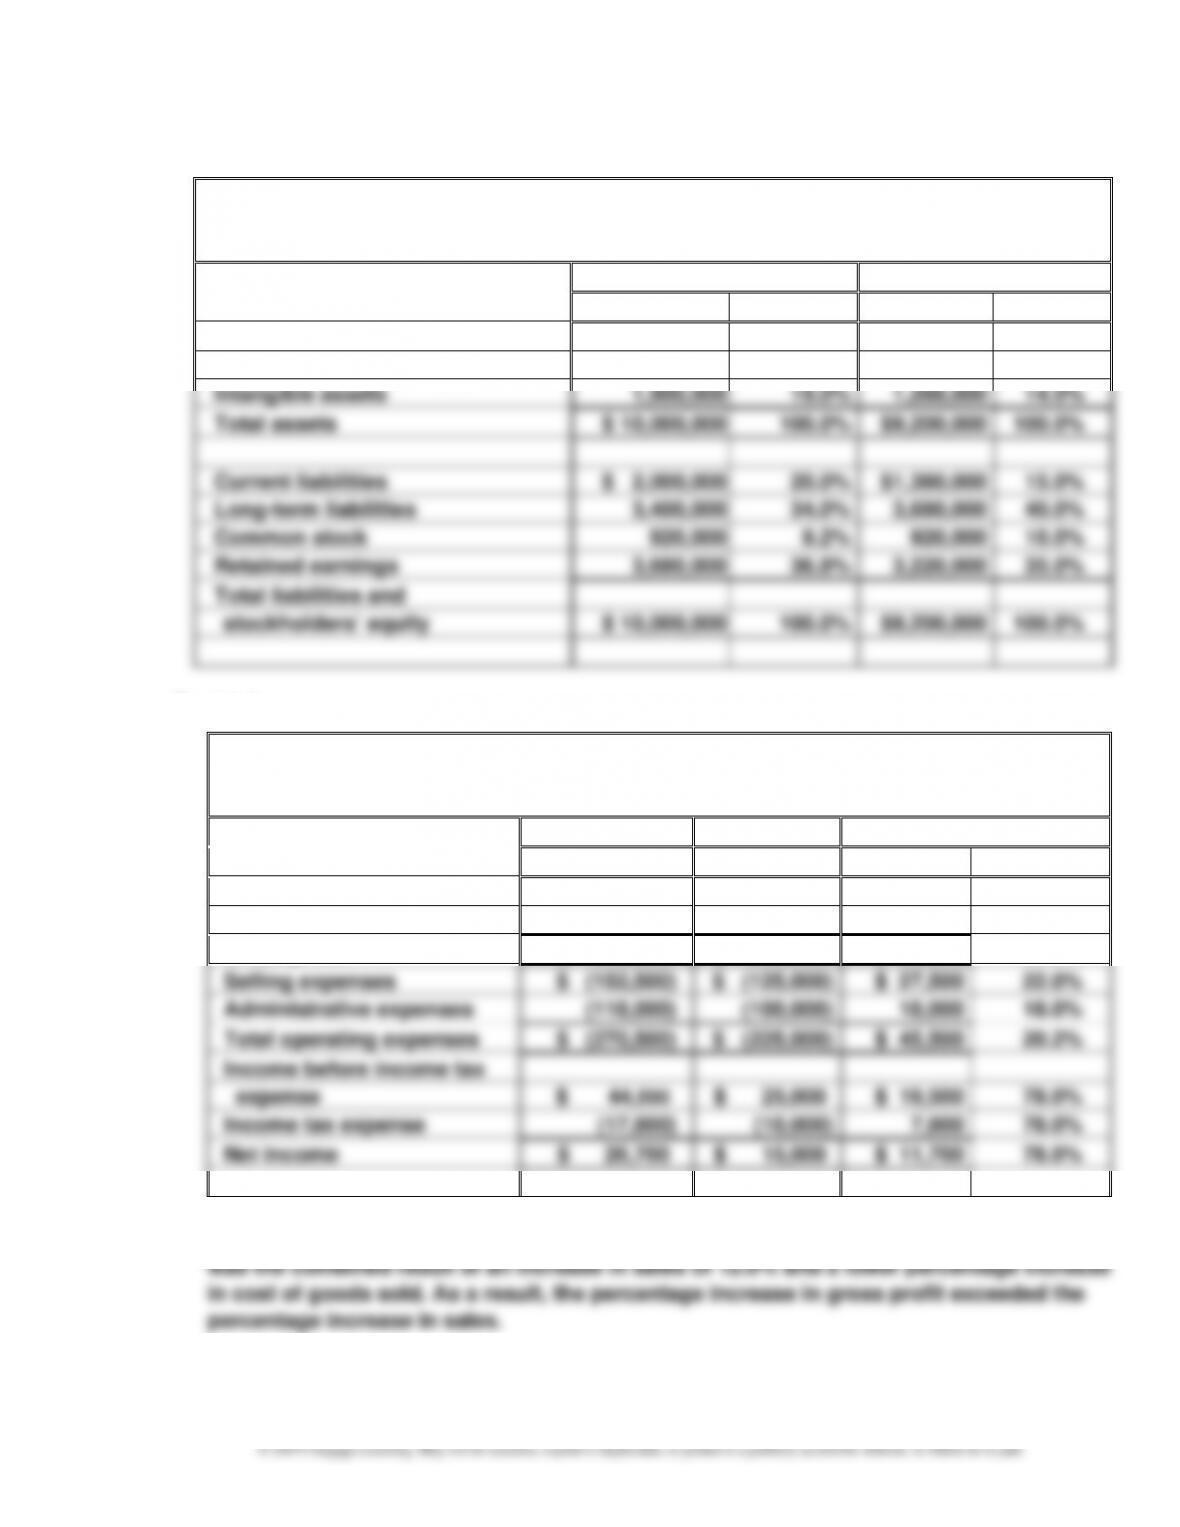
Ex. 14–4
Alvarez Company
Comparative Balance Sheet
For the Years Ended December 31
Current Year
Previous Year
Amount
Percent
Amount
Percent
Current assets
$ 2,500,000
25.0%
$1,840,000
20.0%
Property, plant, and equipment
5,600,000
56.0%
6,072,000
66.0%
Intangible assets
1,900,000
19.0%
1,288,000
14.0%
Total assets
$ 10,000,000
100.0%
$9,200,000
100.0%
Current liabilities
$ 2,000,000
20.0%
$1,380,000
15.0%
Long-term liabilities
3,400,000
34.0%
3,680,000
40.0%
Common stock
920,000
9.2%
920,000
10.0%
Retained earnings
3,680,000
36.8%
3,220,000
35.0%
Total liabilities and
stockholders’ equity
$ 10,000,000
100.0%
$9,200,000
100.0%
Ex. 14–5
a.
Winthrop Company
Comparative Income Statement
For the Years Ended December 31
Current Year
Previous Year
Increase/(Decrease)
Amount
Amount
Amount
Percent
Sales
$ 2,240,000
$ 2,000,000
$240,000
12.0%
Cost of goods sold
(1,925,000)
(1,750,000)
175,000
10.0%
Gross profit
$ 315,000
$ 250,000
$ 65,000
26.0%
Selling expenses
$ (152,500)
$ (125,000)
$ 27,500
22.0%
Administrative expenses
(118,000)
(100,000)
18,000
18.0%
Total operating expenses
$ (270,500)
$ (225,000)
$ 45,500
20.2%
Income before income tax
expense
$ 44,500
$ 25,000
$ 19,500
78.0%
Income tax expense
(17,800)
(10,000)
7,800
78.0%
Net income
$ 26,700
$ 15,000
$ 11,700
78.0%
b. The net income for Winthrop Company increased by 78.0% between years. This increase
CHAPTER 14 Financial Statement Analysis
14–10
Ex. 14–6
a. (1) Working Capital = Current Assets – Current Liabilities
1.6
$900,000
$1,440,000
:Year Previous2.1
$1,000,000
$2,090,000
:YearCurrent
==
1.2
$900,000
$1,080,000
:Year Previous1.5
$1,000,000
$1,540,000
:YearCurrent
sLiabilitieCurrent
AssetsQuick
Ratio Quick(3)
==
=
b. The liquidity of Nilo has improved from the preceding year to the current year. The
working capital, current ratio, and quick ratio have all increased. Most of these changes
are the result of an increase in current assets relative to current liabilities.
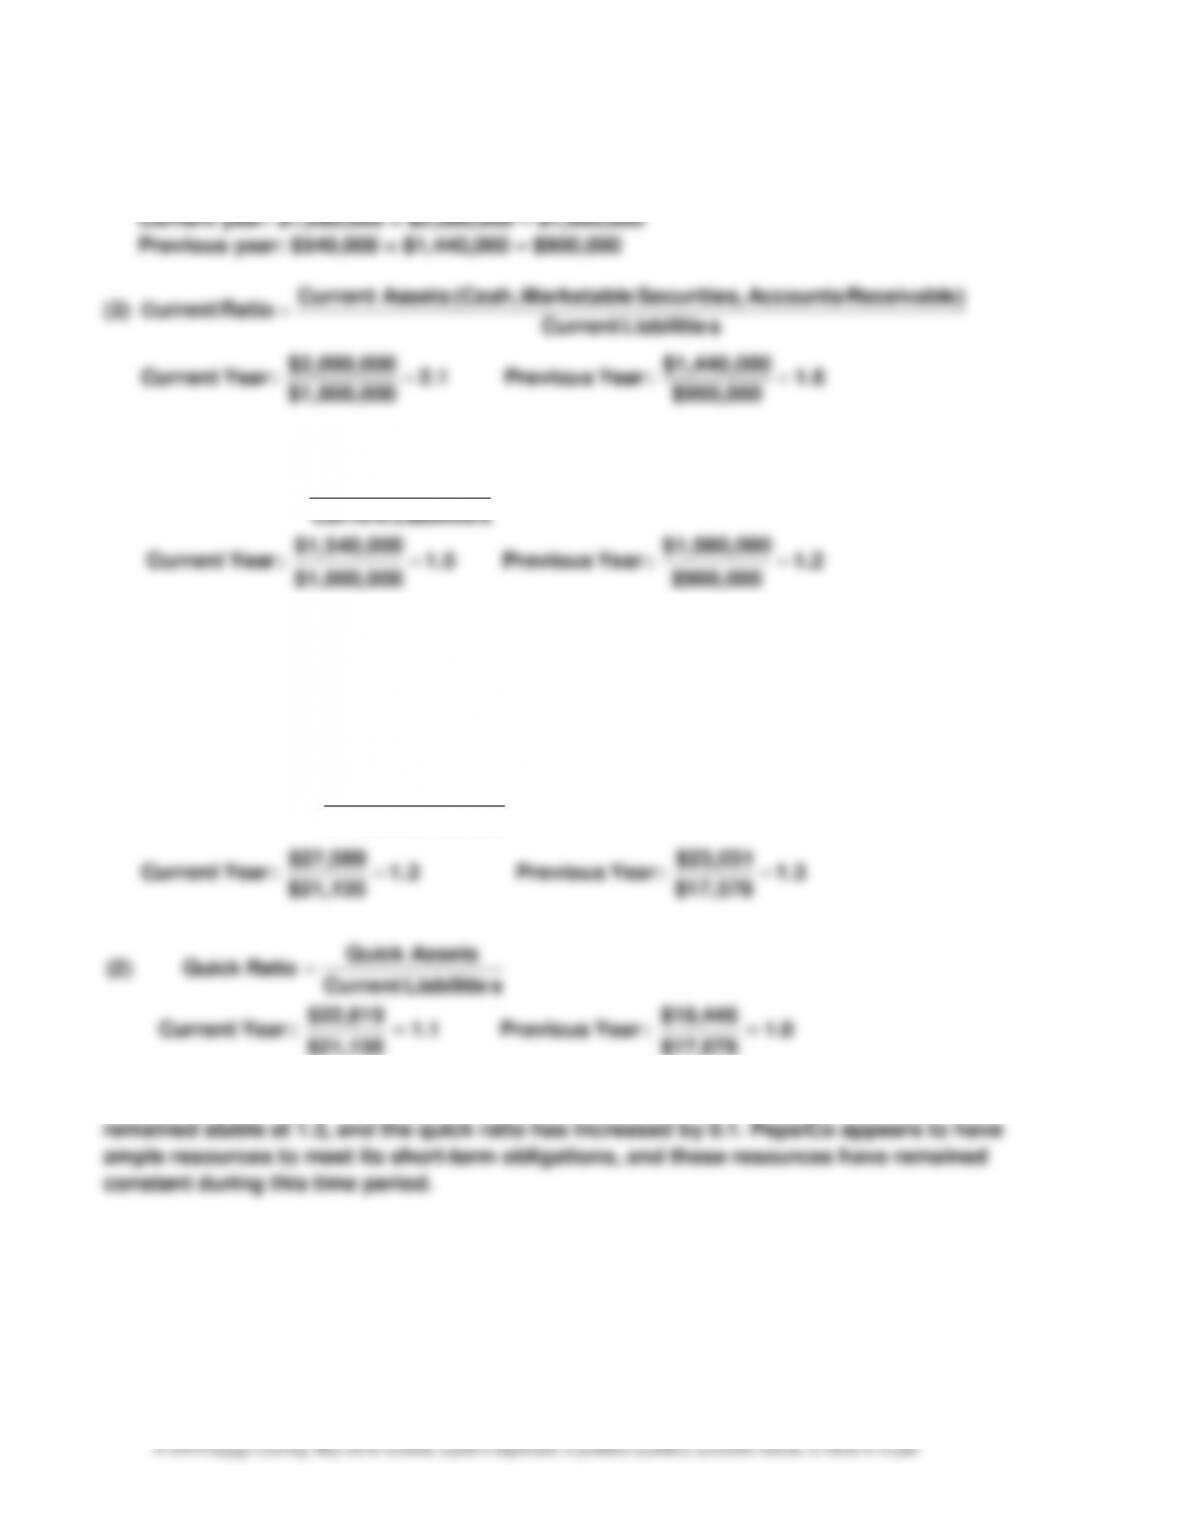
Ex. 14–7
a. (1)
1.3
$17,578
$23,031
:Year Previous1.3
$21,135
$27,089
:YearCurrent
sLiabilitieCurrent
setsCurrent As
RatioCurrent
==
=
1.0
$17,578
$18,446
:Year Previous1.1
$21,135
$22,819
:YearCurrent
sLiabilitieCurrent
AssetsQuick
Ratio Quick(2)
==
=
b. The liquidity of PepsiCo has increased slightly over this time period. The current ratio has
CHAPTER 14 Financial Statement Analysis
14–11
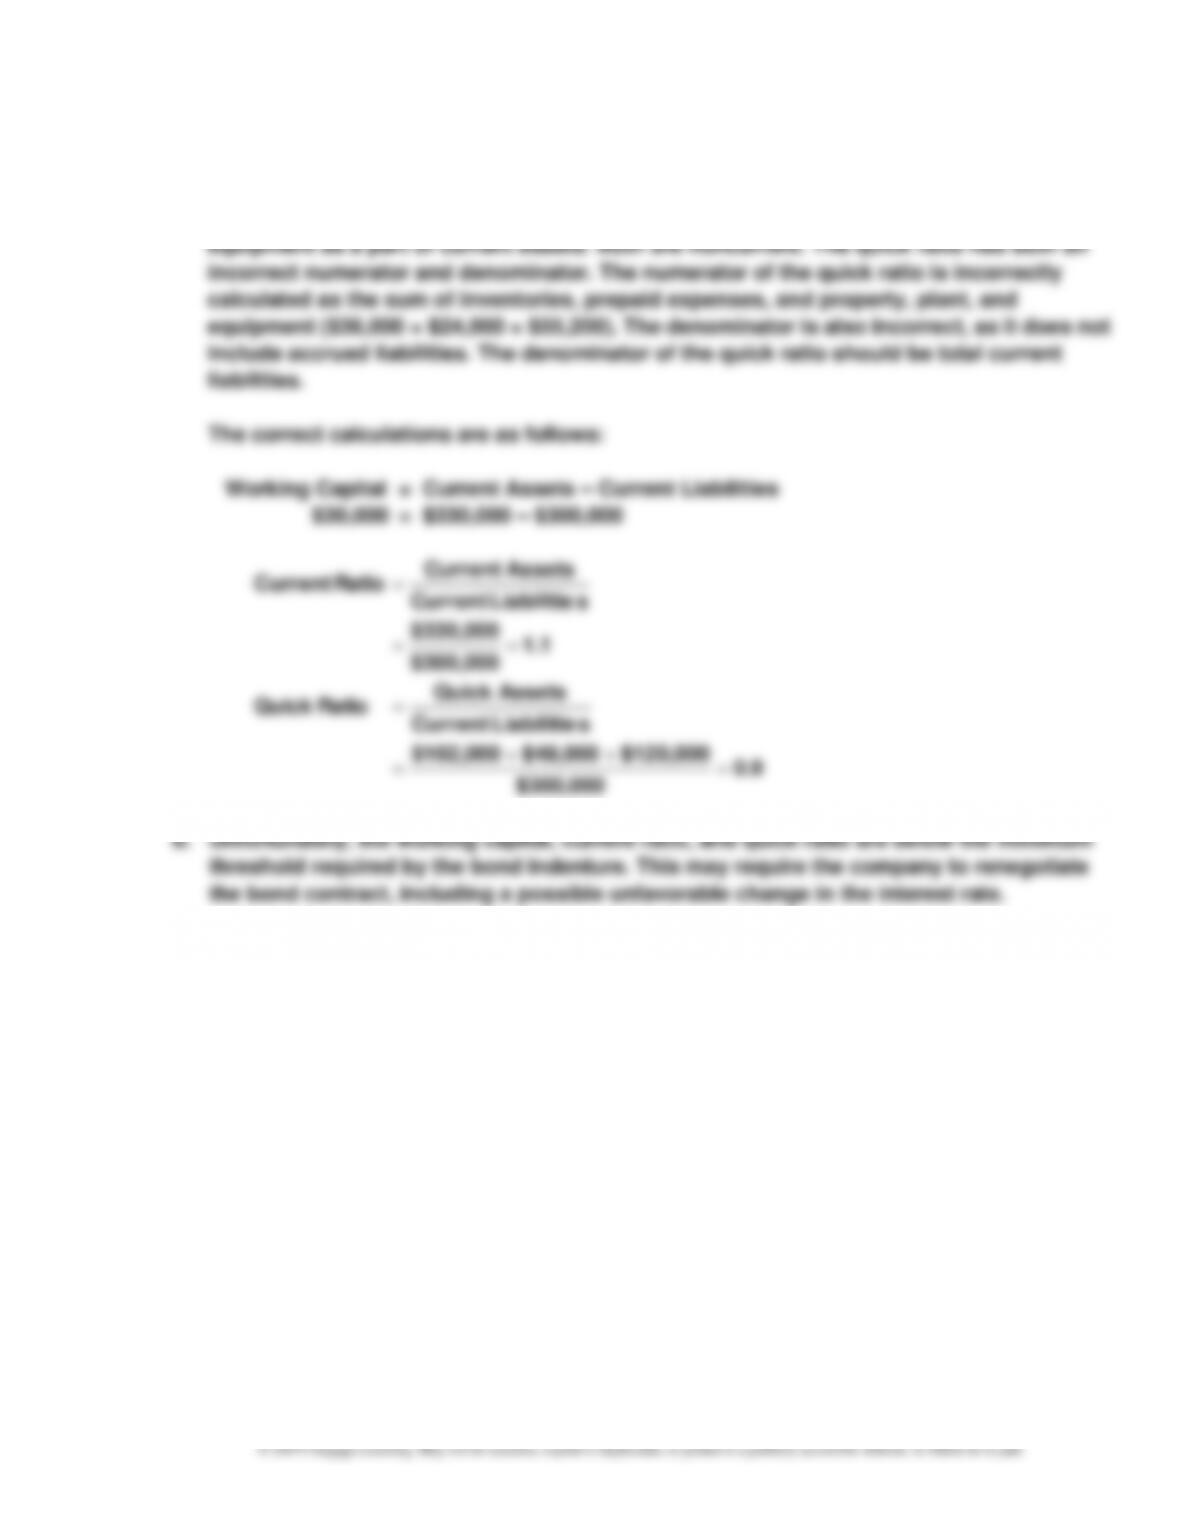
Ex. 14–8
a. The working capital, current ratio, and quick ratio are calculated incorrectly. The working
capital and current ratio incorrectly include intangible assets and property, plant, and
0.9
$300,000
$120,000 $48,000 $102,000
=
++
=
CHAPTER 14 Financial Statement Analysis
14–12
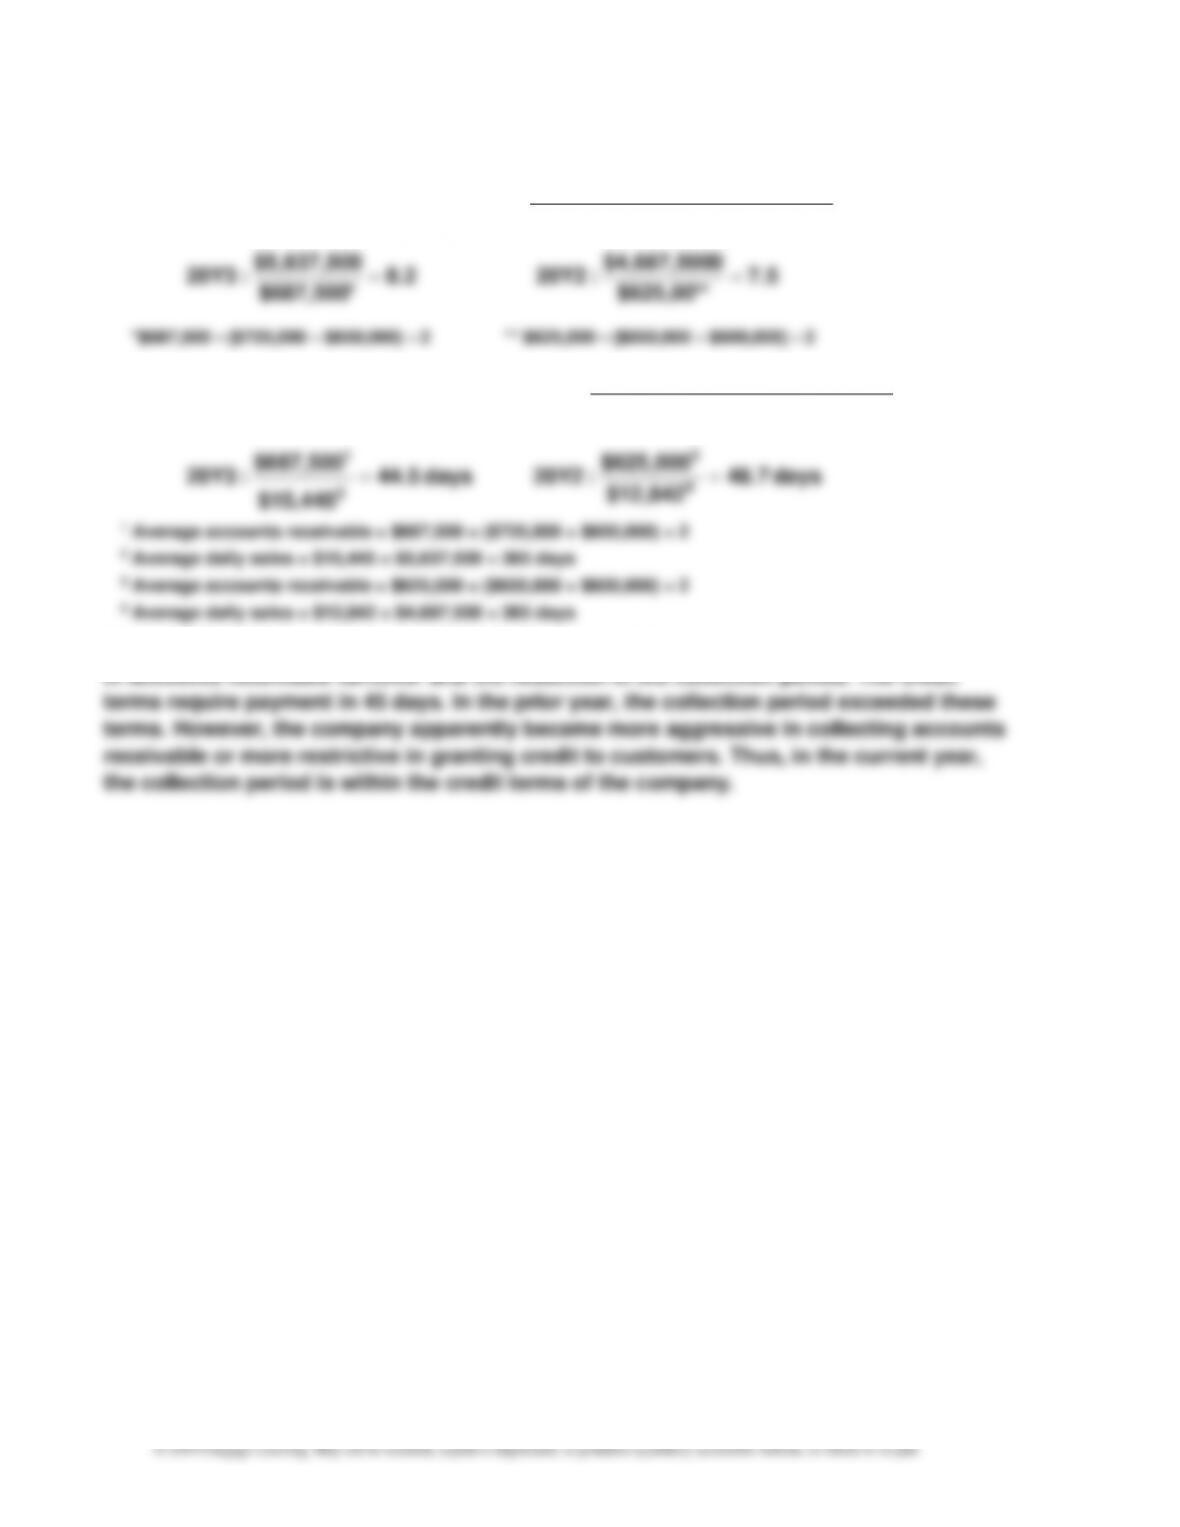
Ex. 14–9
a.
days 48.7
$12,842
$625,000
:20Y2days 44.5
$15,445
$687,500
:20Y3
Sales Daily Average
Receivable AccountsAverage
sReceivable in Sales Days’ of Number(2)
7.5
**$625,00
0$4,687,500
:20Y28.2
*$687,500
$5,637,500
:20Y3
Receivable AccountsAverage
Sales
Turnover Receivable Accounts(1)
4
3
2
1
2 $600,000) ($650,000 $625,000 **2 $650,000) ($725,000 $687,500*
==
=
==
=
+=+=
1 Average accounts receivable = $687,500 = ($725,000 + $650,000) ÷ 2
2 Average daily sales = $15,445 = $5,637,500 ÷ 365 days
3 Average accounts receivable = $625,000 = ($650,000 + $600,000) ÷ 2
4 Average daily sales = $12,842 = $4,687,500 ÷ 365 days
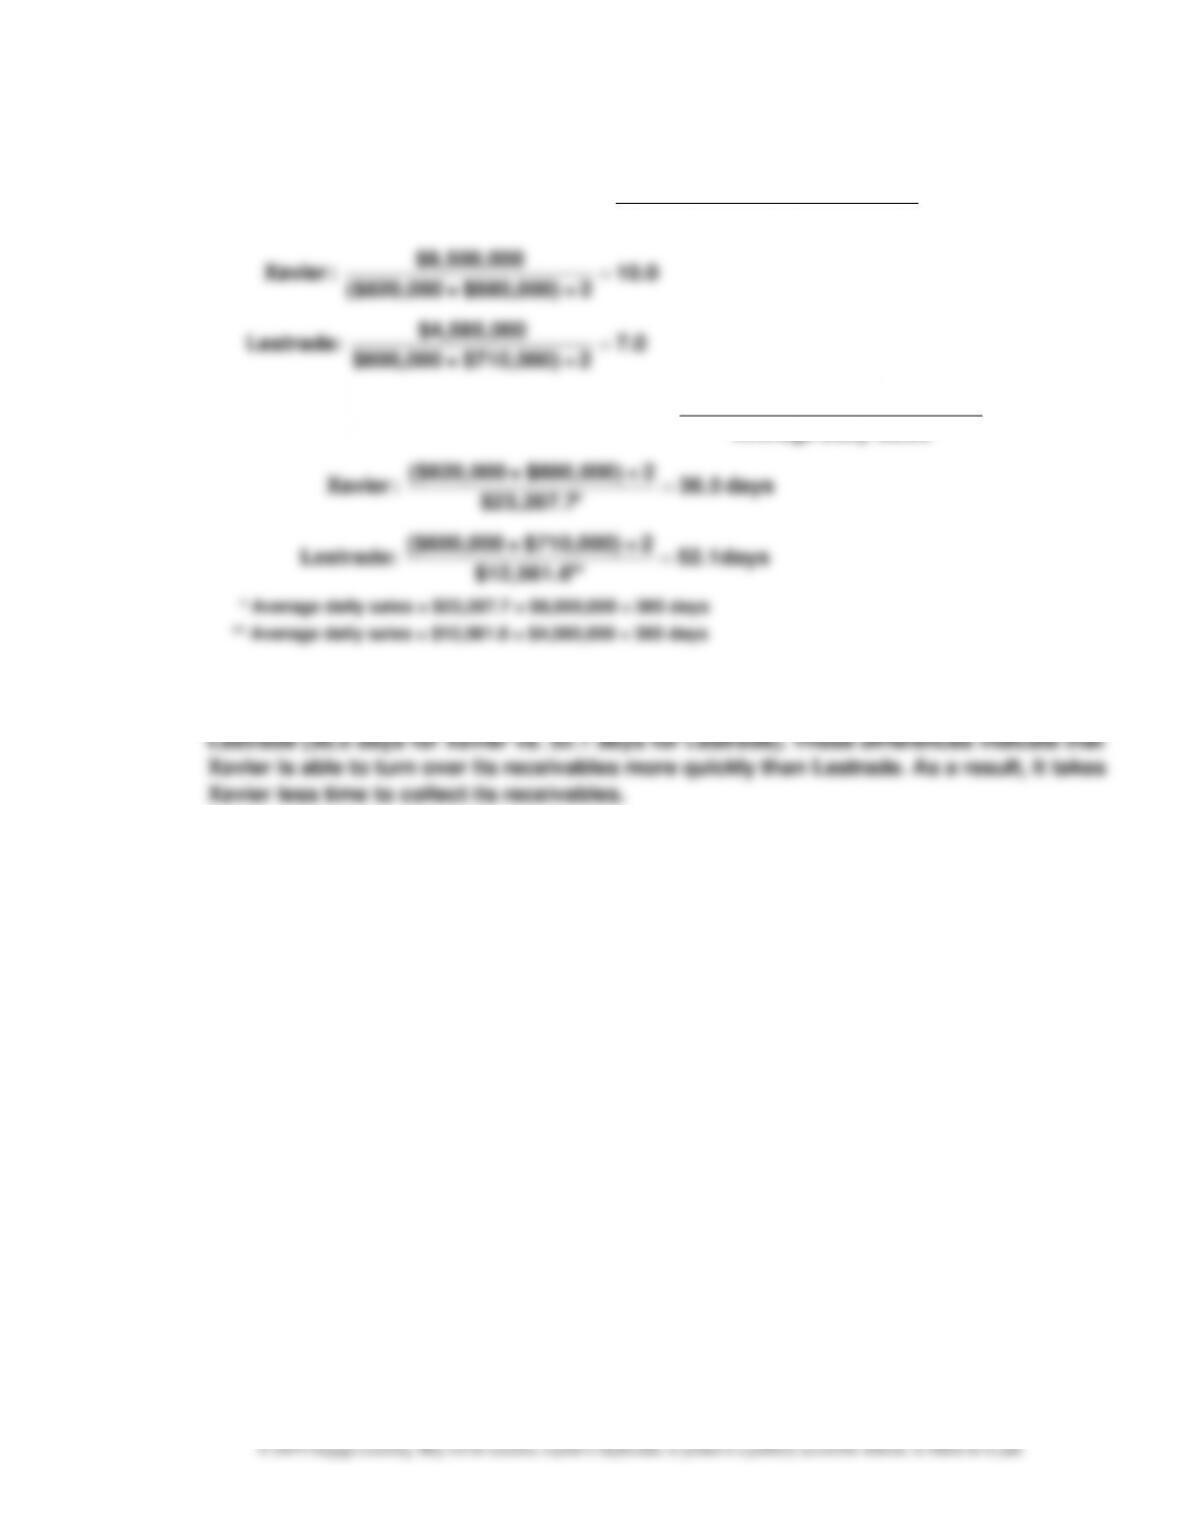
b. The collection of accounts receivable has improved. This can be seen in both the increase
CHAPTER 14 Financial Statement Analysis
14–13
Ex. 14–10
a.
Receivable AccountsAverage
Sales
=Turnover Receivable Accounts(1)
CHAPTER 14 Financial Statement Analysis
14–14
Ex. 14–11
a.
12.0
2 ÷ $860,000) + ($940,000
0$10,800,00
:Year Previous
9.0
2 ÷ $940,000) + 0($1,120,00
$9,270,000
:YearCurrent
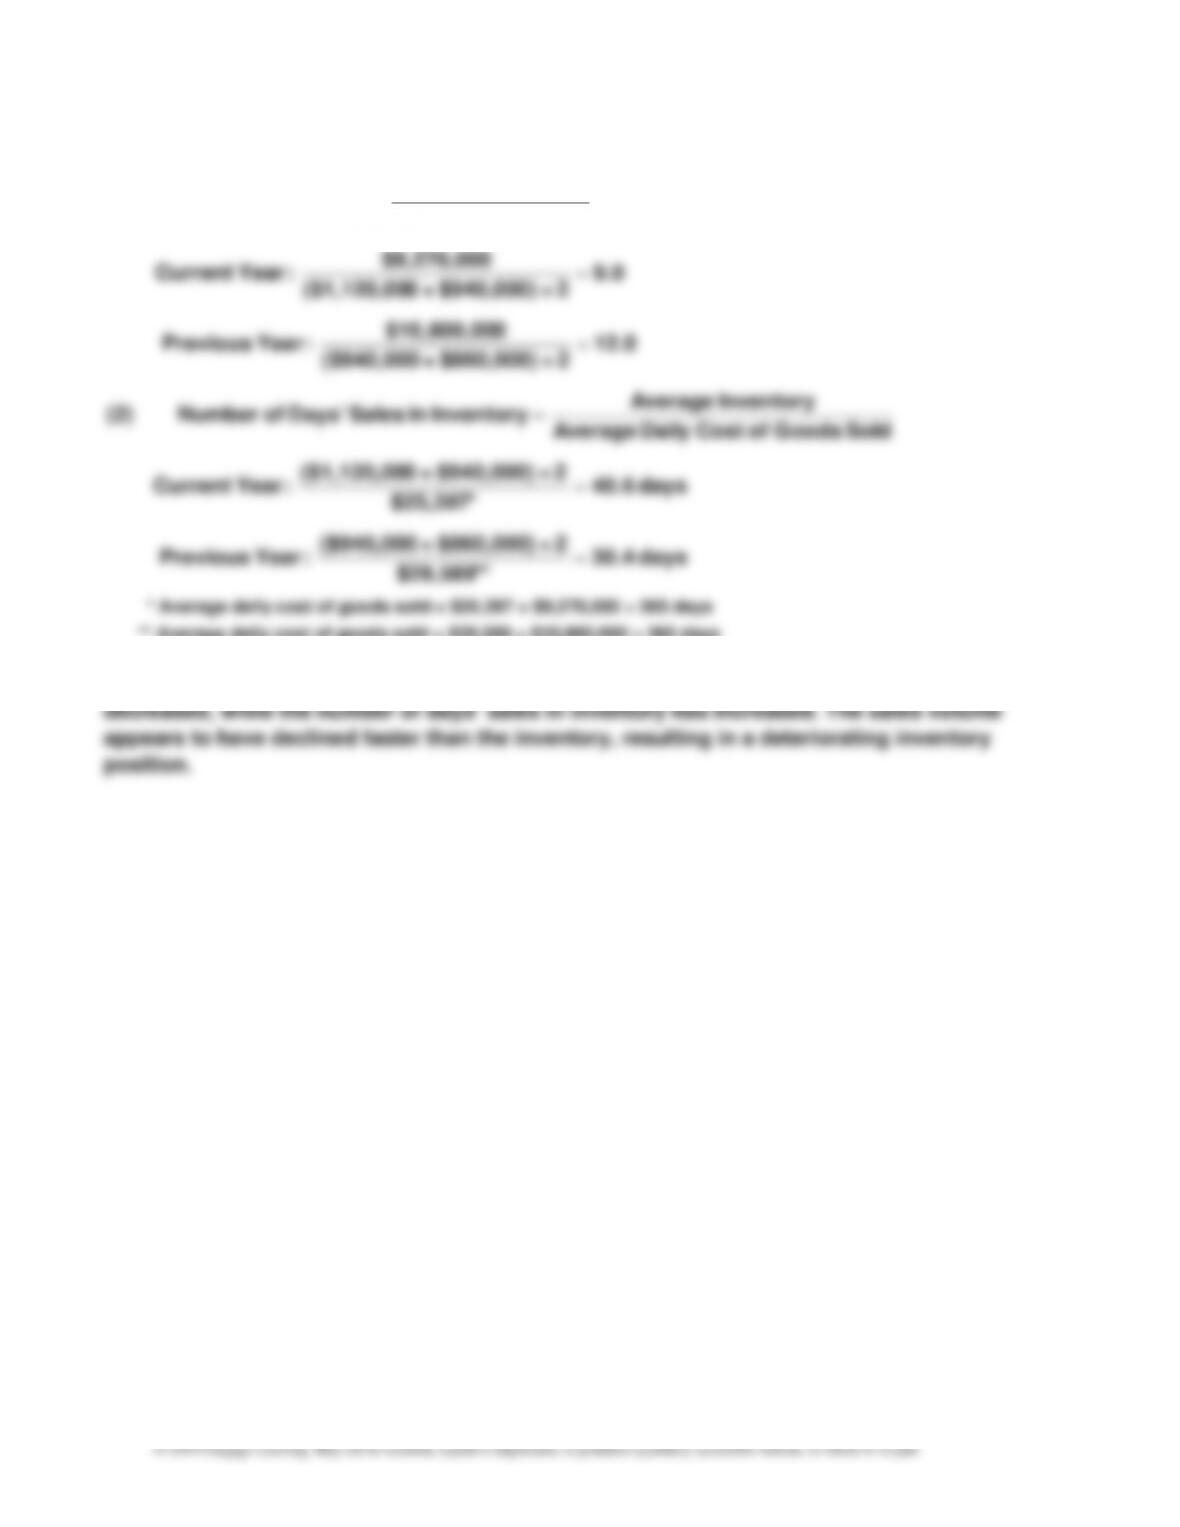
InventoryAverage
Sold Goods ofCost
=Turnover Inventory(1)
=
=
CHAPTER 14 Financial Statement Analysis
14–15
Ex. 14–12
a.
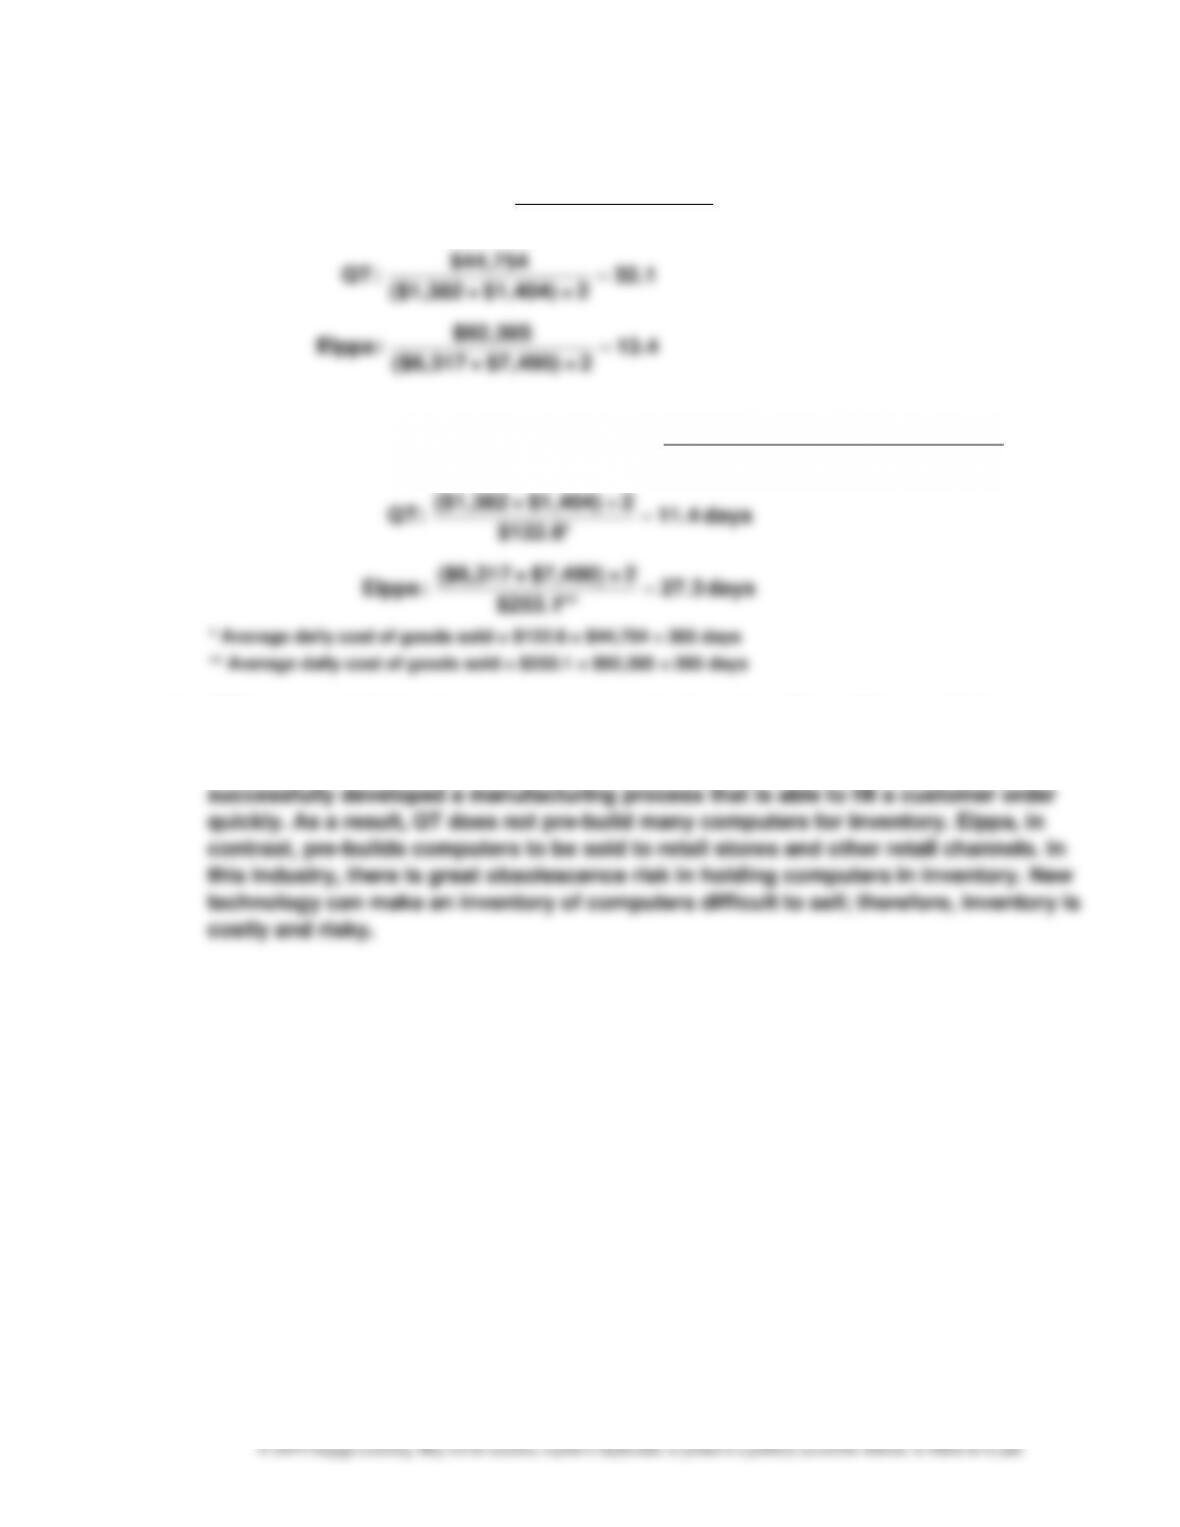
$44,754
InventoryAverage
Sold Goods ofCost
=Turnover Inventory(1)
CHAPTER 14 Financial Statement Analysis
14–16
Ex. 14–13
a.
$2,124,000
Equity rs’Stockholde Total
sLiabilitie Total
=Equity rs’Stockholde to sLiabilitie of Ratio
CHAPTER 14 Financial Statement Analysis
14–17
Ex. 14–14
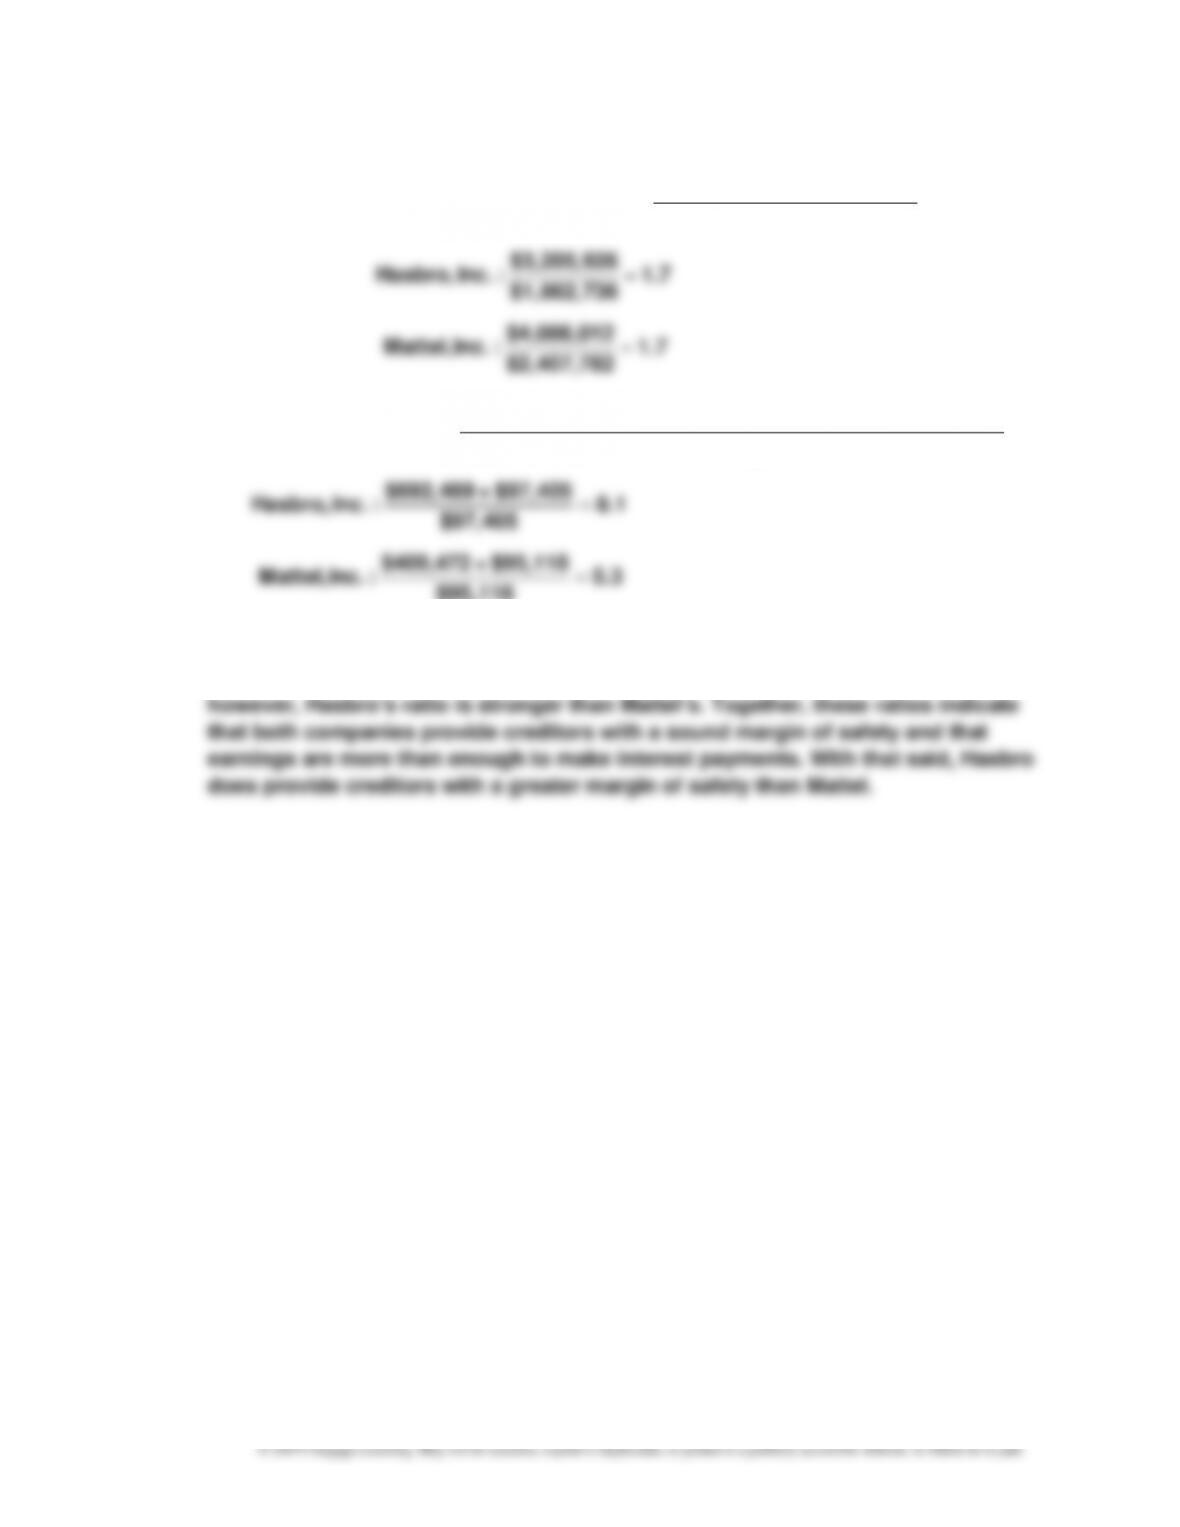
a.
1.7
$2,407,782
$4,086,012
:Inc. Mattel,
1.7
$1,862,736
$3,205,926
:Inc. Hasbro,
Equity rs’Stockholde Total
sLiabilitie Total
=Equity rs’Stockholde to sLiabilitie of Ratio
=
=
b.
5.3
$95,118
$95,118 + $409,472
:Inc. Mattel,
8.1
$97,405
$97,405 + $692,489
:Inc. Hasbro,
ExpenseInterest
ExpenseInterest + Expense Tax Income Before Income
=EarnedInterest Times
=
=
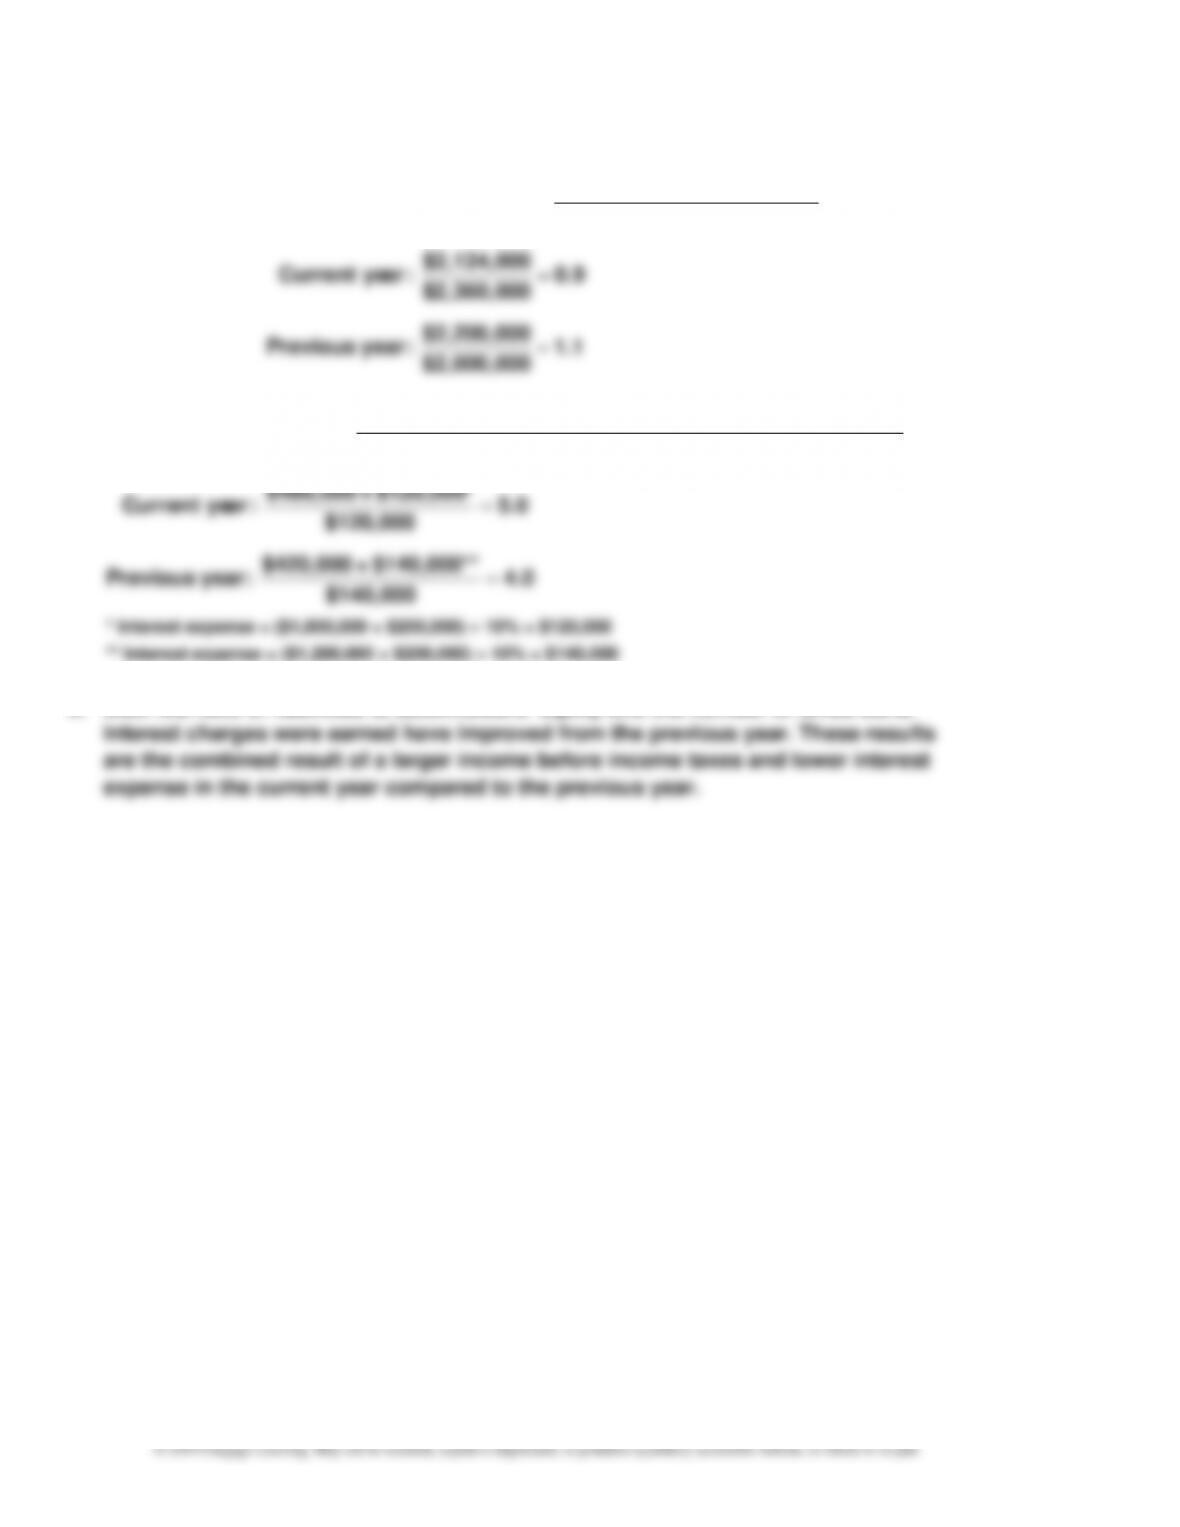
c. Hasbro carries the same proportion of debt to stockholders’ equity as Mattel (1.7
times stockholders’ equity). Both companies have strong interest coverage;
CHAPTER 14 Financial Statement Analysis
14–18
Ex. 14–15
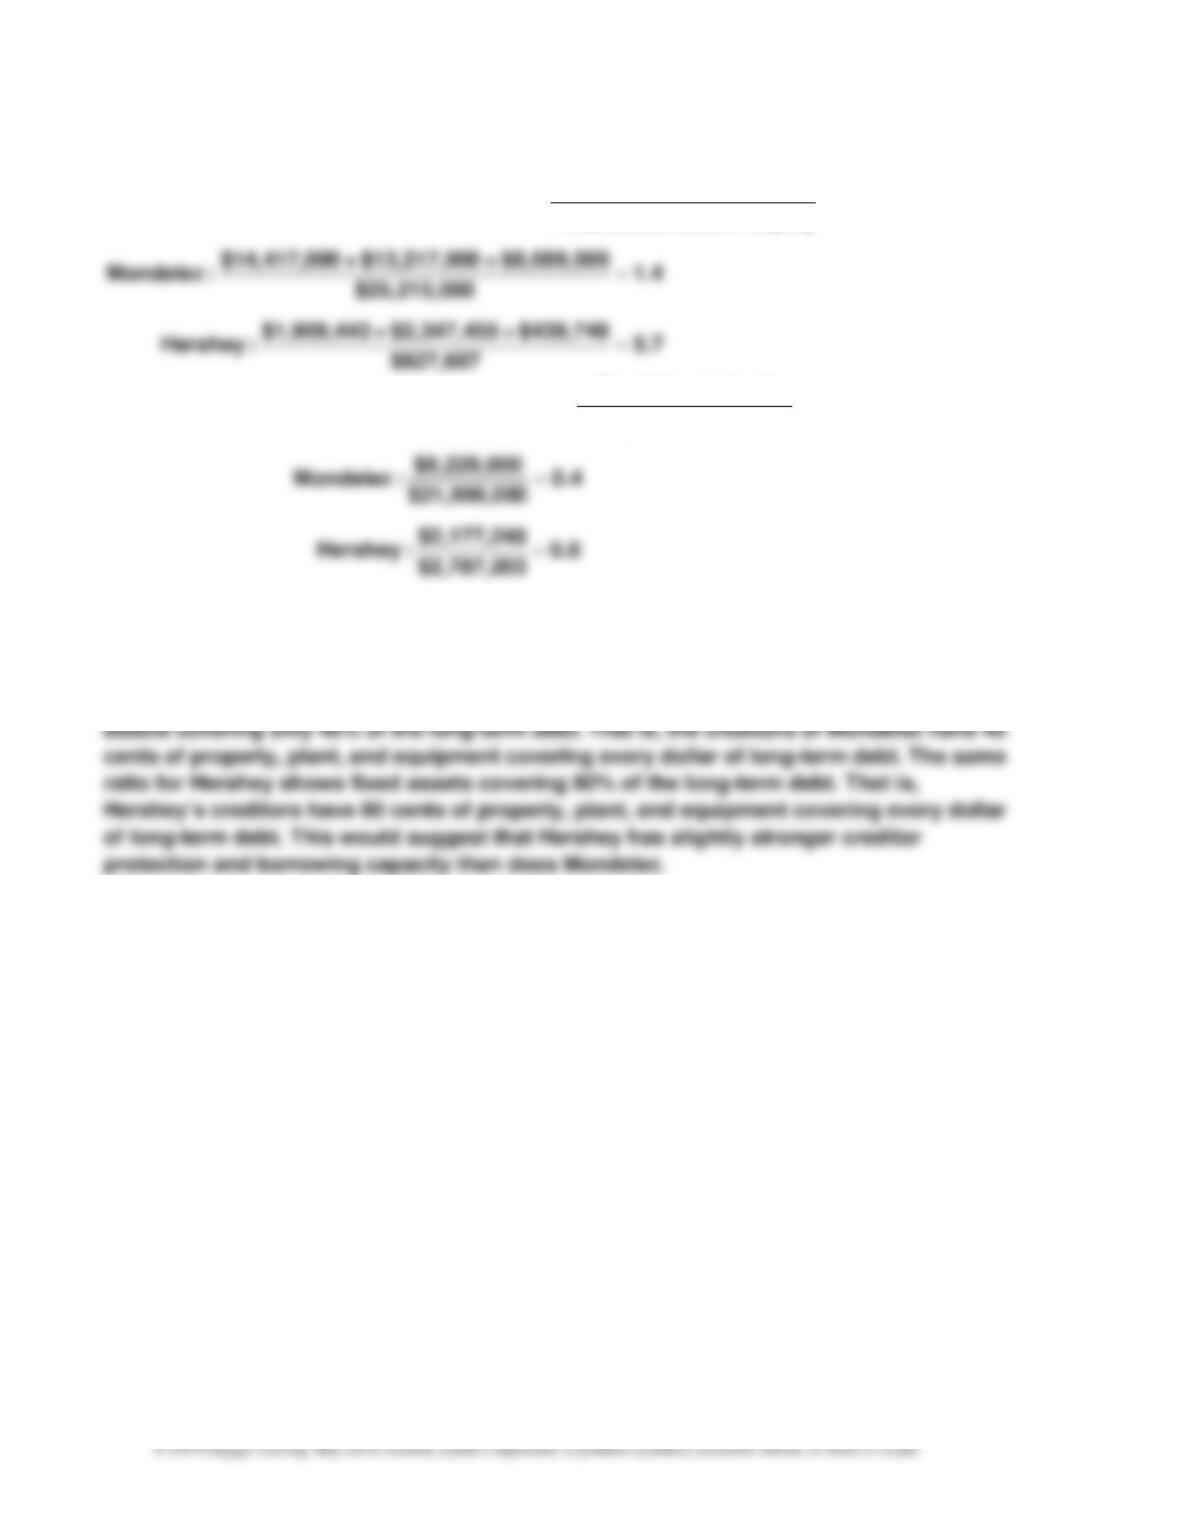
a.
5.7
$827,687
$439,748 + $2,347,455 + $1,909,443
:Hershey
0$25,215,00
$8,689,000 + 0$13,217,00 + 0$14,417,00
Equity rs’Stockholde Total
sLiabilitie Total
Equity rs’Stockholde to sLiabilitie of Ratio
=
=
b.
0.8
$2,787,203
$2,177,248
:Hershey
0$21,906,00
$8,229,000
sLiabilitie Term–Long
(net) AssetsFixed
sLiabilitie Term–Long to AssetsFixed of Ratio
=
=
c. Hershey’s total liabilities to stockholders’ equity ratio is higher than Mondelez’s (5.7 vs.
1.4), meaning Hershey uses more debt than Mondelez. Mondelez has a lower ratio of fixed
assets to long-term liabilities than Hershey. This ratio divides the property, plant, and
equipment (net) by the long-term debt. The ratio for Mondelez is aggressive, with fixed
CHAPTER 14 Financial Statement Analysis
14–19
Ex. 14–16
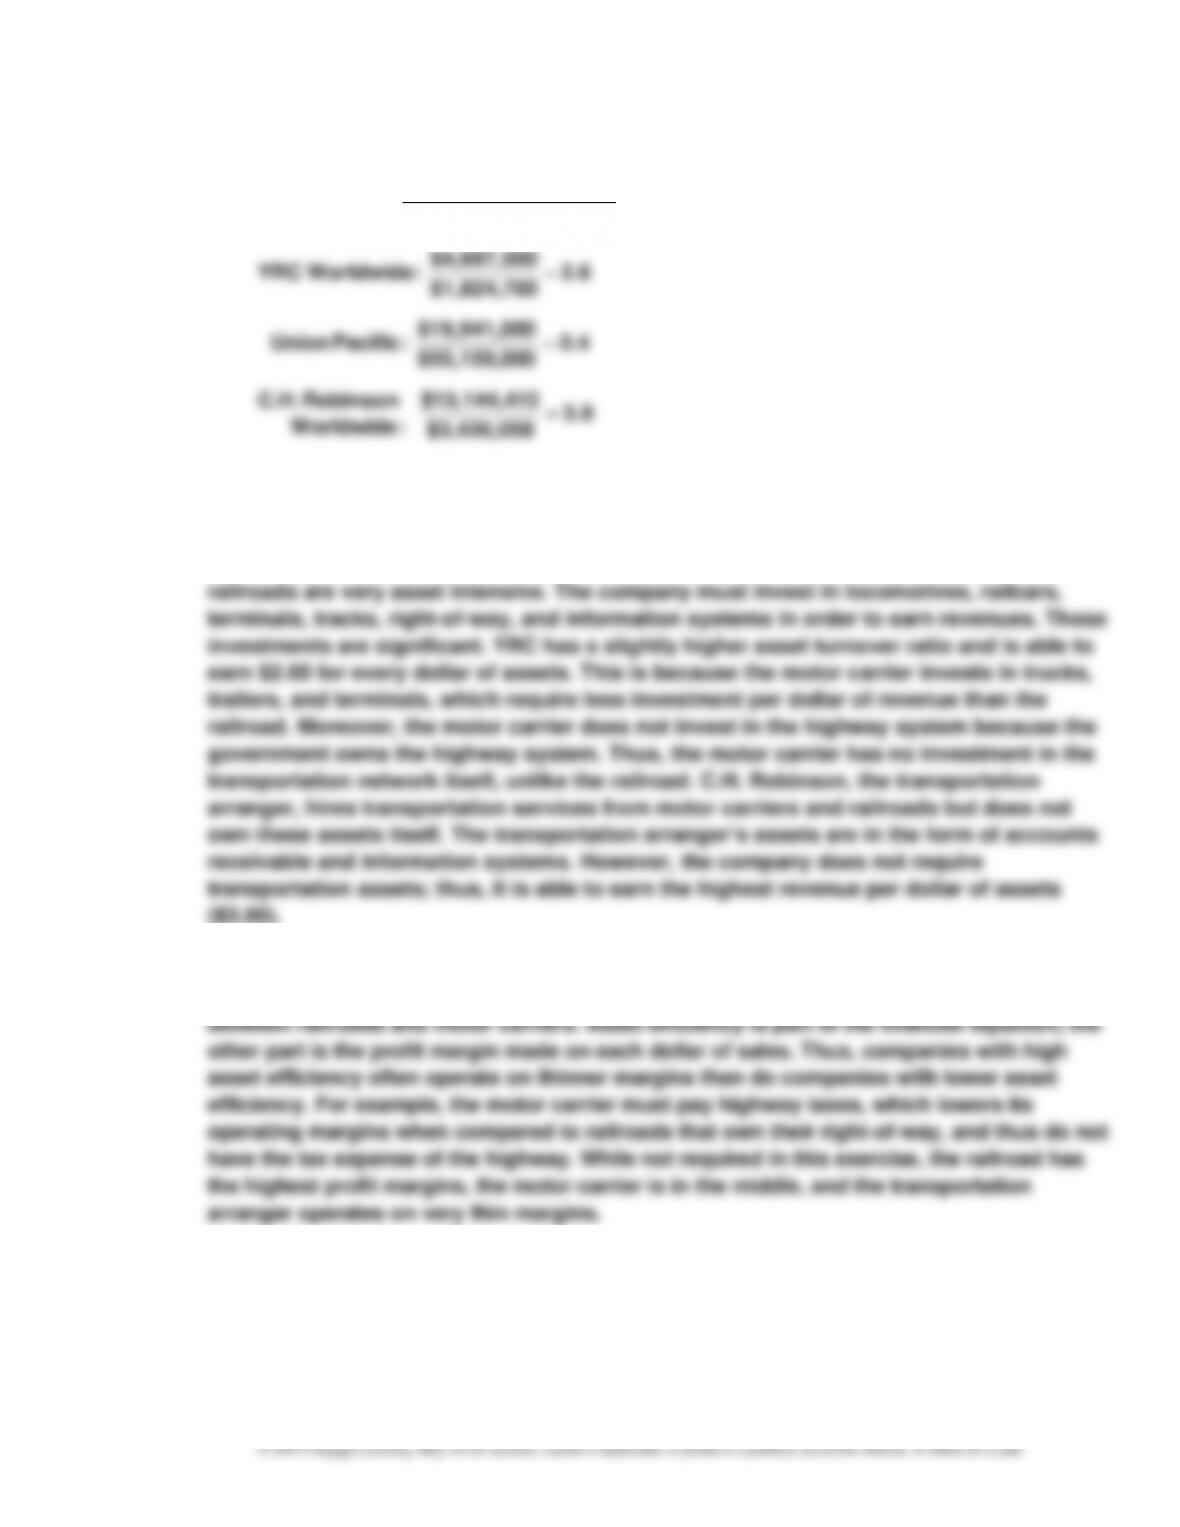
a.
2.6
$1,824,700
$4,697,500
: WorldwideYRC
AssetsTotal Average
Sales
TurnoverAsset
=
=
CHAPTER 14 Financial Statement Analysis
Ex. 14–17
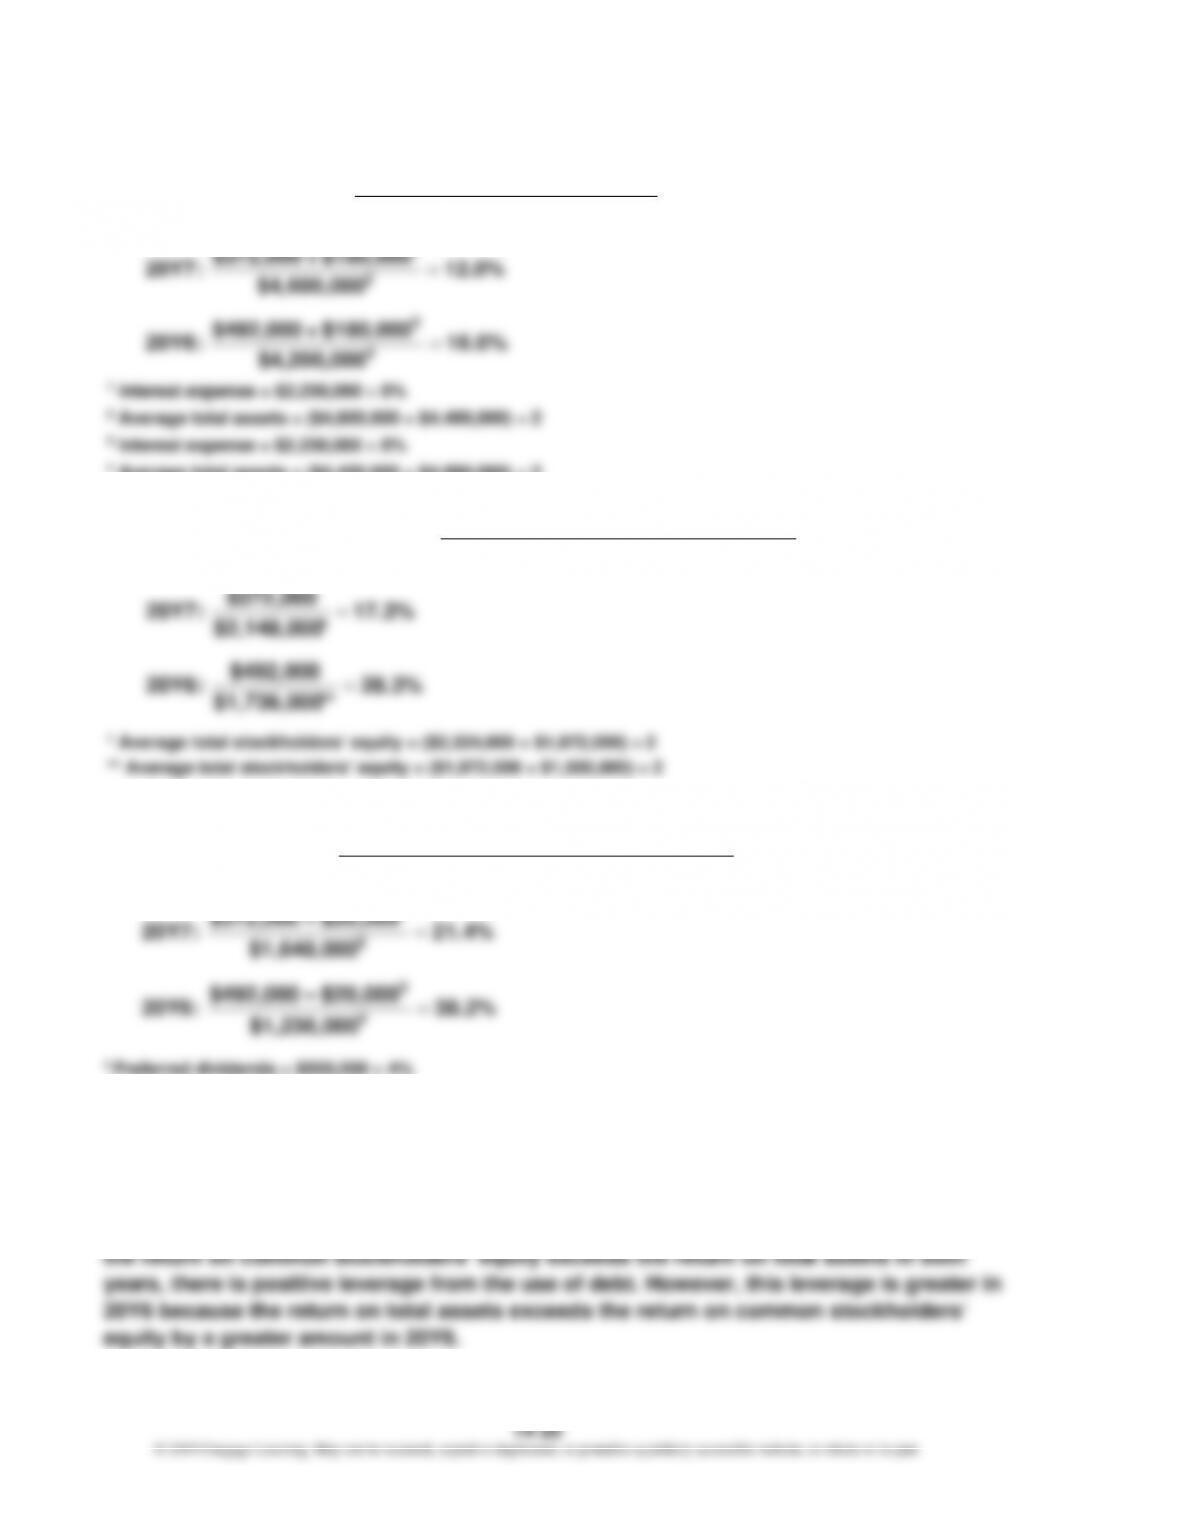
a.
$180,000 + $372,000
AssetsTotal Average
ExpenseInterest + IncomeNet
AssetsTotal on Return
1
=