CHAPTER 1 Introduction to Accounting and Business
1–36
Prob. 1–5B (Continued)
3.
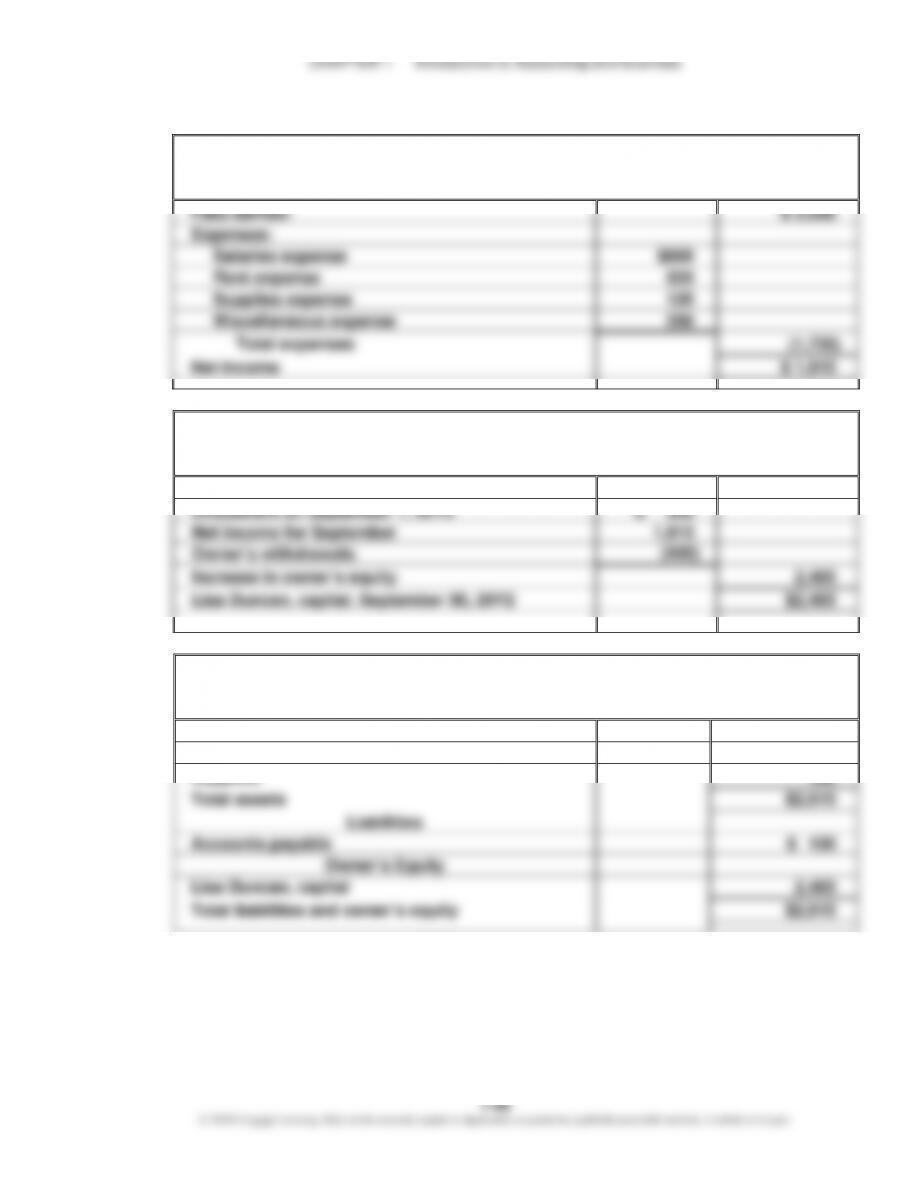
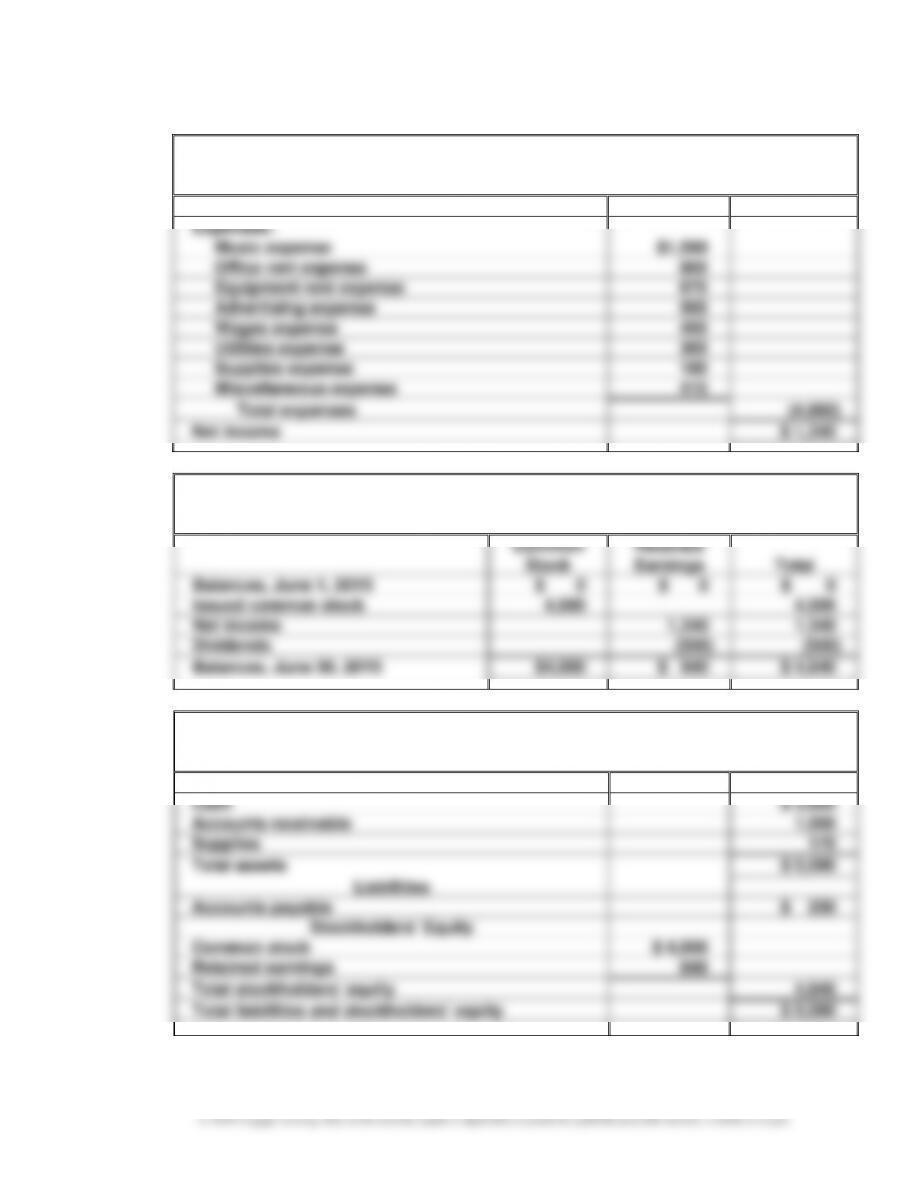
Bev’s Dry Cleaners
Income Statement
For the Month Ended November 30, 20Y3
Dry cleaning revenue
$110,000
Expenses:
Dry cleaning expense
$ 29,450
Wages expense
24,000
Supplies expense
7,200
Rent expense
4,000
Truck expense
2,100
Utilities expense
1,800
Miscellaneous expense
1,300
Total expenses
(69,850)
Net income
$ 40,150
Bev’s Dry Cleaners
Statement of Stockholders’ Equity
For the Month Ended November 30, 20Y3
Common
Stock
Retained
Earnings
Total
Balances, November 1, 20Y3
$ 50,000
$ 98,500
$ 148,500
Issued common stock
21,000
21,000
Net income
40,150
40,150
Dividends
(5,000)
(5,000)
Balances, November 30, 20Y3
$ 71,000
$133,650
$ 204,650
Bev’s Dry Cleaners
Balance Sheet
November 30, 20Y3
Assets
Cash
$ 81,800
Accounts receivable
75,000
Supplies
11,800
Land
85,000
Total assets
$ 253,600
Liabilities
Accounts payable
$ 48,950
Stockholders’ Equity
Common stock
$ 71,000
Retained earnings
133,650
Total stockholders’ equity
204,650
Total liabilities and stockholders’ equity
$ 253,600
CHAPTER 1 Introduction to Accounting and Business
1–37
Prob. 1–5B (Concluded)
4. (Optional)
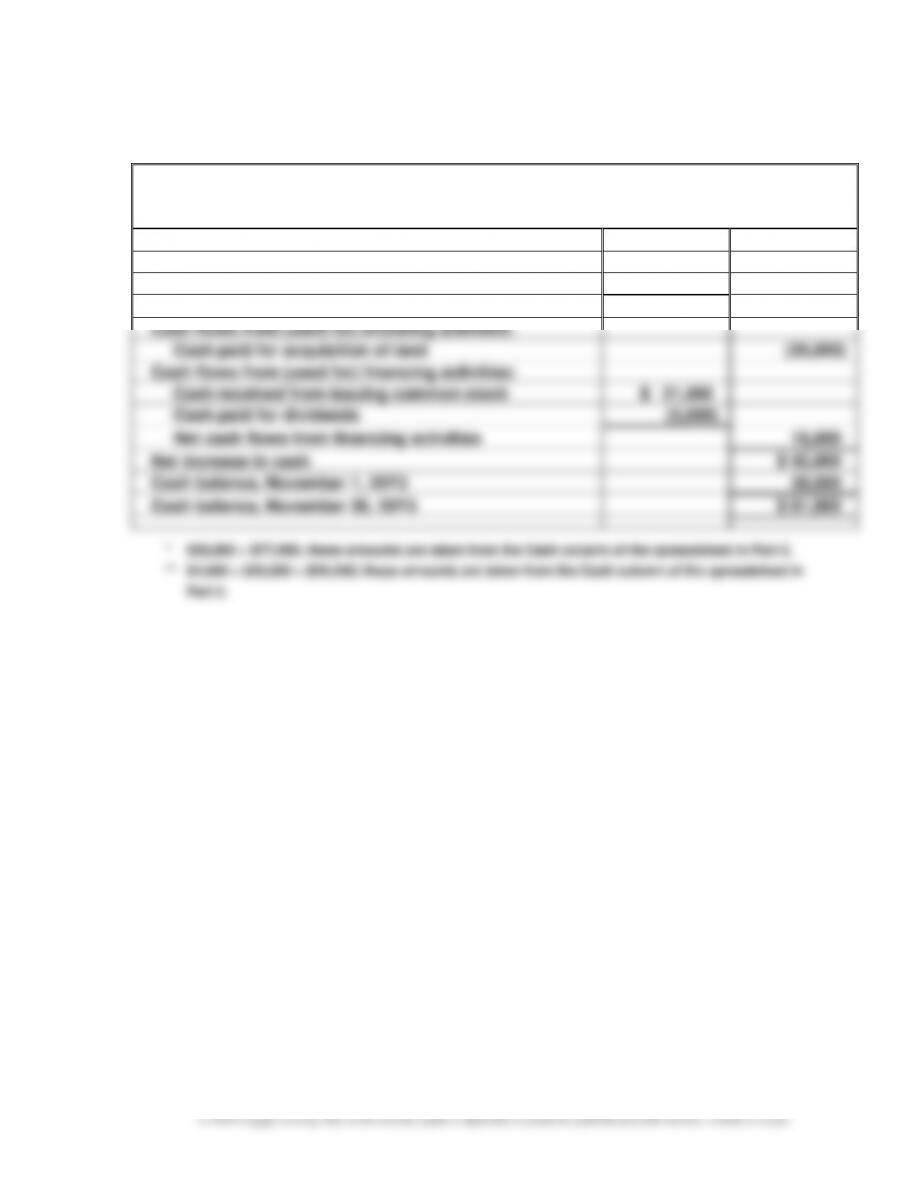
Bev’s Dry Cleaners
Statement of Cash Flows
For the Month Ended November 30, 20Y3
Cash flows from (used for) operating activities:
Cash received from customers*
$ 115,000
Cash paid for expenses and to creditors**
(53,200)
Net cash flows from operating activities
$ 61,800
Cash flows from (used for) investing activities:
Cash paid for acquisition of land
(35,000)
Cash flows from (used for) financing activities:
Cash received from issuing common stock
$ 21,000
Cash paid for dividends
(5,000)
Net cash flows from financing activities
16,000
Net increase in cash
$ 42,800
Cash balance, November 1, 20Y3
39,000
Cash balance, November 30, 20Y3
$ 81,800
* $38,000 + $77,000; these amounts are taken from the Cash column of the spreadsheet in Part 2.
** $4,000 + $20,000 + $29,200; these amounts are taken from the Cash column of the spreadsheet in
Part 2.
CHAPTER 1 Introduction to Accounting and Business
1–38
Prob. 1–6B
a. Wages expense, $203,200 ($288,000 – $48,000 – $17,600 – $14,400 – $4,800)
b. Net income, $112,000 ($400,000 – $288,000)
CHAPTER 1 Introduction to Accounting and Business
1–39
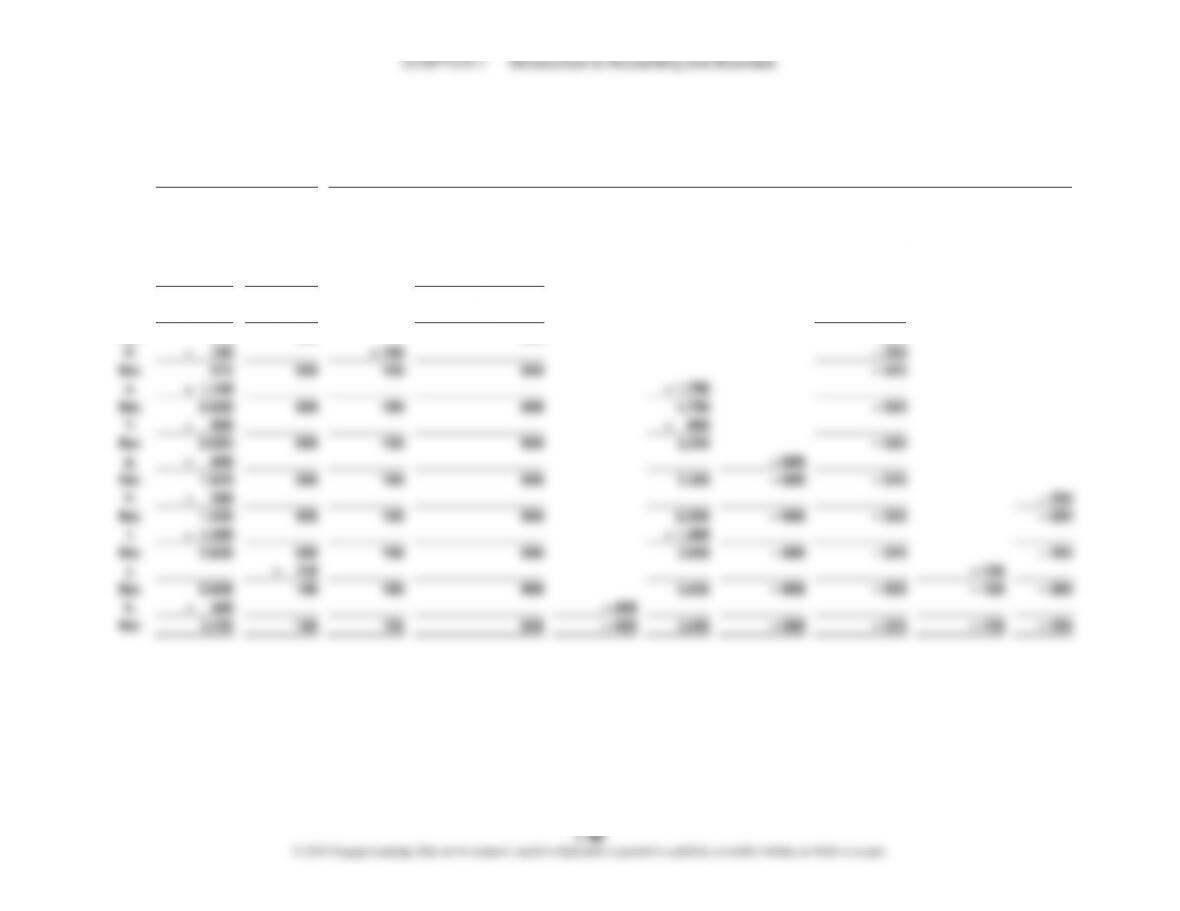
CONTINUING PROBLEM
1.
Assets
=
Liabilities
+
Stockholders’ Equity
Cash
+
Accts. Rec.
+
Supplies
=
Accts.
Payable
+
Common
Stock
–
Dividends
+
Fees
Earned
June 1
June 2
+ 4,000
+ 3,500
+ 4,000
+ 3,500
Bal.
7,500
4,000
3,500
June 2
– 800
Bal.
6,700
4,000
3,500
June 4
+ 350
+ 350
Bal.
6,700
350
350
4,000
3,500
June 6
– 500
Bal.
6,200
350
350
4,000
3,500
June 8
– 675
Bal.
5,525
350
350
4,000
3,500
June 12
– 350
Bal.
5,175
350
350
4,000
3,500
June 13
– 100
– 100
Bal.
5,075
350
250
4,000
3,500
June 16
+ 300
+ 300
Bal.
5,375
350
250
4,000
3,800
June 22
+ 1,000
+ 1,000
Bal.
5,375
1,000
350
250
4,000
4,800
June 25
+ 500
+ 500
Bal.
5,875
1,000
350
250
4,000
5,300
June 29
– 240
Bal.
5,635
1,000
350
250
4,000
5,300
June 30
+ 900
+ 900
Bal.
6,535
1,000
350
250
4,000
6,200
June 30
– 400
Bal.
6,135
1,000
350
250
4,000
6,200
June 30
– 300
Bal.
5,835
1,000
350
250
4,000
6,200
June 30
– 180
Bal.
5,835
1,000
170
250
4,000
6,200
June 30
– 415
Bal.
5,420
1,000
170
250
4,000
6,200
June 30
– 1,000
Bal.
4,420
1,000
170
250
4,000
6,200
June 30
– 500
– 500
Bal.
3,920
1,000
170
250
4,000
– 500
6,200
CHAPTER 1 Introduction to Accounting and Business
1–40
Continuing Problem (Continued)
Stockholders’ Equity (Continued)
–
Music
Exp.
–
Office Rent
Exp.
–
Equip.
Rent Exp.
–
Adver-
tising Exp.
–
Wages
Exp.
–
Utilities
Exp.
–
Supplies
Exp.
–
Misc. Exp.
June 1
June 2
Bal.
June 2
– 800
Bal.
June 4
– 800
Bal.
June 6
– 800
– 500
Bal.
June 8
– 800
– 675
– 500
Bal.
June 12
– 350
– 800
– 675
– 500
Bal.
June 13
– 350
– 800
– 675
– 500
Bal.
June 16
– 350
– 800
– 675
– 500
Bal.
June 22
– 350
– 800
– 675
– 500
Bal.
June 25
– 350
– 800
– 675
– 500
Bal.
June 29
– 350
– 240
– 800
– 675
– 500
Bal.
June 30
– 590
– 800
– 675
– 500
Bal.
June 30
– 590
– 800
– 675
– 500
– 400
Bal.
June 30
– 590
– 800
– 675
– 500
– 400
– 300
Bal.
June 30
– 590
– 800
– 675
– 500
– 400
– 300
– 180
Bal.
June 30
– 590
– 800
– 675
– 500
– 400
– 300
– 180
– 415
Bal.
June 30
– 590
– 1,000
– 800
– 675
– 500
– 400
– 300
– 180
– 415
Bal.
June 30
– 1,590
– 800
– 675
– 500
– 400
– 300
– 180
– 415
Bal.
– 1,590
– 800
– 675
– 500
– 400
– 300
– 180
– 415
CHAPTER 1 Introduction to Accounting and Business
1–41
Continuing Problem (Concluded)
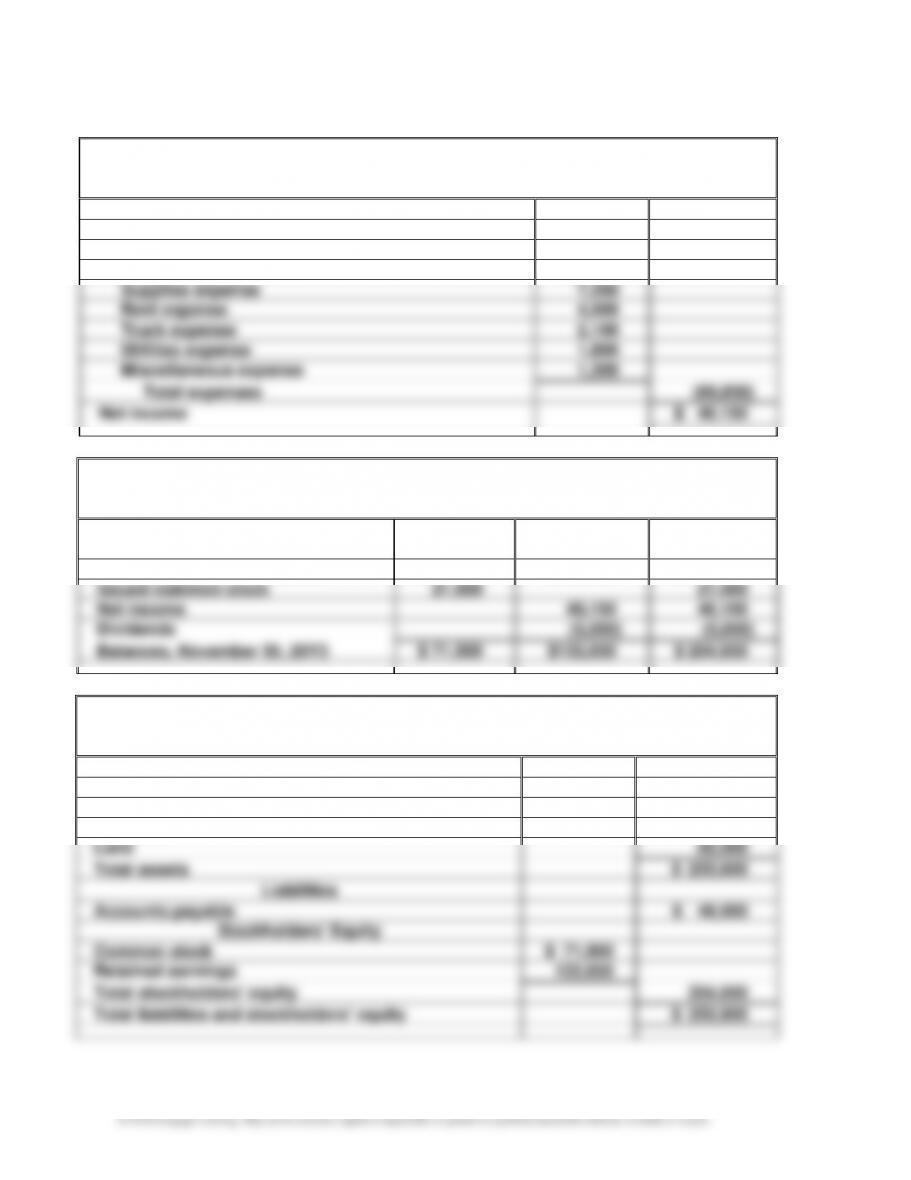
2.
PS Music
Income Statement
For the Month Ended June 30, 20Y5
Fees earned:
$ 6,200
Expenses:
Music expense
$1,590
Office rent expense
800
Equipment rent expense
675
Advertising expense
500
Wages expense
400
Utilities expense
300
Supplies expense
180
Miscellaneous expense
415
Total expenses
(4,860)
Net income
$ 1,340
3.
PS Music
Statement of Stockholders’ Equity
For the Month Ended June 30, 20Y5
Common
Stock
Retained
Earnings
Total
Balances, June 1, 20Y5
$ 0
$ 0
$ 0
Issued common stock
4,000
4,000
Net income
1,340
1,340
Dividends
(500)
(500)
Balances, June 30, 20Y5
$4,000
$ 840
$ 4,840
4.
PS Music
Balance Sheet
June 30, 20Y5
Assets
Cash
$ 3,920
Accounts receivable
1,000
Supplies
170
Total assets
$ 5,090
Liabilities
Accounts payable
$ 250
Stockholders’ Equity
Common stock
$ 4,000
Retained earnings
840
Total stockholders’ equity
4,840
Total liabilities and stockholders’ equity
$ 5,090
CHAPTER 1 Introduction to Accounting and Business
MAKE A DECISION
MAD 1–1
a.
Equity rs’Stockholde Total
sLiabilitie Total
Equity rs’Stockholde to sLiabilitie of Ratio =
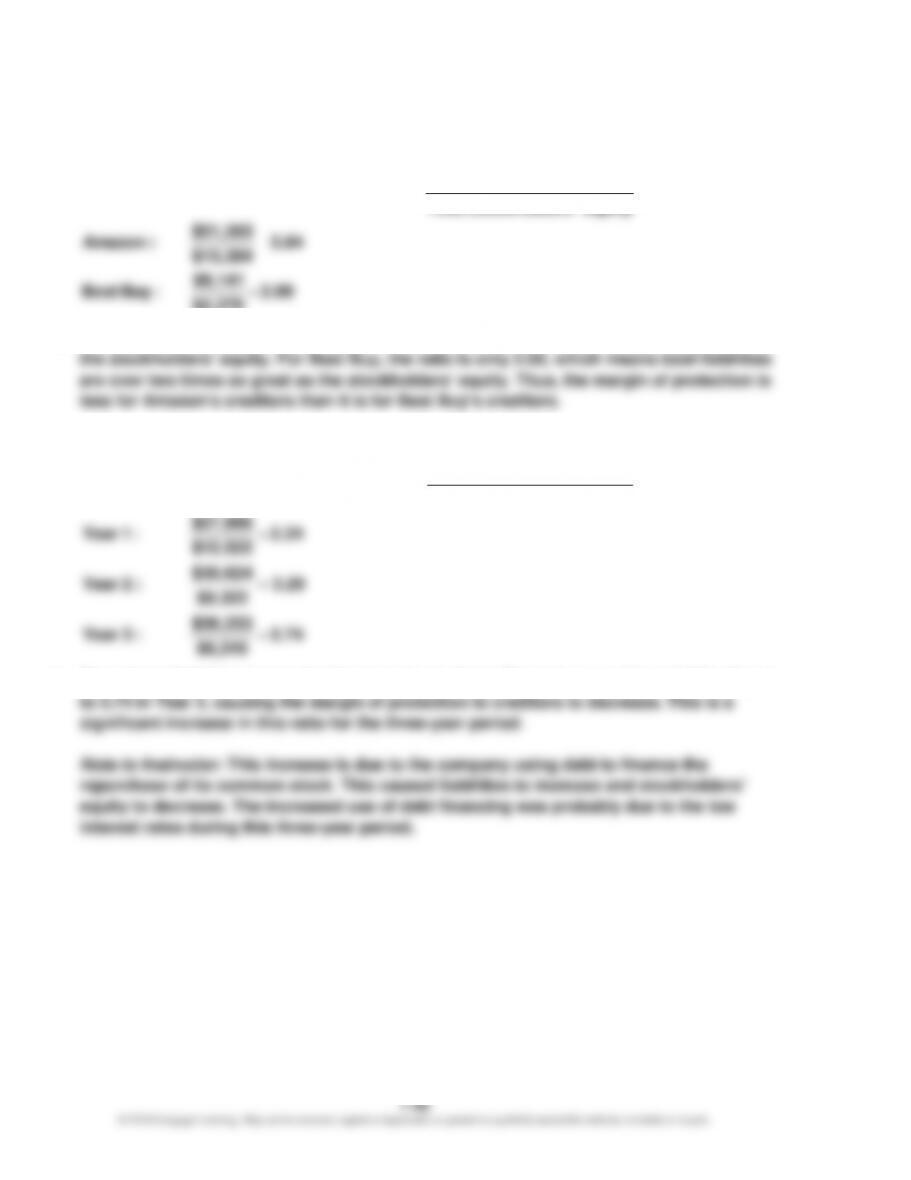
3.84
$13,384
$51,363
:Amazon =
2.09
$4,378
$9,141
:BuyBest =
b. Amazon’s ratio is 3.84, which means the total liabilities are almost four times as great as
MAD 1–2
a.
Equityrs’Stockholde Total
sLiabilitie Total
Equityrs’Stockholde to sLiabilitie of Ratio =
5.74
$6,316
$36,233
:3 Year
3.29
$9,322
$30,624
:2 Year
2.24
$12,522
$27,996
:1 Year
=
=
=
b. The ratio of liabilities to stockholders’ equity for Home Depot increased from 2.24 in Year 1
1–43
MAD 1–3
a.
Equityrs’Stockholde Total
sLiabilitie Total
Equityrs’Stockholde to sLiabilitie of Ratio =
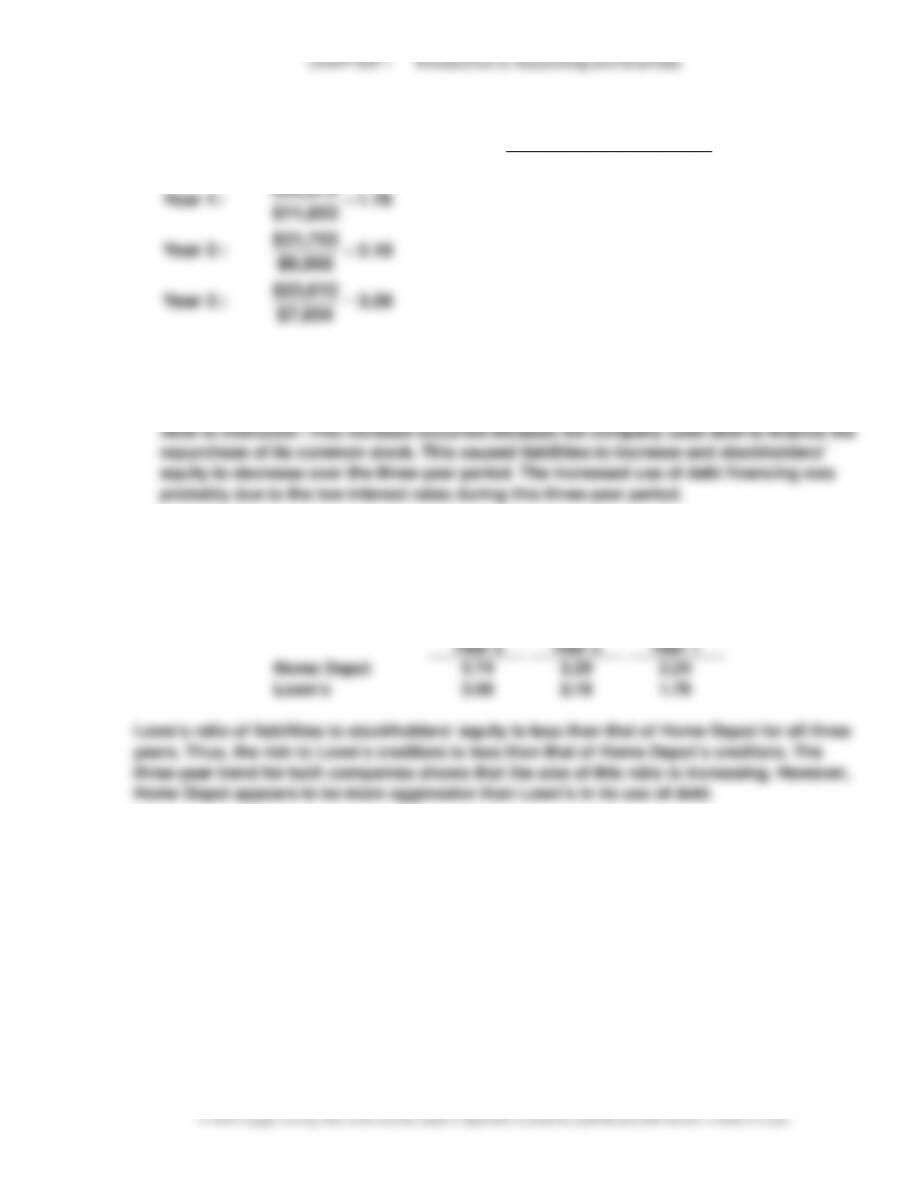
3.08
$7,654
$23,612
:3 Year
2.18
$9,968
$21,753
:2 Year
1.76
$11,853
$20,879
:1 Year
=
=
=
b. The ratio of liabilities to stockholders’ equity for Lowe’s increased from 1.76 in Year 1 to
3.08 in Year 3, causing the margin of protection to creditors to decrease. This is a
significant increase in this ratio for the three-year period.
MAD 1–4
The ratios of liabilities to stockholders’ equity are summarized below for Home Depot (MAD 1–2)
and Lowe’s (MAD 1–3).
Year 3
Year 2
Year 1
Home Depot
5.74
3.29
2.24
Lowe’s
3.08
2.18
1.76
Lowe’s ratio of liabilities to stockholders’ equity is less than that of Home Depot for all three
years. Thus, the risk to Lowe’s creditors is less than that of Home Depot’s creditors. The
three-year trend for both companies shows that the size of this ratio is increasing. However,
Home Depot appears to be more aggressive than Lowe’s in its use of debt.
CHAPTER 1 Introduction to Accounting and Business
1–44
MAD 1–5
a. Ratio of Liabilities to Stockholders’ Equity =
Equityrs’Stockholde Total
sLiabilitie Total
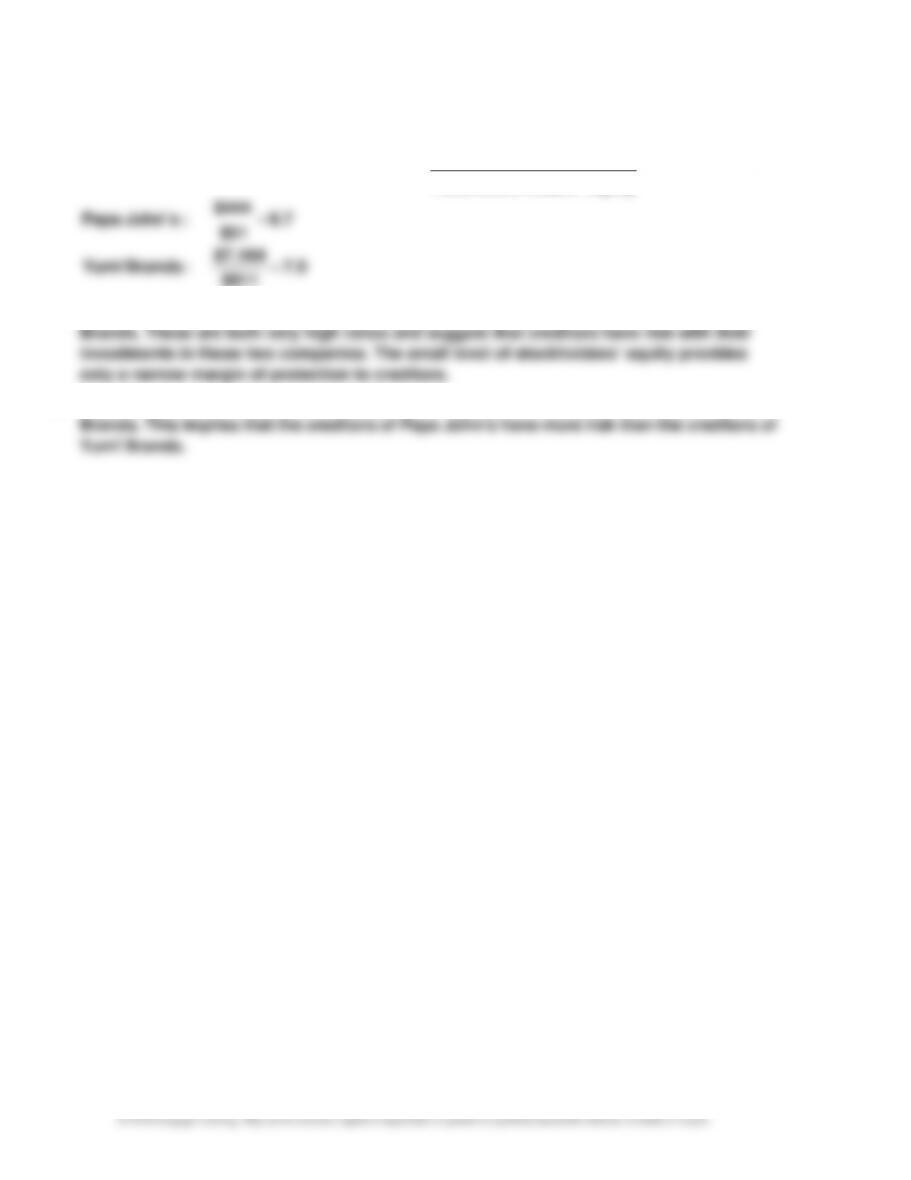
8.7
$51
$444
:sJohn‘ Papa =
7.9
$911
$7,164
:Brands Yum! =
b. The ratio of liabilities to stockholders’ equity is 8.7 for Papa John’s and 7.9 for Yum!
c. Papa John’s ratio of liabilities to stockholders’ equity of 8.7 is higher than that of Yum!
CHAPTER 1 Introduction to Accounting and Business
1–45
TAKE IT FURTHER
TIF 1–1
1. The car repair is a personal expense and is Marco’s personal responsibility. By
using partnership funds to pay for the repair, Marco is behaving unethically because
CHAPTER 1 Introduction to Accounting and Business
1–46
TIF 1–2
1. Acceptable professional conduct requires that Colleen Fernandez supply First Federal
Bank with all the relevant financial statements necessary for the bank to make an
2. a. Owners are generally willing to provide bankers with information about the operating
and financial condition of the business, such as the following:
• Operating Information:
• Description of business operations
• Financial Condition:
• List of assets and liabilities (balance sheet)
Owners are normally reluctant to provide the following types of information to
bankers:
• Proprietary Operating Information. Such information, which might hurt the
significantly affect the owner’s personal wealth.
b. Bankers typically want as much information as possible about the ability of the
business and the owner to repay the loan with interest. Examples of such information
are described above.
c. Both bankers and business owners share the common interest of the business doing
CHAPTER 1 Introduction to Accounting and Business
TIF 1–3
A sample solution based on Twitter’s Form 10-K for the fiscal year ended
December 31, 2016, follows:
2. San Francisco, CA
4. Service
5. Twitter is a global platform for public self-expression and conversation in real time.
6. Balance sheet, statement of operations (income statement), statement of comprehensive
TIF 1–4
Example Memo
To: Teacher
From: Student
TIF 1–5
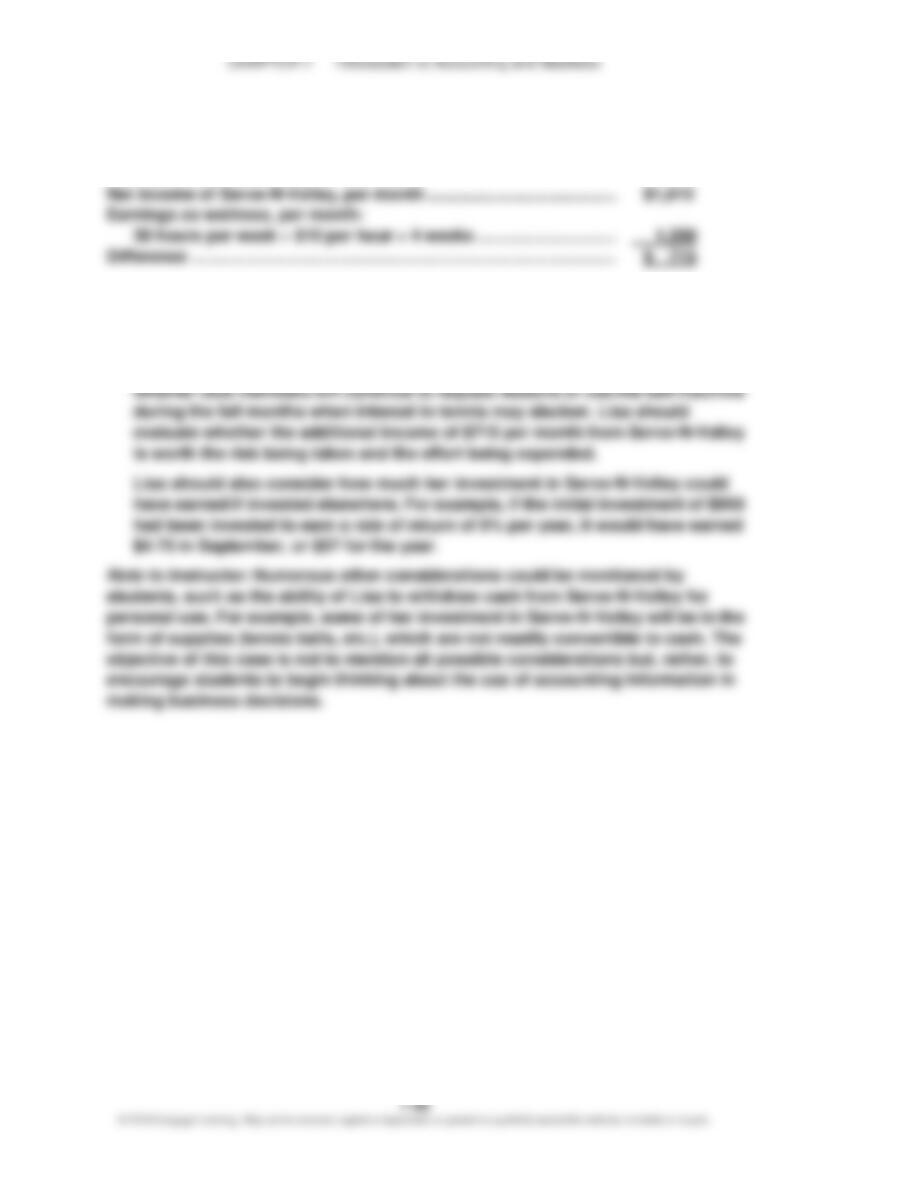
The difference in the two bank balances, $55,000 ($80,000 – $25,000), may not be pure profit from
an accounting perspective. To determine the accounting profit for the six-month period, the
revenues for the period would need to be matched with the related expenses. The revenues