23. Forecasting Latin American Currencies. The value of each Latin American currency relative to the
dollar is dictated by supply and demand conditions between that currency and the dollar. The values
of Latin American currencies have generally declined substantially against the dollar over time. Most
of these countries have high inflation rates and high interest rates. The data on inflation rates,
economic growth, and other economic indicators are subject to error, as limited resources are used to
compile the data.
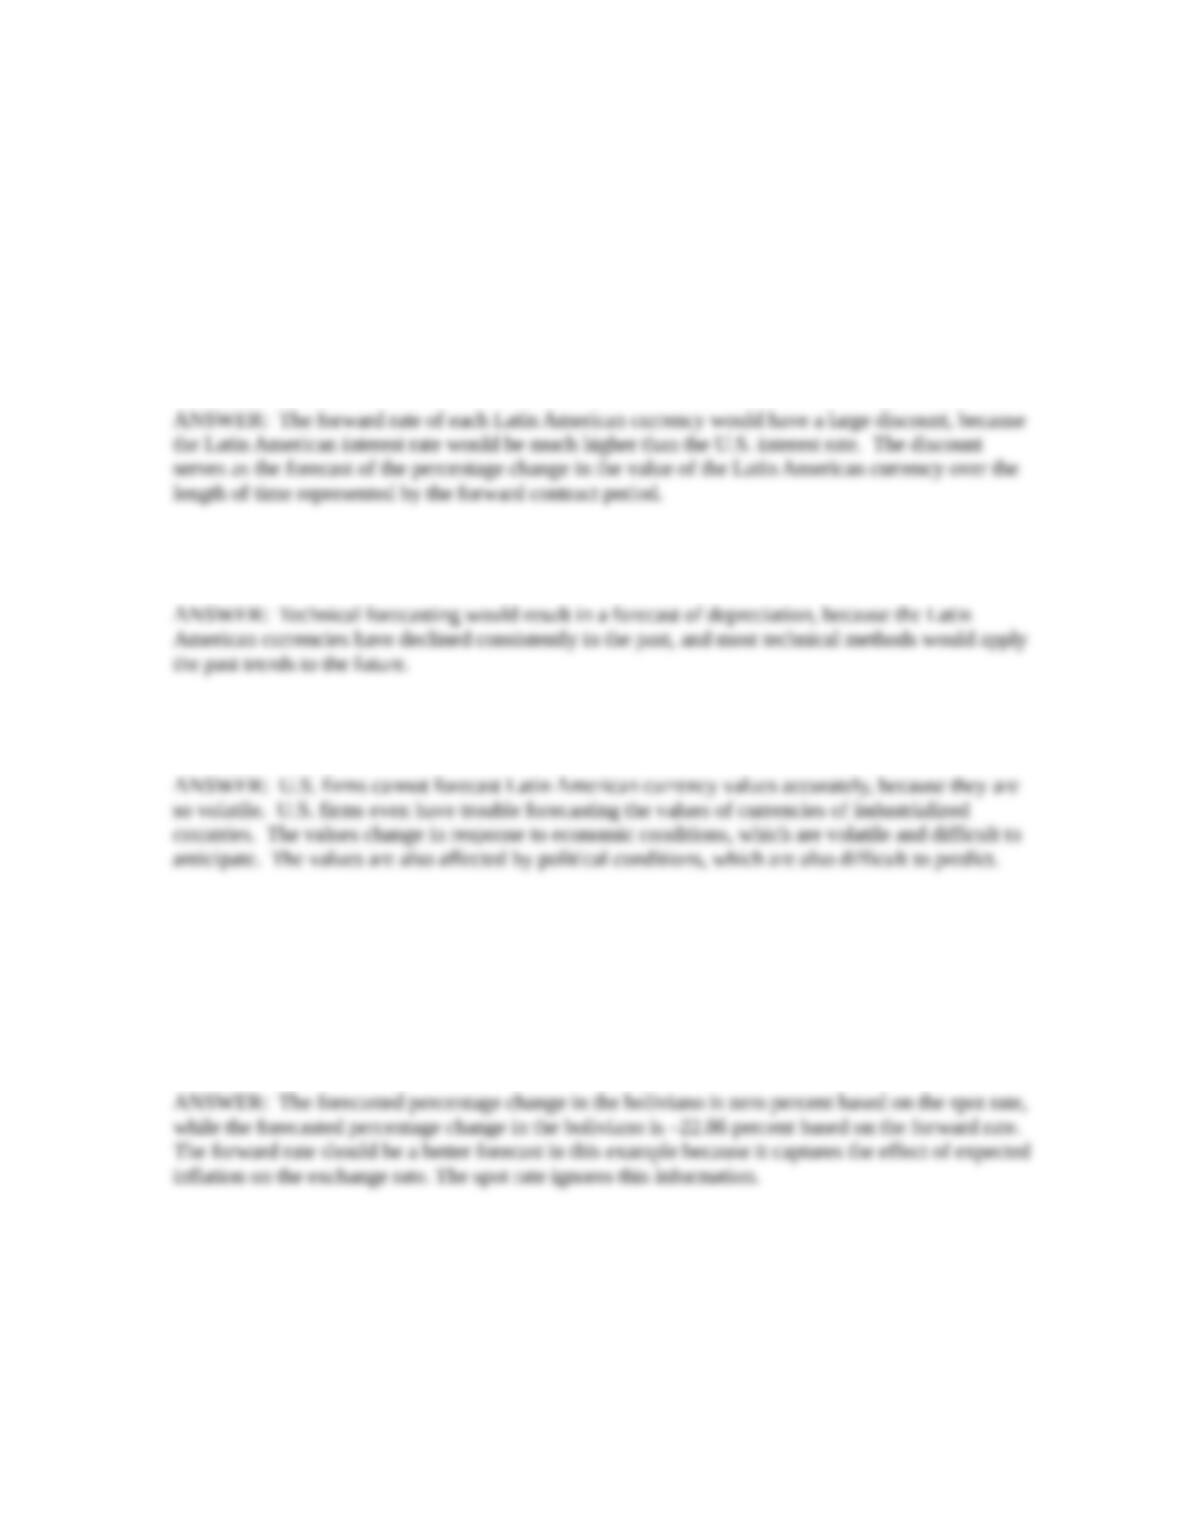
a. If the forward rate is used as a market-based forecast, will this rate result in a forecast of
appreciation, depreciation, or no change in any particular Latin American currency? Explain.
b. If technical forecasting is used, will this result in a forecast of appreciation, depreciation, or no
change in the value of a specific Latin American currency? Explain.
c. Do you think that U.S. firms can accurately forecast the future values of Latin American
currencies? Explain.
24. Selecting between Forecast Methods. Bolivia currently has a nominal one-year risk-free interest rate
of 40 percent, which is primarily due to the high level of expected inflation. The U.S. nominal one-
year risk-free interest rate is 8 percent. The spot rate of Bolivia’s currency (called the boliviano) is
$.14. The one-year forward rate of the boliviano is $.108. What is the forecasted percentage change in
the boliviano if the spot rate is used as a one-year forecast? What is the forecasted percentage change
in the boliviano if the one-year forward rate is used as a one-year forecast? Which forecast do you
think will be more accurate? Why?
25. Comparing Market-based Forecasts. For all parts of this question, assume that interest rate parity
exists, the prevailing one-year U.S. nominal interest rate is low, and that you expect the U.S. inflation
to be low this year.
a. Assume that the country Dinland engages in much trade with the U.S. and the trade involves
many different products. Dinland has had a zero trade balance with the U.S. (the value of exports
and imports is about the same) in the past. Assume that you expect a high level of inflation
© 2018 Cengage Learning. All Rights Reserved. May not be copied, scanned, or duplicated, in whole or in part, except for use as
permitted in a license distributed with a certain product or service or otherwise on a password-protected website for classroom use.
Forecasting Exchange Rates 2
(perhaps about 40%) in Dinland over the next year because of a large increase in the prices of
many products that Dinland produces. Dinland presently has a one-year risk-free interest rate of
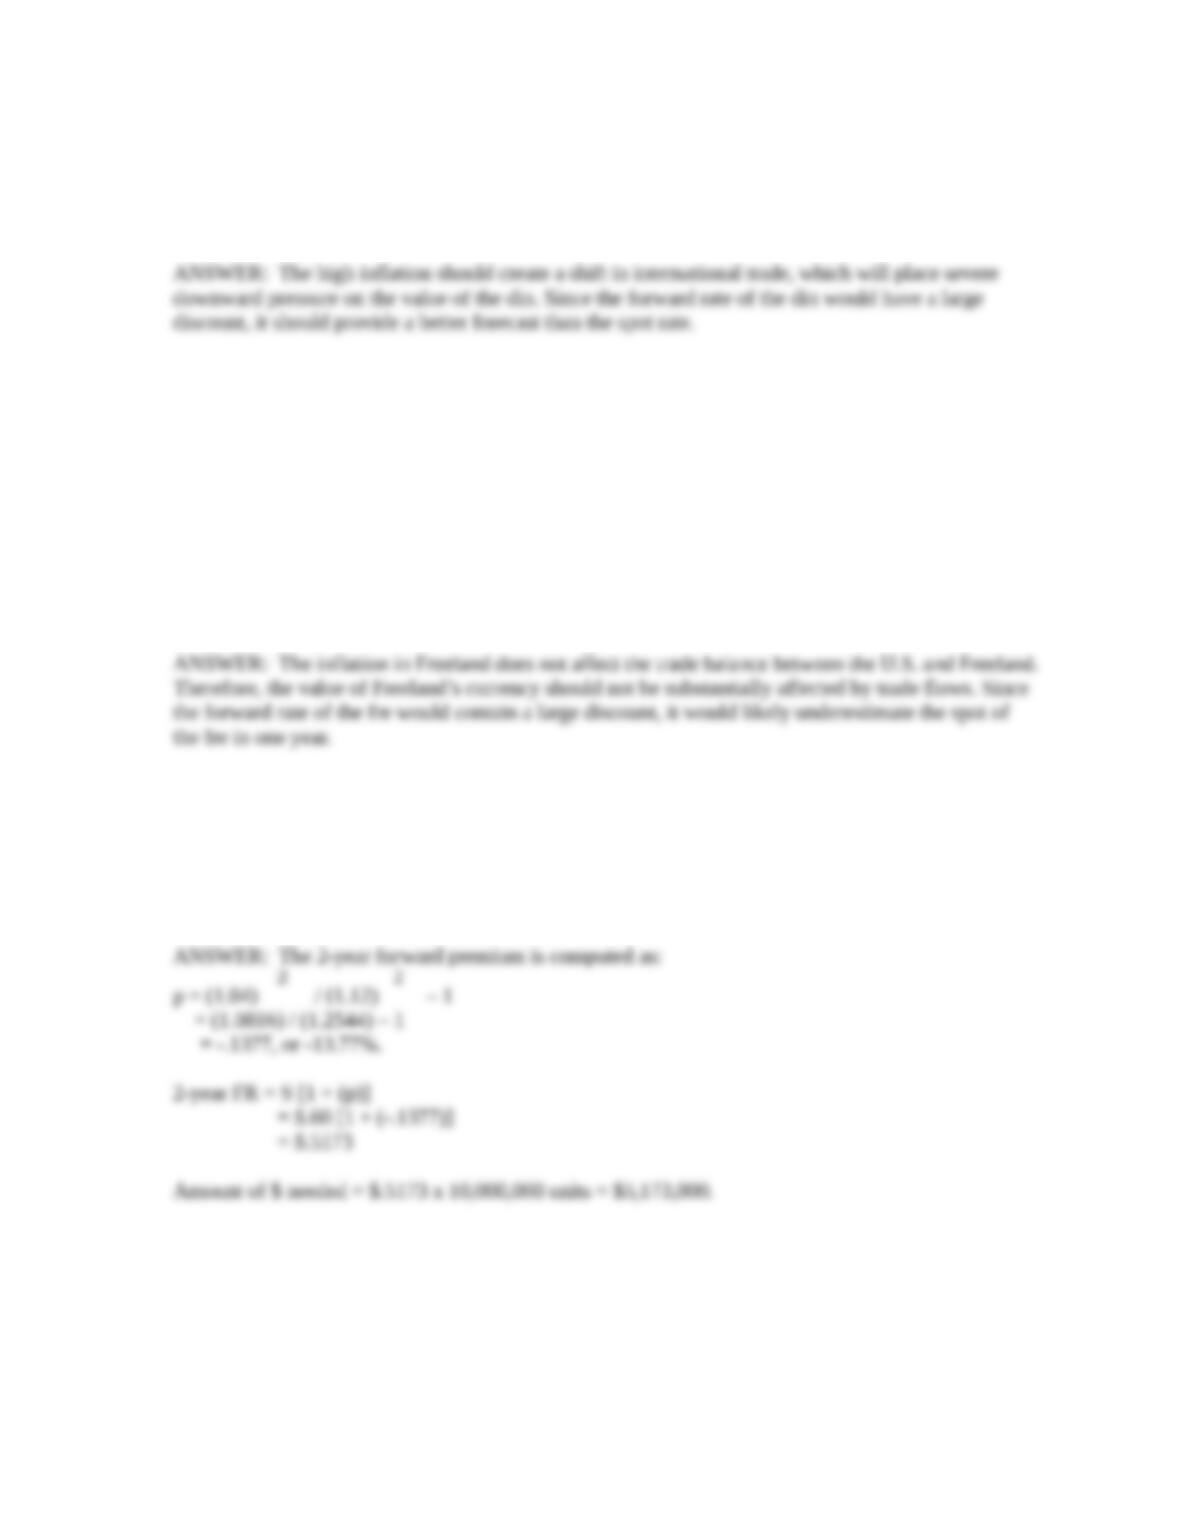
more than 40%. Do you think that the prevailing spot rate or the one-year forward rate would
result in a more accurate forecast of Dinland’s currency (the din) one year from now? Explain.
b. Assume that the country Freeland engages in much trade with the U.S. and the trade involves
many different products. Freeland has had a zero trade balance with the U.S. (the value of exports
and imports is about the same) in the past. You expect high inflation (perhaps about 40%) in
Freeland over the next year because of a large increase in the cost of land (and therefore housing)
in Freeland. You believe that the prices of products that Freeland produces will not be affected.
Freeland presently has a one-year risk-free interest rate of more than 40%. Do you think that the
prevailing one-year forward rate of Freeland’s currency (the fre) would overestimate,
underestimate, or be a reasonably accurate forecast of the spot rate one year from now? [Presume
a direct quotation of the exchange rate, so that if the forward rate underestimates, it means that its
value is less than the realized spot rate in one year. If the forward rate overestimates, it means
that its value is more than the realized spot rate in one year.]
26. IRP and Forecasting. New York Co. has agreed to pay 10 million Australian dollars (A$) in two
years for equipment that it is importing from Australia. The spot rate of the Australian dollar is $.60.
The annualized U.S. interest rate is 4%, regardless of the debt maturity. The annualized Australian
dollar interest rate is 12% regardless of the debt maturity. New York plans to hedge its exposure with
a forward contract that it will arrange today. Assume that interest rate parity exists. Determine the
amount of U.S. dollars that New York Co. will need in 2 years to make its payment.
27. Forecasting Based on the International Fisher Effect. Purdue Co. (based in the U.S.) exports cable
wire to Australian manufacturers. It invoices its product in U.S. dollars, and will not change its price
over the next year. There is intense competition between Purdue and the local cable wire producers
that are based there. Purdue’s competitors invoice their products in Australian dollars and will not be
changing their prices over the next year. The annualized risk-free interest rate is presently 8% in the
U.S., versus 3% in Australia. Today the spot rate of the Australian dollar is $.55. Purdue Co. uses this
© 2018 Cengage Learning. All Rights Reserved. May not be copied, scanned, or duplicated, in whole or in part, except for use as
permitted in a license distributed with a certain product or service or otherwise on a password-protected website for classroom use.
Forecasting Exchange Rates 3
spot rate as a forecast of future exchange rate of the Australian dollar. Purdue expects that revenue
from its cable wire exports to Australia will be about $2 million over the next year.
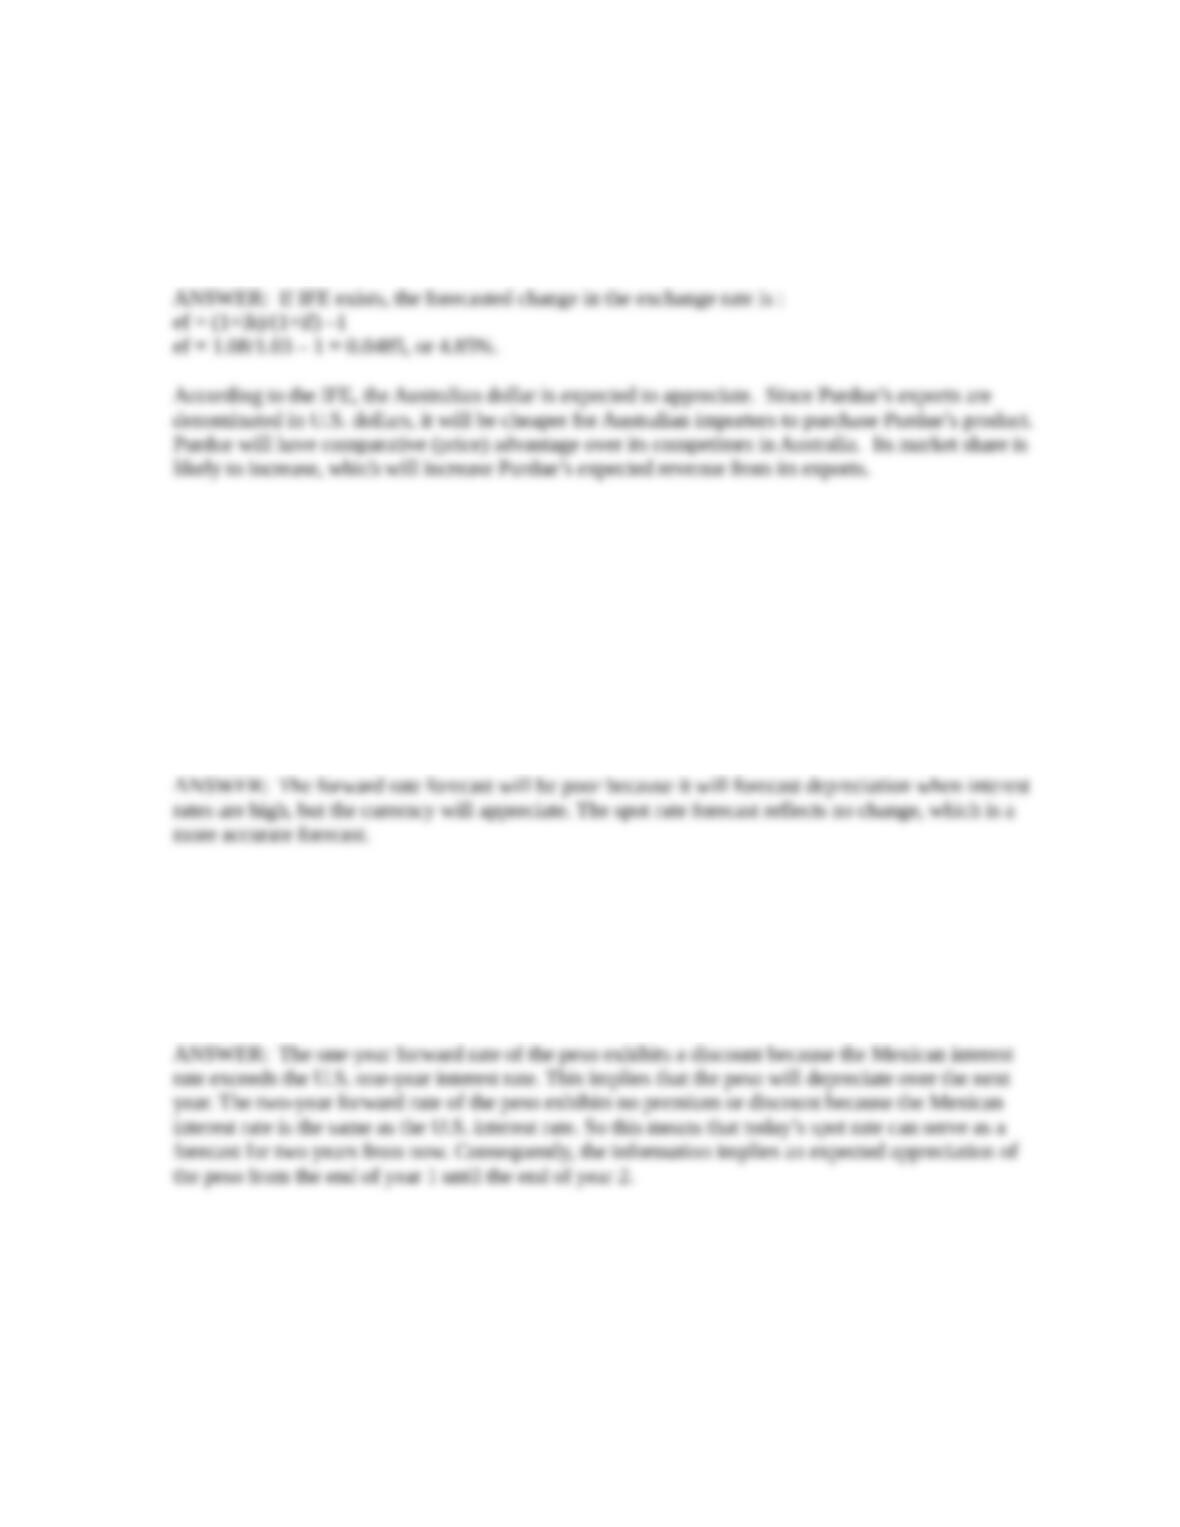
If Purdue decides to use the international Fisher effect rather than the spot rate to forecast the
exchange rate of the Australian dollar over the next year, will its expected revenue from its exports be
higher, lower, or unaffected? Explain.
28. IRP, Expectations, and Forecast Error. Assume that interest rate parity exists and it will continue to
exist in the future. Assume that interest rates of the U.S. and the U.K. vary substantially in many
periods. You expect that interest rates at the beginning of each month have a major effect on the
British pound’s exchange rate at the end of each month, because you believe that capital flows
between the U.S. and the U.K. influence the pound’s exchange rate. You expect that money will flow
to whichever country has the higher nominal interest rate. At the beginning of each month, you will
either use the spot rate or the one-month forward rate to forecast the future spot rate of the pound that
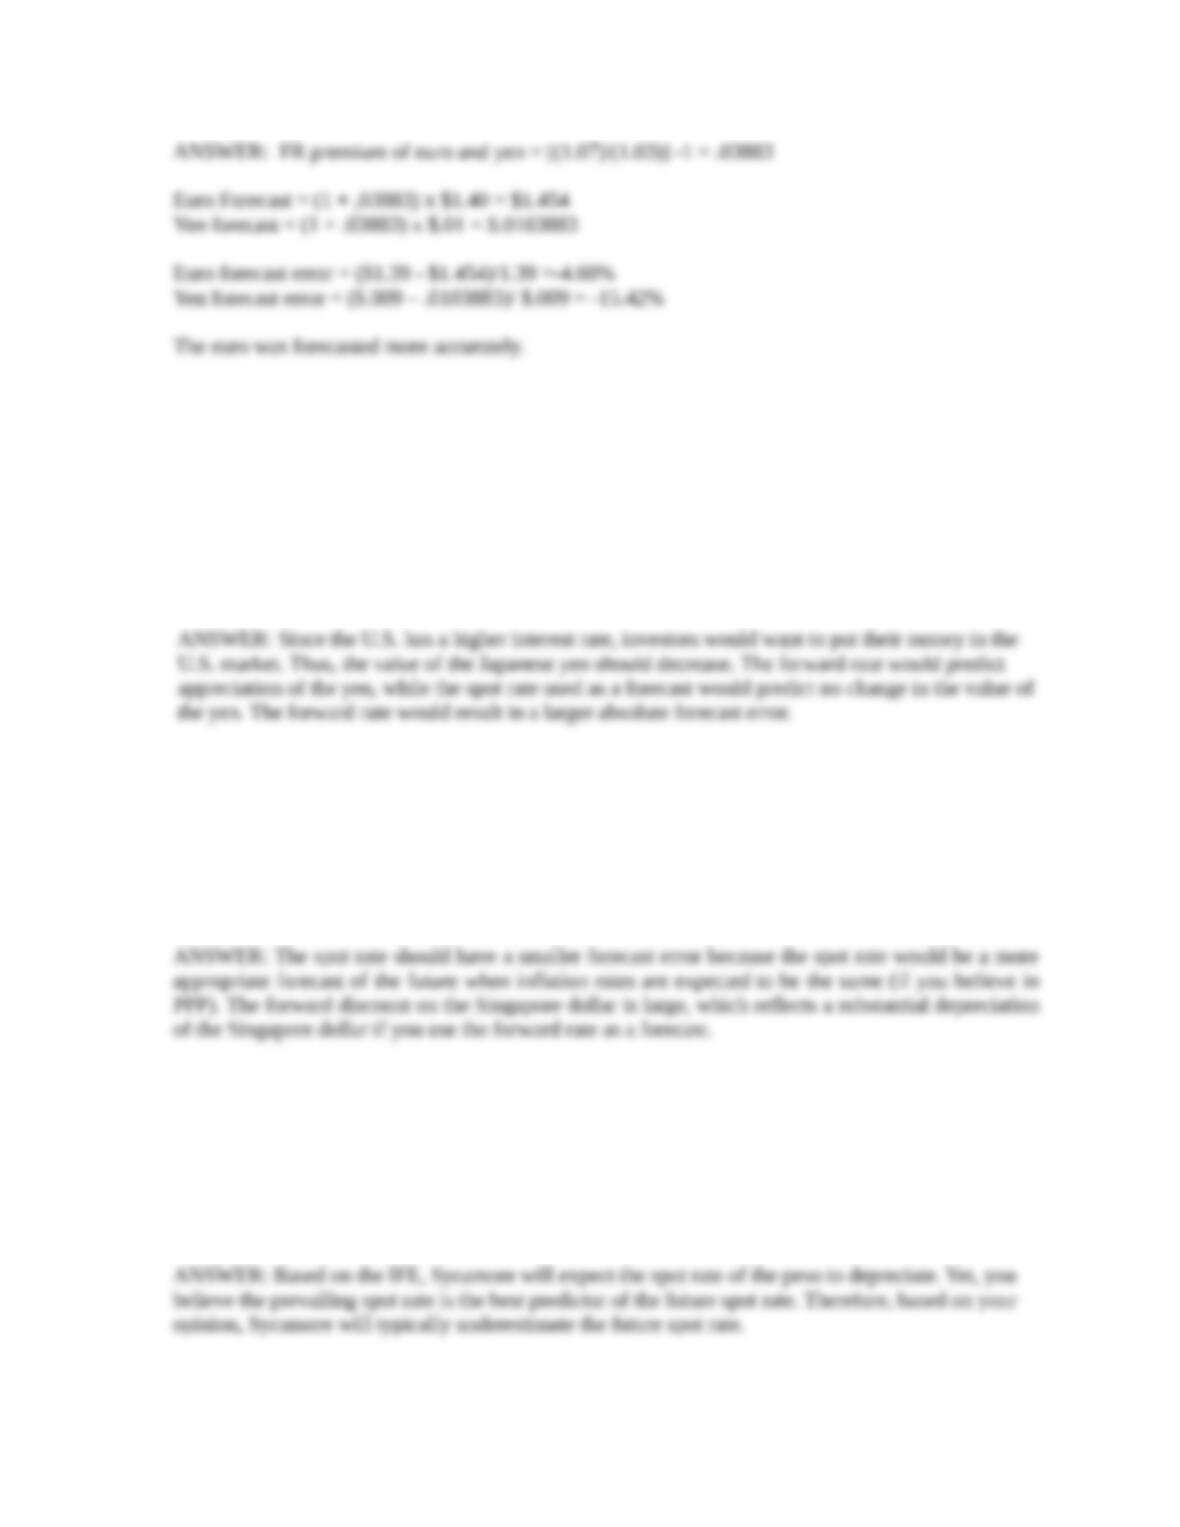
will exist at the end of the month. Will the use of the spot rate as a forecast result in smaller, larger or
the same mean absolute forecast error as the forward rate when forecasting the future spot rate of the
pound on a monthly basis? Explain.
29. Deriving Forecasts from Forward Rates. Assume that interest rate parity exists. Today, the one-
year U.S. interest rate is equal to 8%, while Mexico’s one-year interest rate is equal to 10%. Today,
the two-year annualized U.S. interest rate is equal to 11%, while the two-year annualized Mexican
interest rate is equal to 11%. West Virginia Co. uses the forward rate to predict the future spot rate.
Based on forward rates for one year ahead, and two years ahead, will the peso appreciate or
depreciate from the end of year 1 until the end of year 2?
30. Forecast Errors from Forward Rates. Assume that interest rate parity exists. One year ago, the spot
rate of the euro was $1.40 and the spot rate of the Japanese yen was $.01. At that time, the one-year
interest rate of the euro and Japanese yen was 3% and the one-year U.S. interest rate was 7%. One
year ago, you used the one-year forward rate of the euro to derive a forecast of the future spot rate of
the euro and the yen one year ahead. Today, the spot rate of the euro is $1.39, while the spot rate of
the yen is $.009. Which currency did you forecast more accurately?
© 2018 Cengage Learning. All Rights Reserved. May not be copied, scanned, or duplicated, in whole or in part, except for use as
permitted in a license distributed with a certain product or service or otherwise on a password-protected website for classroom use.
Forecasting Exchange Rates 4
31. Forward Versus Spot Rate Forecasts. Assume that interest rate parity exists and it will continue to
exist in the future. Kentucky Co. wants to forecast the value of the Japanese yen in one month. The
Japanese interest rate is lower than the U.S. interest rate. Kentucky Co. will either use the spot rate or
the one-month forward rate to forecast the future spot rate of the yen at the end of one month. Your
opinion is that net capital flows between countries tend to move toward whichever country has the
higher nominal interest rate, and that these capital flows are the primary factor that affects the value
of the currency. Will the forward rate as a forecast result in a smaller, larger or the same absolute
forecast error as the use of today’s spot rate when forecasting the future spot rate of the yen in one
month? Briefly explain.
32. Forward Versus Spot Rate Forecast. Assume that interest rate parity exists. The one-year risk-free
interest rate in the U.S. is 3 percent, versus 16 percent in Singapore. You believe in purchasing power
parity, and you also believe that Singapore will experience a 2% inflation rate, and the U.S. will
experience a 2% inflation rate over the next year. If you wanted to forecast the Singapore dollar’s spot
rate for one year ahead, do you think that the forecast error would be smaller when using today’s one-
year forward rate of the Singapore dollar as the forecast or using today’s spot rate as the forecast?
Briefly explain.
33. Forecasting Based on the IFE. The prevailing one-year risk-free interest rate in Argentina is higher
than in the U.S. and will continue to be higher over time. Sycamore Co. believes the international
Fisher effect (IFE) can be used to derive the best forecast of the peso’s exchange rate movement over
time. However, you believe that the prevailing spot rate is the best forecast of the future spot rate.
Based on your opinion, will Sycamore Co. typically overestimate the future spot rate, underestimate
the future spot rate, or create an unbiased forecast (similar chance of overestimating or
underestimating the future spot rate) of the Argentine peso? Briefly explain.
CRITICAL THINKING
© 2018 Cengage Learning. All Rights Reserved. May not be copied, scanned, or duplicated, in whole or in part, except for use as
permitted in a license distributed with a certain product or service or otherwise on a password-protected website for classroom use.
Forecasting Exchange Rates 5
Forecasting Exchange Rates of Currencies in Developing Countries Some U.S.-based MNCs have
business in developing countries in which it is difficult to hedge their exposure to exchange rate risk.
Their forecasts of the currency’s future exchange rate is subject to much error because the currencies in
these countries tend to be very volatile, and could possibly depreciate by 20% or more in a given year..
Write a short essay on how MNCs that have receivables in these currencies might be able to use exchange
rate forecasts to prepare for possible weak currency scenarios, so that they can assess whether they will
have sufficient dollar cash inflows to cover their debt payments.
ANSWER
Solution to Continuing Case Problem: Blades, Inc.
1. Considering both Blades’ current practices and future plans, how can it benefit from forecasting the
baht-dollar exchange rate?
2. Which forecasting technique (i.e., technical, fundamental, or market-based) would be easiest to use in
forecasting the future value of the baht? Why?
3. Blades is considering using either current spot rates or available forward rates to forecast the future
value of the baht. Available forward rates currently exhibit a large discount. Do you think the spot or
the forward rate will yield a better market-based forecast? Why?
© 2018 Cengage Learning. All Rights Reserved. May not be copied, scanned, or duplicated, in whole or in part, except for use as
permitted in a license distributed with a certain product or service or otherwise on a password-protected website for classroom use.
Forecasting Exchange Rates 6
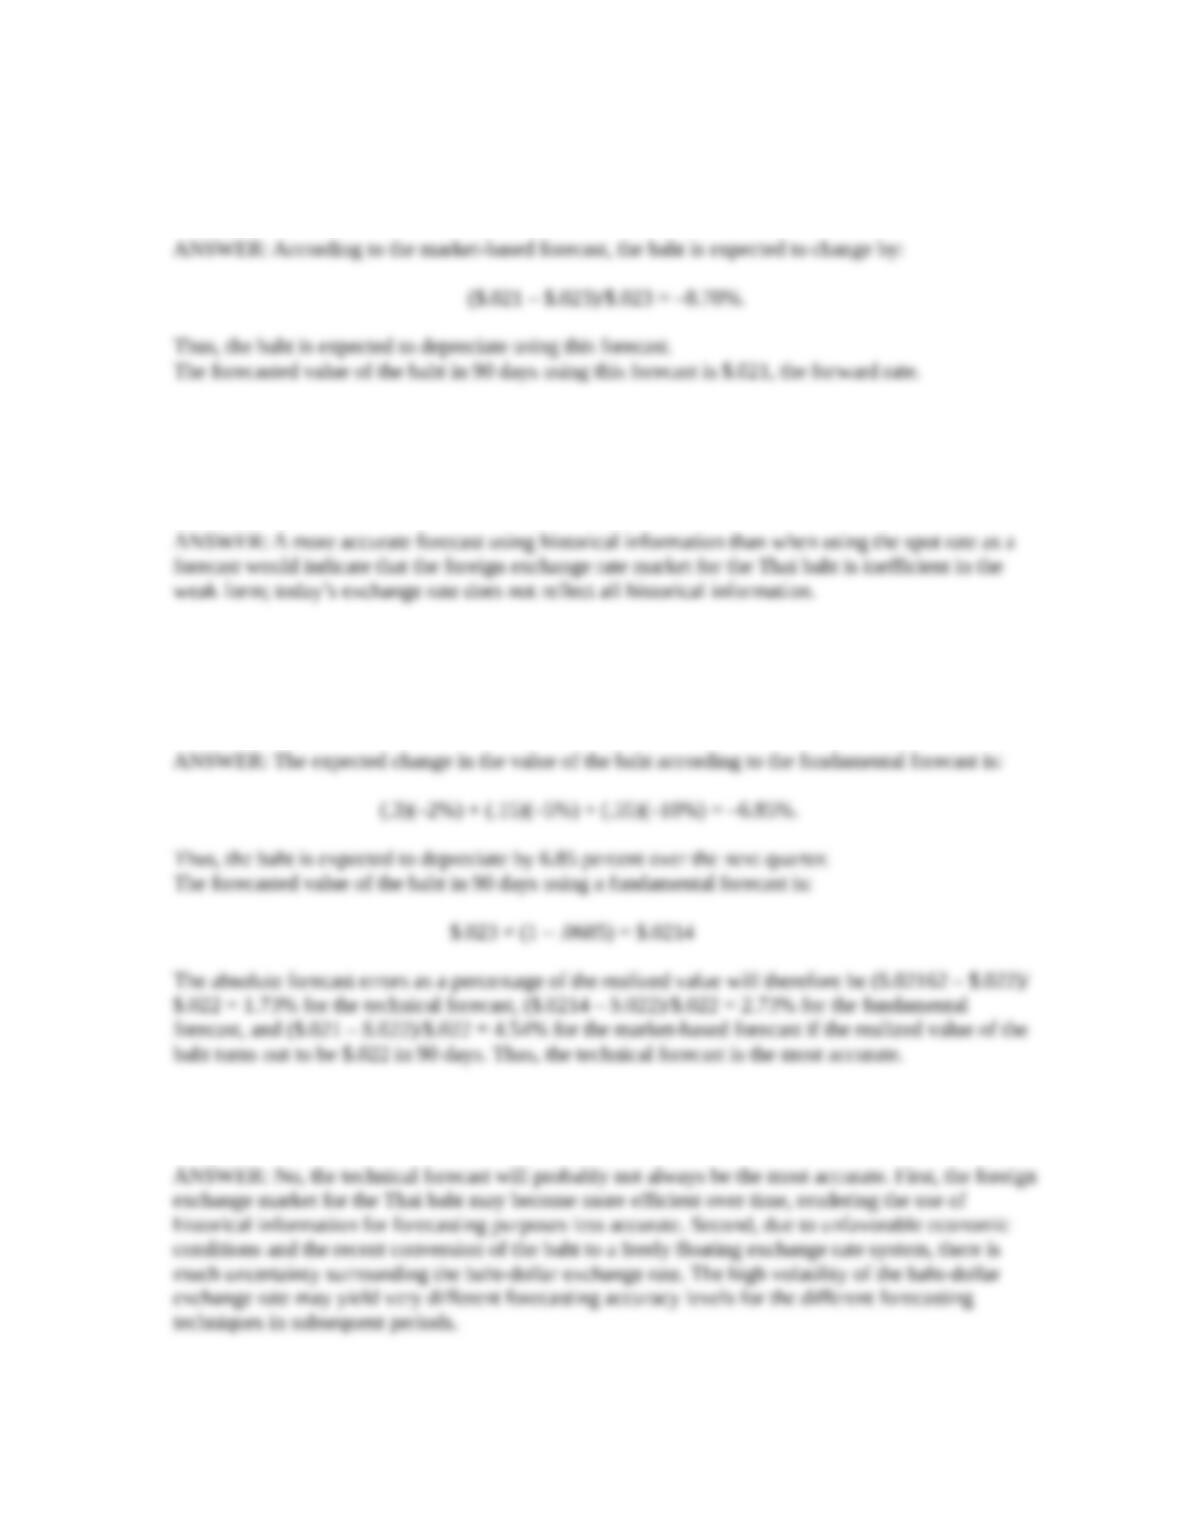
4. The current 90-day forward rate for the baht is $.021. By what percentage is the baht expected to
change over the next quarter according to a market-based forecast using the forward rate? What will
be the value of the baht in 90 days according to this forecast?
5. Assume that the technical forecast has been more accurate than the market-based forecast in recent
weeks. What does this indicate about market efficiency for the baht-dollar exchange rate? Do you
think this means that technical analysis will always be superior to other forecasting techniques in the
future? Why or why not?
6. What is the expected percentage change in the value of the baht during the next quarter based on the
fundamental forecast? What is the forecasted value of the baht using this forecast? If the value of the
baht 90 days from now turns out to be $.022, which forecasting technique is the most accurate? (Use the
absolute forecast error as a percentage of the realized value to answer the last part of this question.)
7. Do you think the technique you have identified in question 6 will always be the most accurate? Why
or why not?
© 2018 Cengage Learning. All Rights Reserved. May not be copied, scanned, or duplicated, in whole or in part, except for use as
permitted in a license distributed with a certain product or service or otherwise on a password-protected website for classroom use.

Forecasting Exchange Rates 7
Solution to Supplemental Case: Whaler Publishing Co.
1. The first step is to measure the standard deviation of the percentage change in each exchange rate,
which can most easily be done with a spreadsheet. This information can then be used along with
today’s spot exchange rate to derive the confidence intervals for each exchange rate.
Approximate 68 Percent 95 Percent
Standard Confidence Confidence
Currency Deviation Interval Interval
Australian $ 9.59% $.6935 to $.8407 $.6200 to $.9142
Canadian $ 5.10 $.8185 to $.9065 $.7745 to $.9505
New Zealand $ 12.03 $.5265 to $.6705 $.4545 to $.7425
British pound 16.40 $1.6203 to $2.2560 $1.3024 to $2.5739
Using the intervals described above and the number of foreign currency units to be received from
each country, the range of forecasted U.S. dollar revenues (in thousands) from each country is
disclosed below:
68 Percent 95 Percent
Confidence Confidence
Currency Interval Interval
Australian $ $26,353 to $31,946 $23,560 to $34,739
Canadian $ $28,647 to $31,727 $27,107 to $33,267
New Zealand $ $17,374 to $22,126 $14,998 to $24,502
British pound $55,090 to $76,704 $44,282 to $87,512
The numbers here may differ slightly from those the students compute due to rounding. The standard
deviations estimated above suggest that the Canadian dollar is the most stable currency so the U.S.
dollar revenues coming from Canada are more predictable. Conversely, the standard deviation of the
British pound has been most volatile, so that the U.S. dollar revenues coming from the United
Kingdom are less predictable. The above comparison of predictability of U.S. dollar revenues from
various countries assumes that the foreign currency revenues in each country is known. In other
words, the reason for the uncertainty in dollar revenues is the exchange rate, not the demand for
textbooks by each given country.
Notice that the estimates were not pooled in any way to derive a confidence interval about the overall
dollar revenues. This would require an assumption that each exchange rate moves independently of
the others. If some of these currencies were positively correlated, such an assumption would cause
one to underestimate the dispersion in the confidence interval when combining estimates from
individual countries. If time permits, you may wish to challenge the students by asking them whether
combining the individual country results would be appropriate. The supplemental case in the
following chapter focuses on this issue and is an extension of this case.
Small Business Dilemma
Exchange Rate Forecasting by the Sports Exports Company
© 2018 Cengage Learning. All Rights Reserved. May not be copied, scanned, or duplicated, in whole or in part, except for use as
permitted in a license distributed with a certain product or service or otherwise on a password-protected website for classroom use.
Forecasting Exchange Rates 8
1. Explain how Jim can use technical forecasting to forecast the future value of the pound. Based on the
information provided, do you think that a technical forecast will predict future appreciation or
depreciation in the pound?
2. Explain how Jim can use fundamental forecasting to forecast the future value of the pound. Based on
the information provided, do you think that a fundamental forecast will predict appreciation or
depreciation in the pound?
3. Explain how Jim can use a market-based forecast to forecast the future value of the pound. Do you
think the market-based forecast will predict appreciation, depreciation, or no change in the value of
the pound?
4. Does it appear that all of the forecasting techniques will lead to the same forecast of the pound’s
future value? Which technique would you prefer to use in this situation?
© 2018 Cengage Learning. All Rights Reserved. May not be copied, scanned, or duplicated, in whole or in part, except for use as
permitted in a license distributed with a certain product or service or otherwise on a password-protected website for classroom use.