Chapter 3
Evaluation of Financial Performance
CHAPTER 3
EVALUATION OF FINANCIAL
PERFORMANCE
ANSWERS TO QUESTIONS:
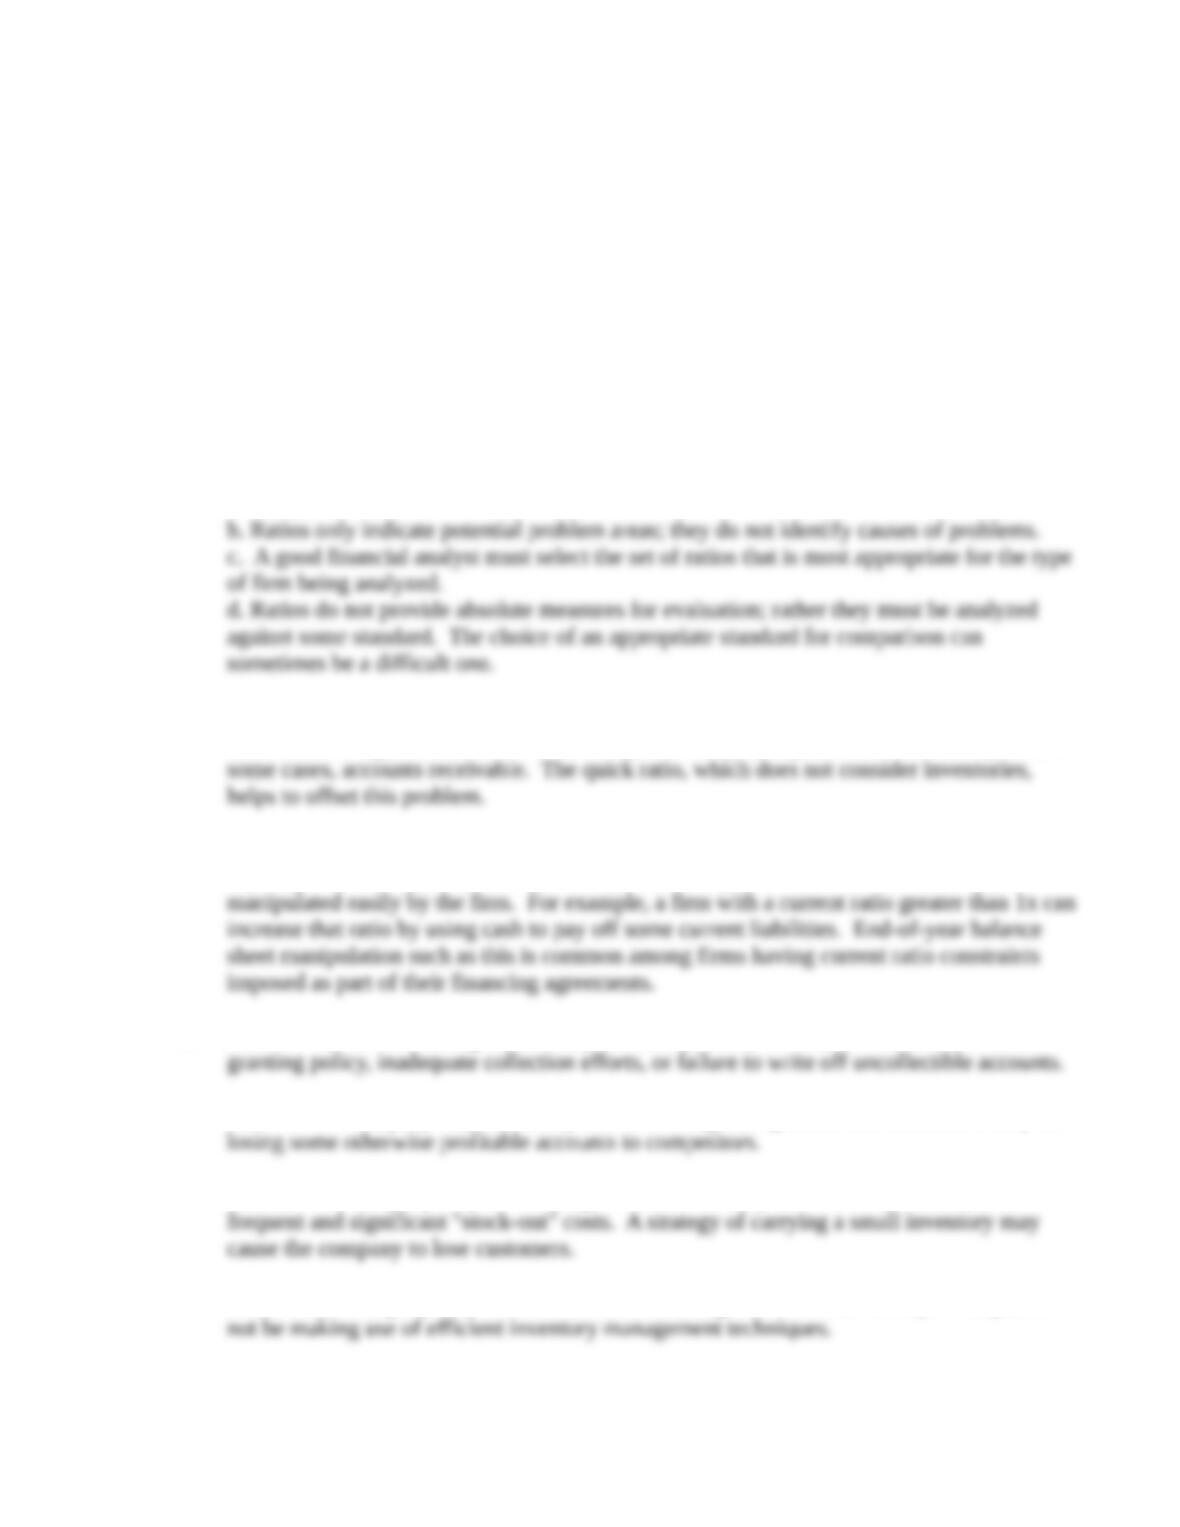
1. The primary limitations of ratio analysis as a technique of financial statement analysis are:
a. Ratios are retrospective and do not directly incorporate forecasts of future performance
of a firm.
2. The major limitation of the current ratio as a measure of liquidity is the inclusion in the
current assets figure of some assets that may not be highly liquid, such as inventory and, in
Another limitation is the fact that it is a static (based on the balance sheet) measure of
liquidity, whereas liquidity is a dynamic (flow) concept. Also, the current ratio may be
3. Above: The firm is having collection problems, possibly because of too liberal a credit
Below: The company may be unduly restrictive in granting credit and therefore it may be
4. Above: The company may be carrying too little inventory and thus may be subject to
Below: The company may have a lot of slow-moving or obsolete inventory. It may also
3-.
Chapter 3
Evaluation of Financial Performance
5. The fixed asset turnover ratio is subject to four major limitations in comparative analyses.
The ratio is sensitive to:
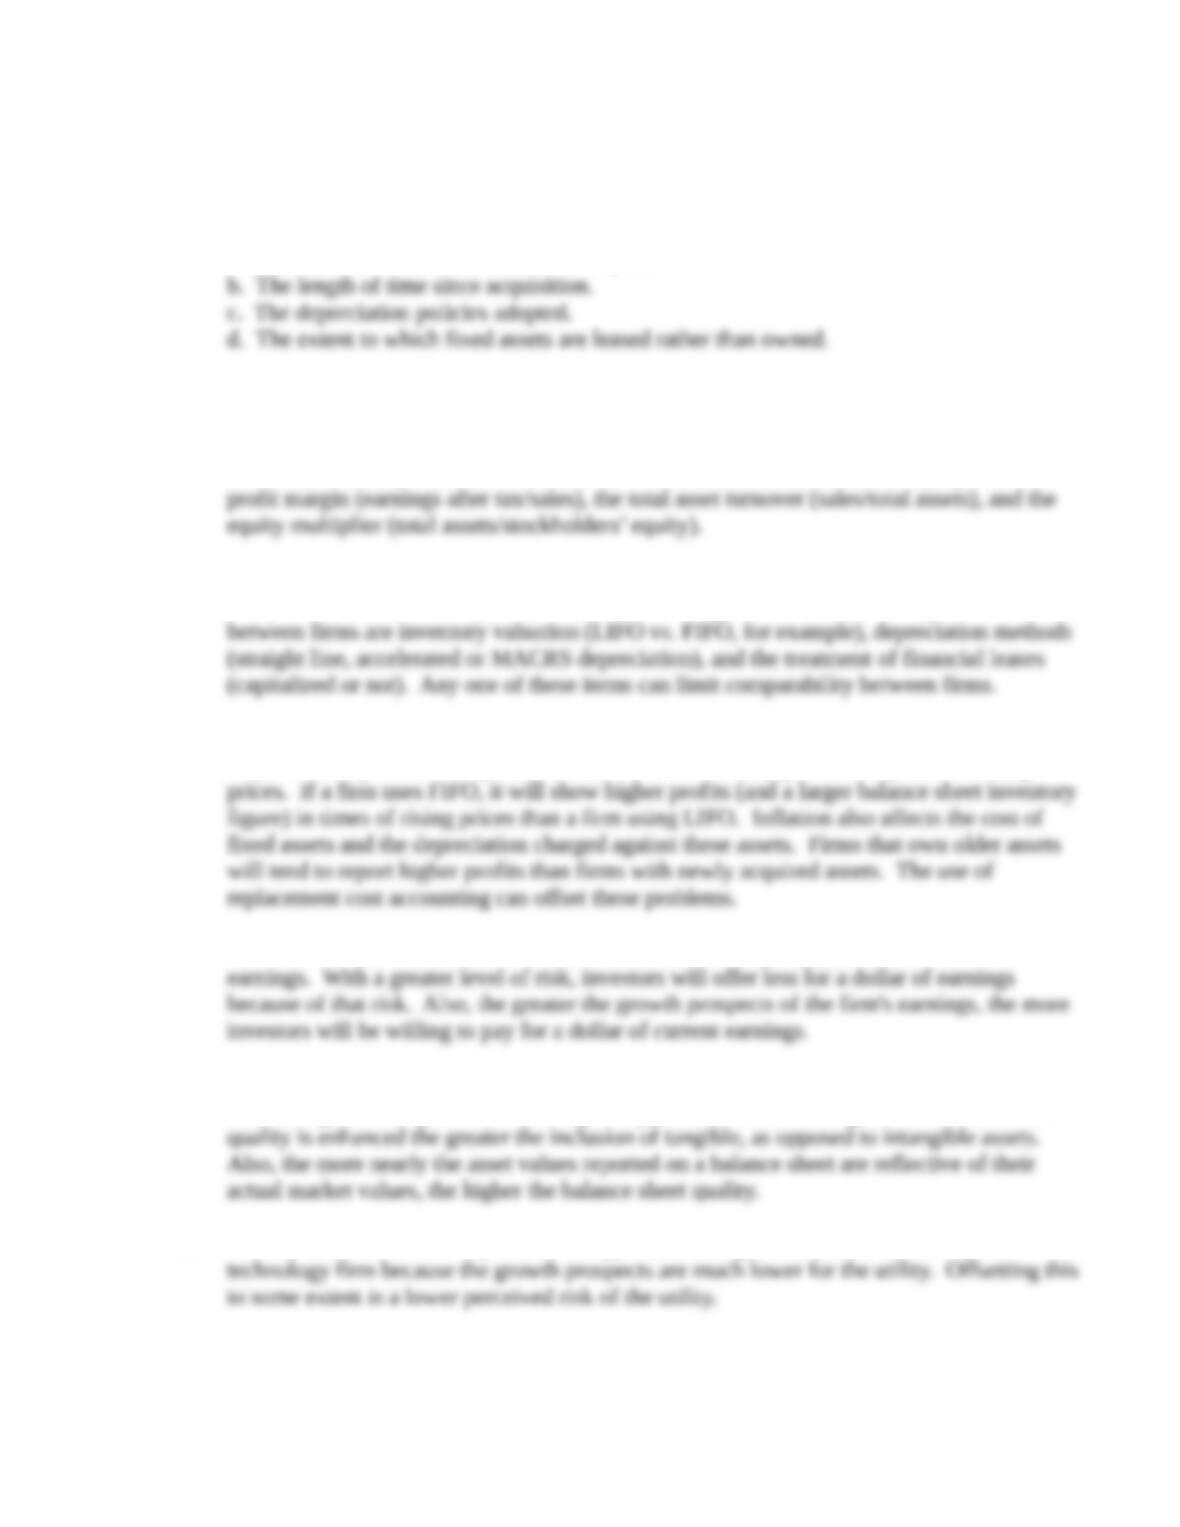
a. The cost of the assets at the date of acquisition.
Each of these factors will differ from firm to firm, making meaningful comparative analyses
difficult.
6. The three most important determinants of a firm’s return on stockholders’ equity are net
7. Alternative accounting procedures can have a significant impact on the validity of
comparative financial analyses. Three of the most significant areas for disagreement
8. Inflation can impact the comparability of financial ratios between firms in a number of
ways. One important example is the existence of inventory profits in a period of rising
9. The P/E multiple indicates how much investors are willing to pay for each dollar of current
10. Generally earnings quality is enhanced the greater the cash portion of earnings and the more
the earnings are composed of recurring, as opposed to non-recurring items. Balance sheet
11. A lower P/E ratio can be expected for a typical natural gas utility than for a computer
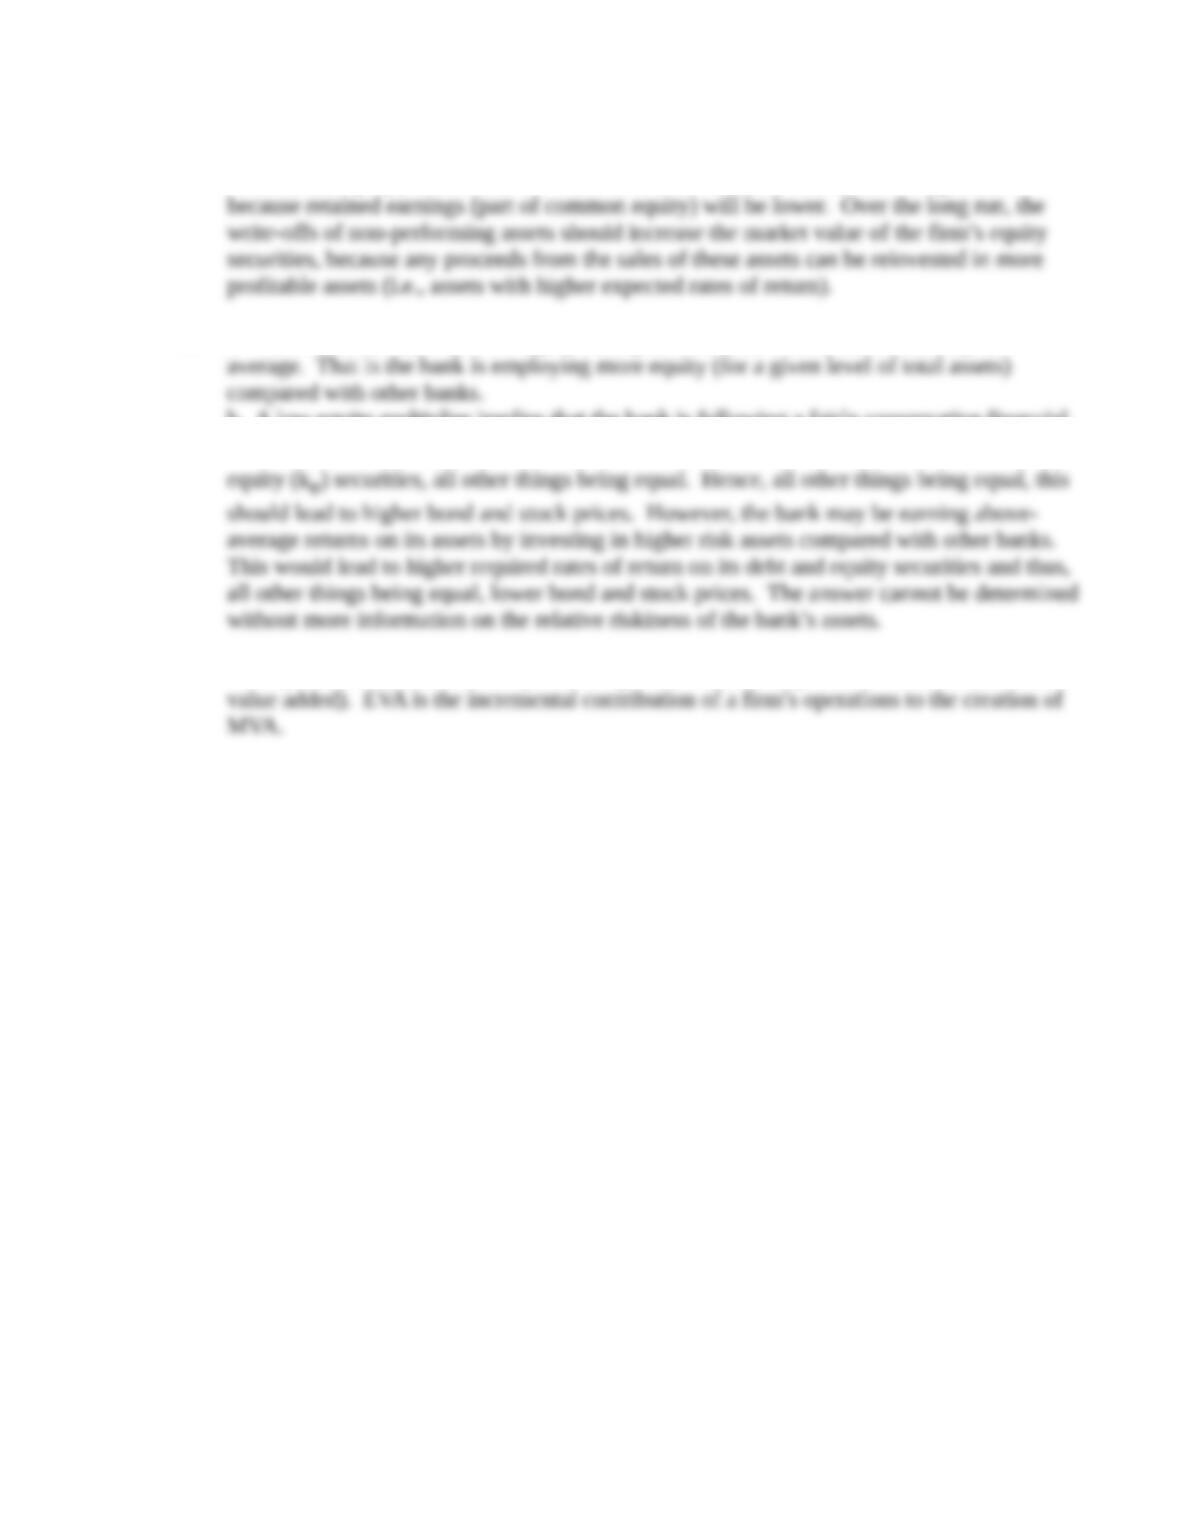
12. Write-offs of non-performing assets should increase the future profitability ratios (e.g.,
3-.
Chapter 3
Evaluation of Financial Performance
return on assets and common equity) since the firm’s total assets and retained earnings (part
of common equity) will be lower. It also should increase the financial leverage ratios
13. a. The bank must have a lower equity multiplier than other banks in the industry, on
b. A low equity multiplier implies that the bank is following a fairly conservative financial
leverage policy, which would lead to lower required rates of return on its debt (kd) and
14. MVA (market value added) is equal to the present value of expected future EVA (economic
3-.
Chapter 3
Evaluation of Financial Performance
SOLUTIONS TO PROBLEMS:
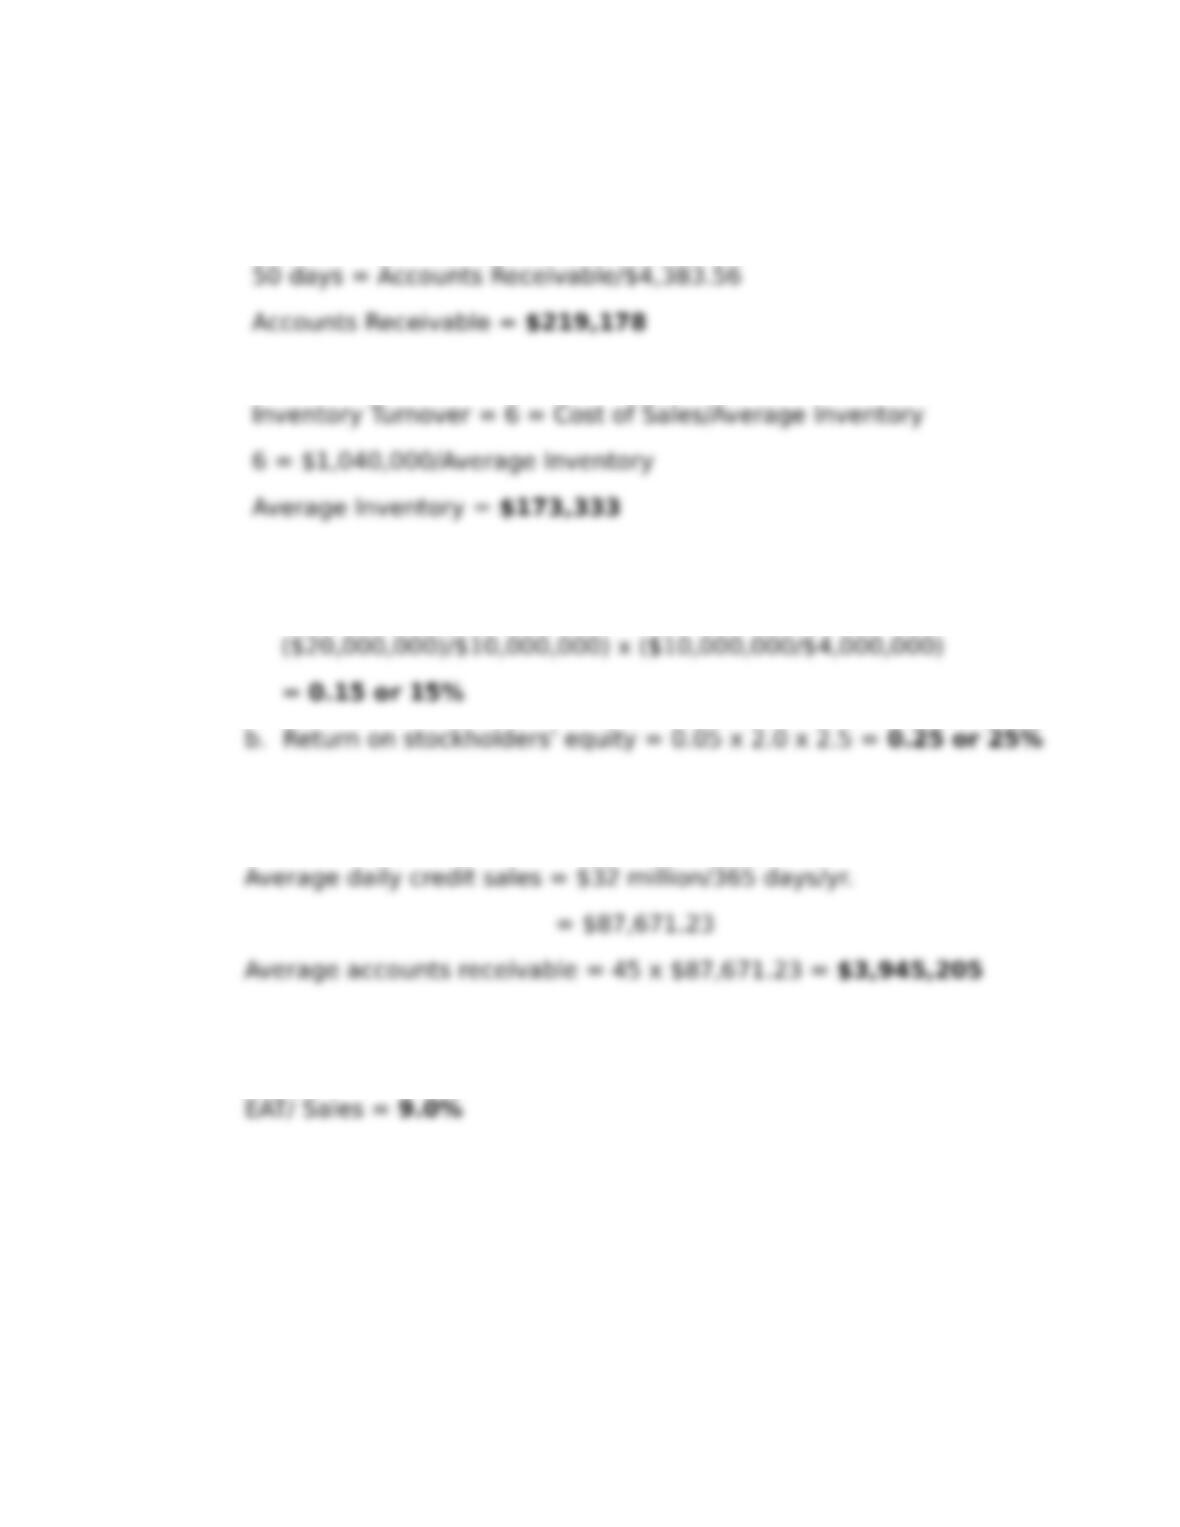
1. a. 50 days = Accounts Receivable/($1,600,000/365 days)
b. Cost of sales = (1 – 0.35)($1,600,000) = $1,040,000
2. a. Return on stockholders’ equity = 0.03 x
3. Credit sales = 0.8($40 million) = $32 million
4. Return on stockholders’ equity = 18% = (EAT/Sales) x 1.0 x 2.0
3-.
Chapter 3
Evaluation of Financial Performance
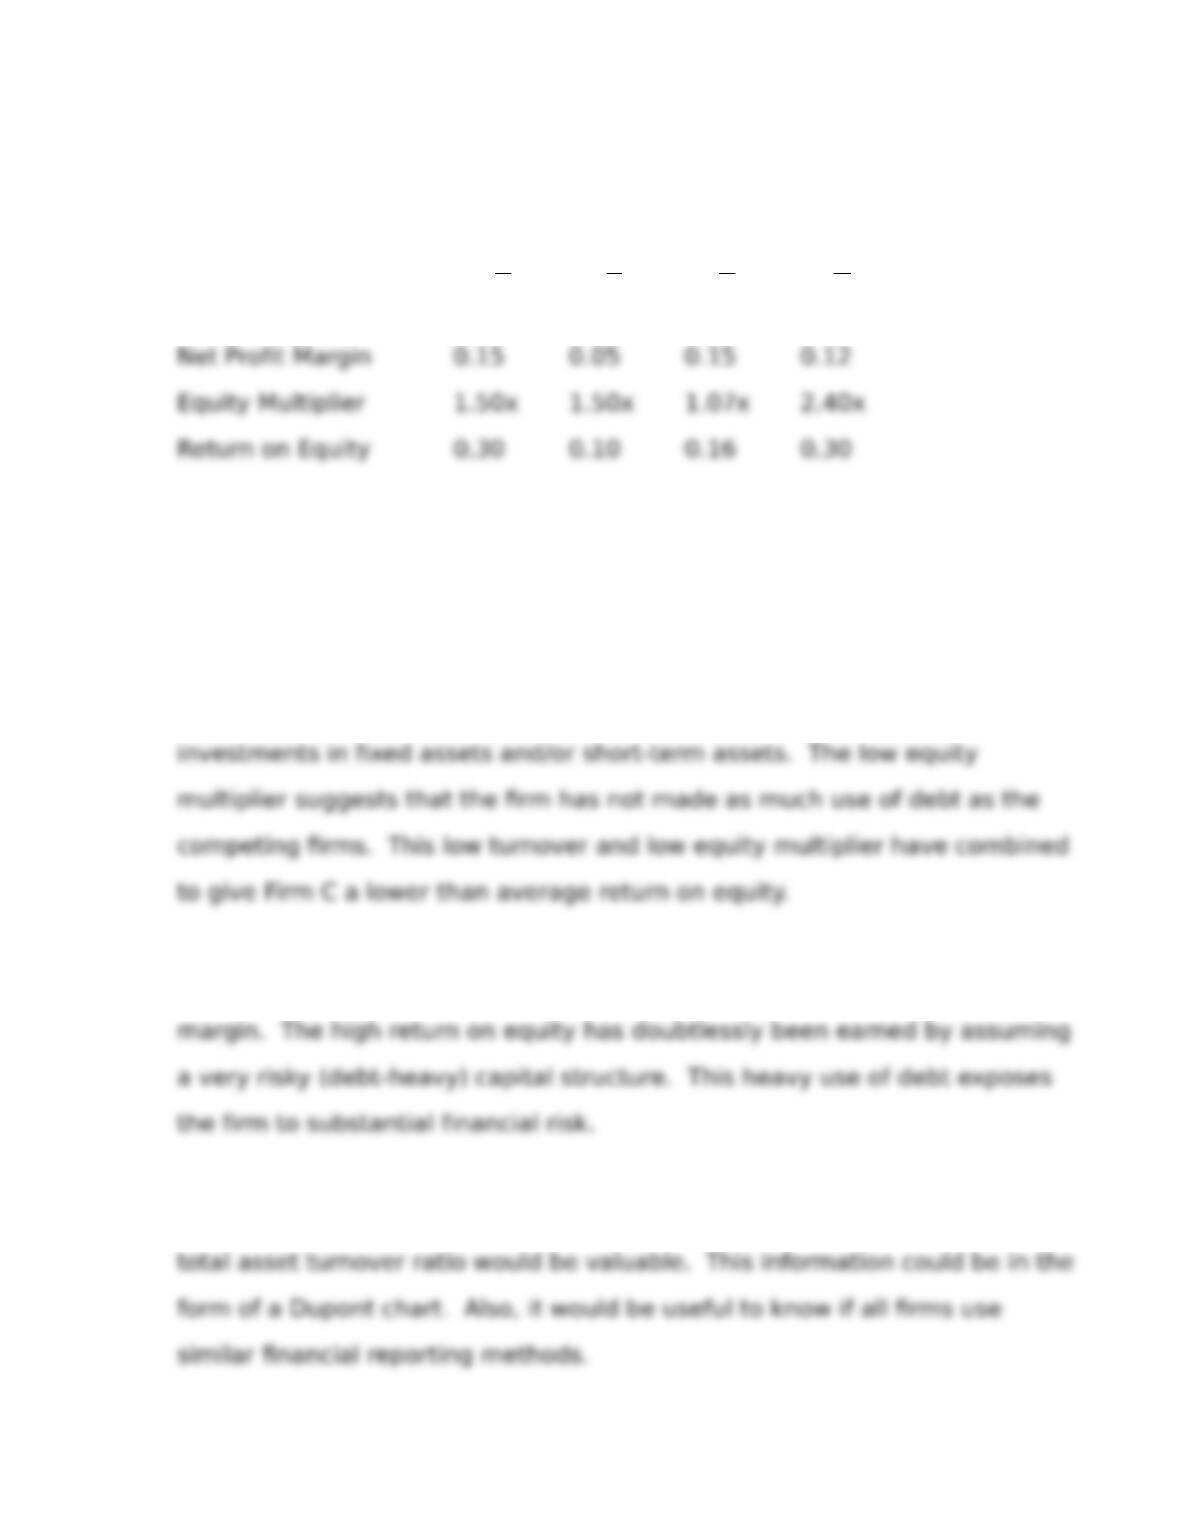
5. a.
Firm
A B C D
Total Asset Turnover 1.33x 1.33x 1.00x 1.04x
b. Firm A appears to have few problems in comparison with the other
7rms.
Firm B has a very weak profit margin, indicating the need for corrective
action to control costs or to change the 7rm’s pricing strategy.
Firm C has a low asset turnover, suggesting the existence of excessive
Firm D has a lower than average asset turnover and an average profit
More detail about the determinants of the net pro7t margin and the
3-.
Chapter 3
Evaluation of Financial Performance
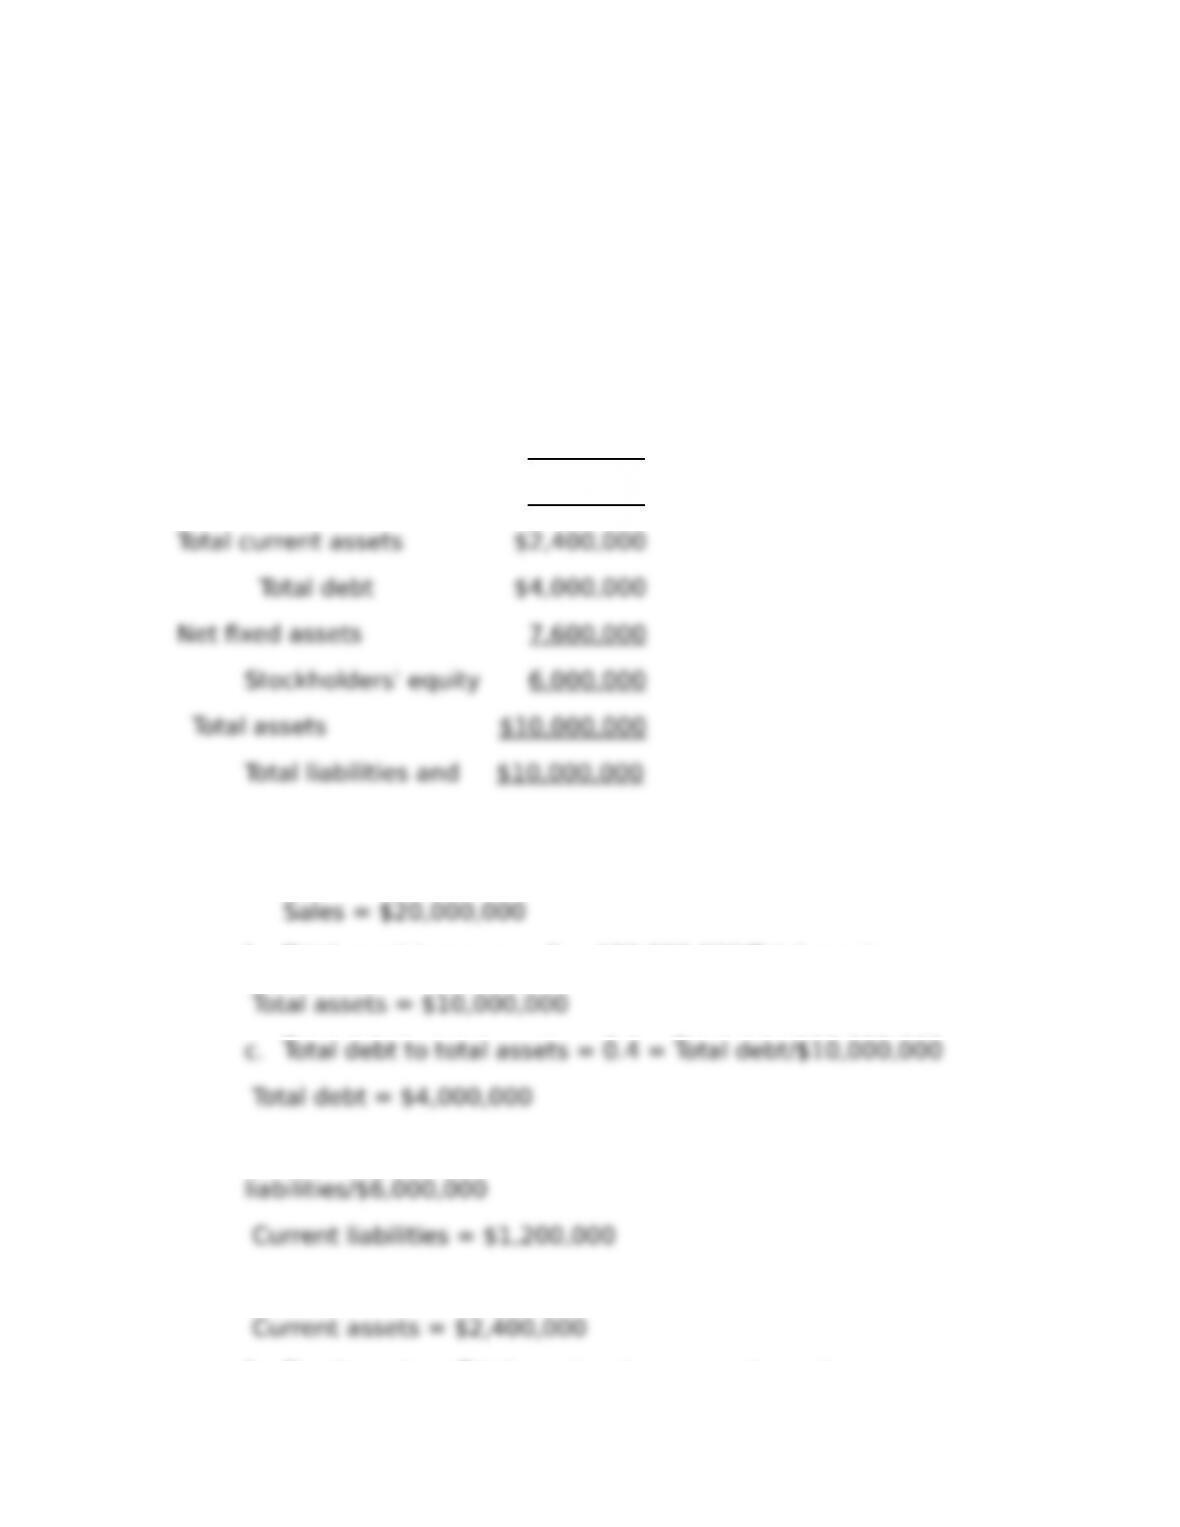
6. Forecasted Balance Sheet
Cash $104,000
Accounts receivable 1,096,000
Total current liabilities $1,200,000
Inventory 1,200,000
Long term debt 2,800,000
stockholders’ equity
a. Pro7t margin on sales = 0.05 = $1,000,000/Sales
b. Total asset turnover = 2 = $20,000,000/Total assets
d. Current liabilities to stockholders’ equity = 0.2 = Current
e. Current ratio = 2 = Current assets/$1,200,000
f. Fixed assets = Total assets minus current assets
3-.
Chapter 3
Evaluation of Financial Performance
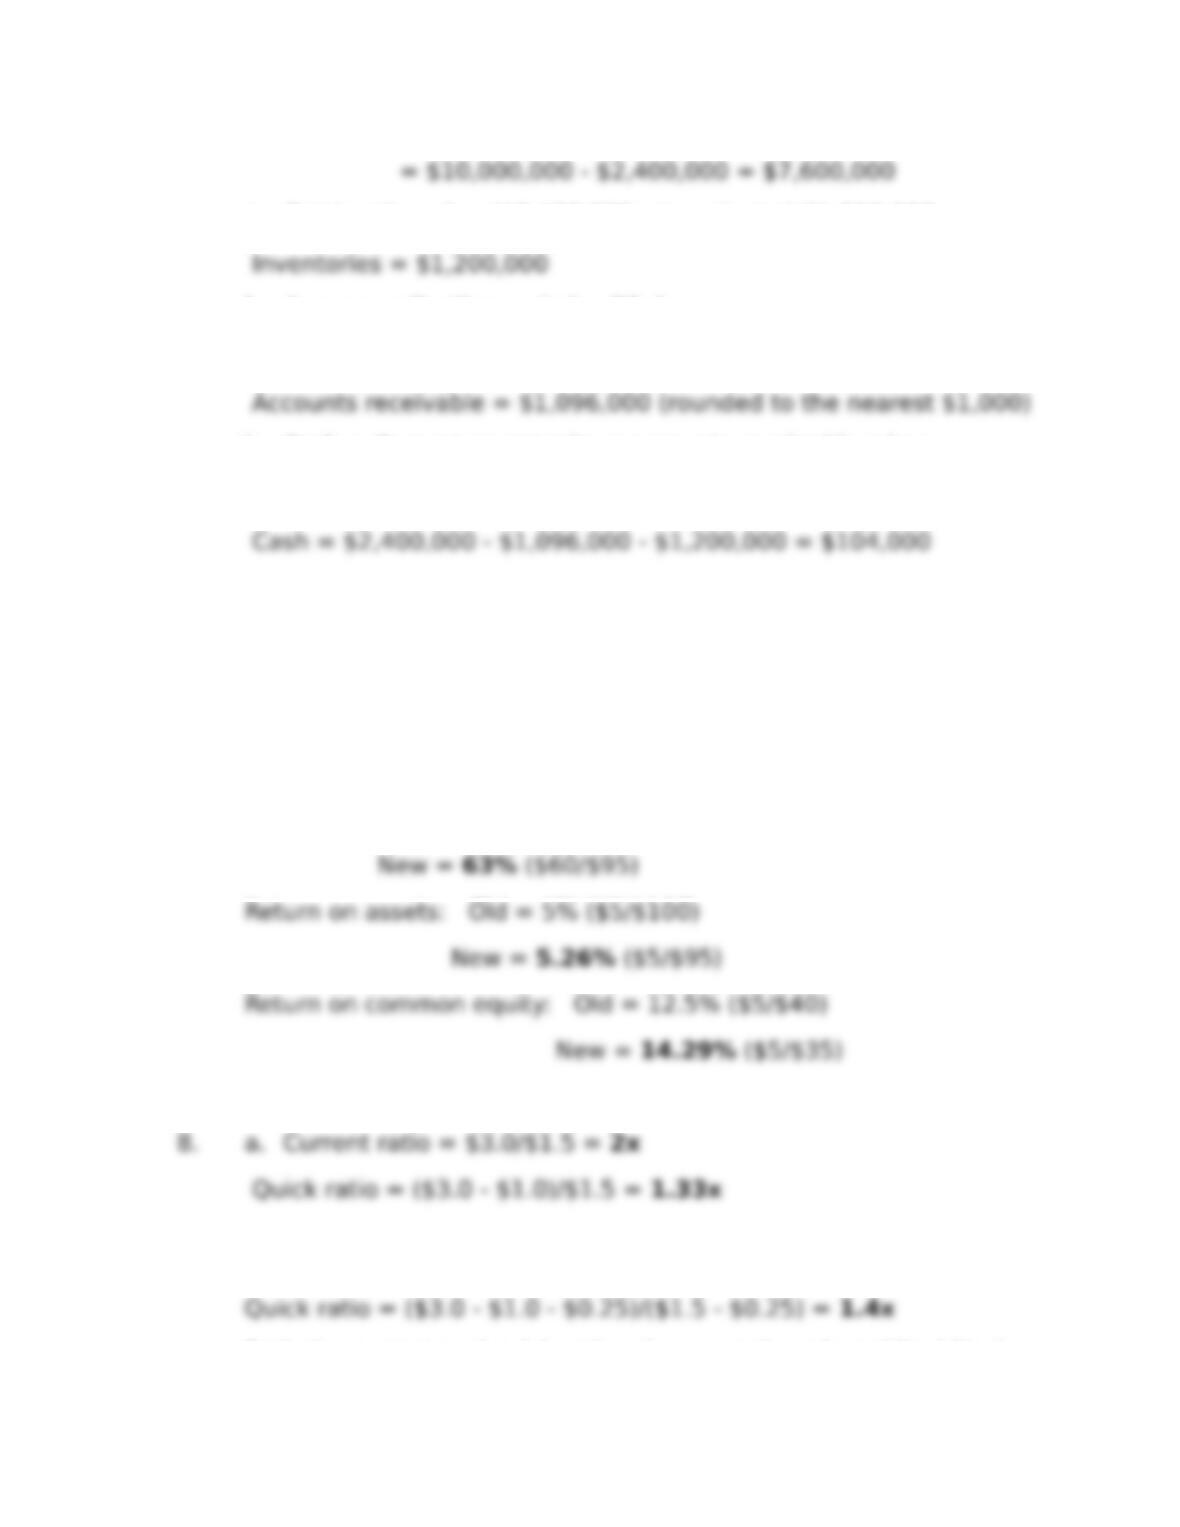
g. Quick ratio = 1 = ($2,400,000 – Inventories)/$1,200,000
h. Average collection period = 20 days
= Accounts receivable/($20,000,000/365)
i. Cash = Current assets minus accounts receivable minus
inventories
7. Reduction in accounts receivable = $5 million (20 days x $0.25
million per day)
New total assets after stock repurchase = $95 million
New common equity after stock repurchase = $35 million
Debt ratio: Old = 60%
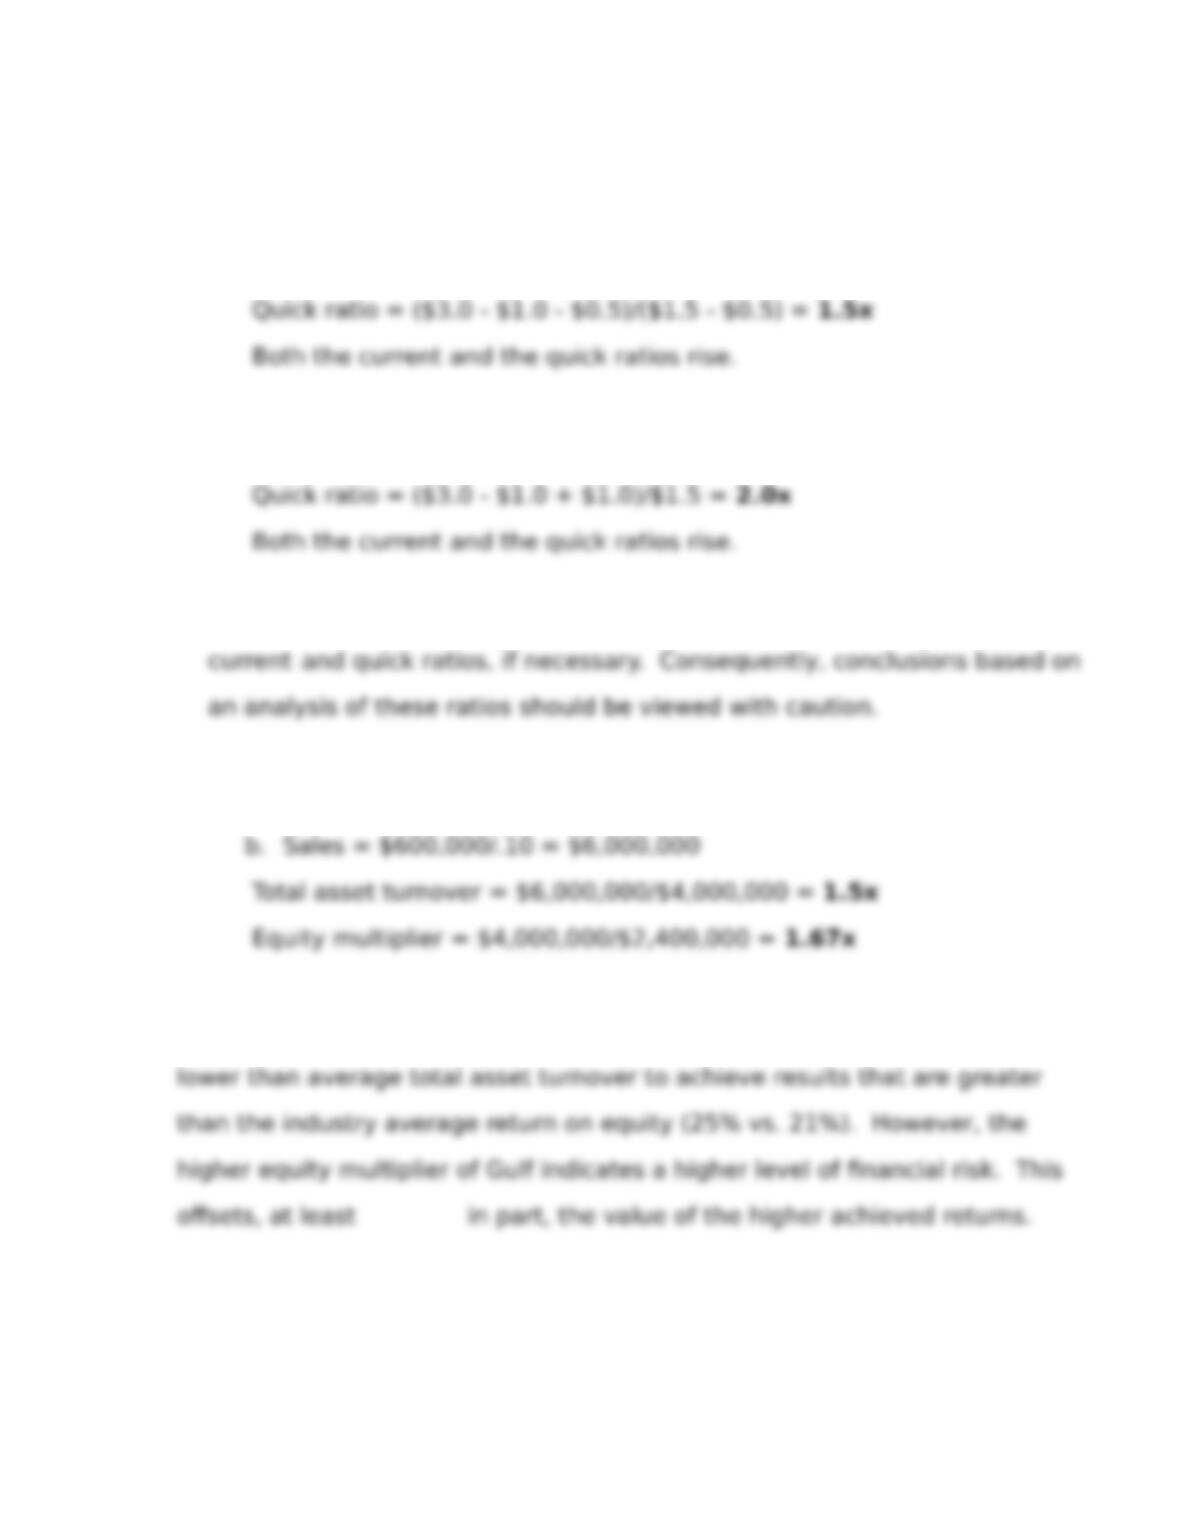
b. Current ratio = ($3.0 – $0.25)/($1.5 – $0.25) = 2.2x
Both the current and quick ratios rise, even though real liquidity has
3-.
Chapter 3
Evaluation of Financial Performance
declined (cash balances are cut in half).
c. Current ratio = ($3.0 – $0.5)/($1.5 – $0.5) = 2.5x
d. Current ratio = ($3.0 + $1.0)/$1.5 = 2.67x
e. These examples illustrate how easy it is for a 7rm to manipulate its
9. a. Return on equity = $600,000/$2,400,000 = 0.25 or 25%
Gulf combines a signiticantly higher than average profit margin (10% vs. 6%)
and a somewhat higher equity multiplier (1.67x vs. 1.4x) with a signiticantly
10. a. Jackson’s current ratio is 1.88x compared to the industry
average of 2.5 times. Jackson’s quick ratio is 0.66x compared to an
3-.
Chapter 3
Evaluation of Financial Performance
b. The company has an average collection period of 38.9 days
compared to an industry average of 35 days. The company’s
c. The company’s times interest earned ratio is 2.89x compared to
the industry average of 3.5x. The company’s total assets to
d. Jackson’s net pro7t margin of 4.44% exceeds the industry
3-.
Chapter 3
Evaluation of Financial Performance
e. Jackson seems to be carrying excessive inventory, resulting in a
lower asset turnover. The company’s liquidity position is also
Equity multiplier
The primary area for improvement is total asset turnover (especially
inventories).
g. The biggest factor that can explain Jackson’s lower P/E ratio relative to
Also, Jackson could be perceived as having a lower growth potential
3-.