Appendix 14A
Breakeven Analysis
APPENDIX 14A
BREAKEVEN ANALYSIS
ANSWERS TO QUESTIONS:
1. A linear breakeven chart is constructed as follows:
a. The total revenue (TR) function is found by drawing a line through the origin with a
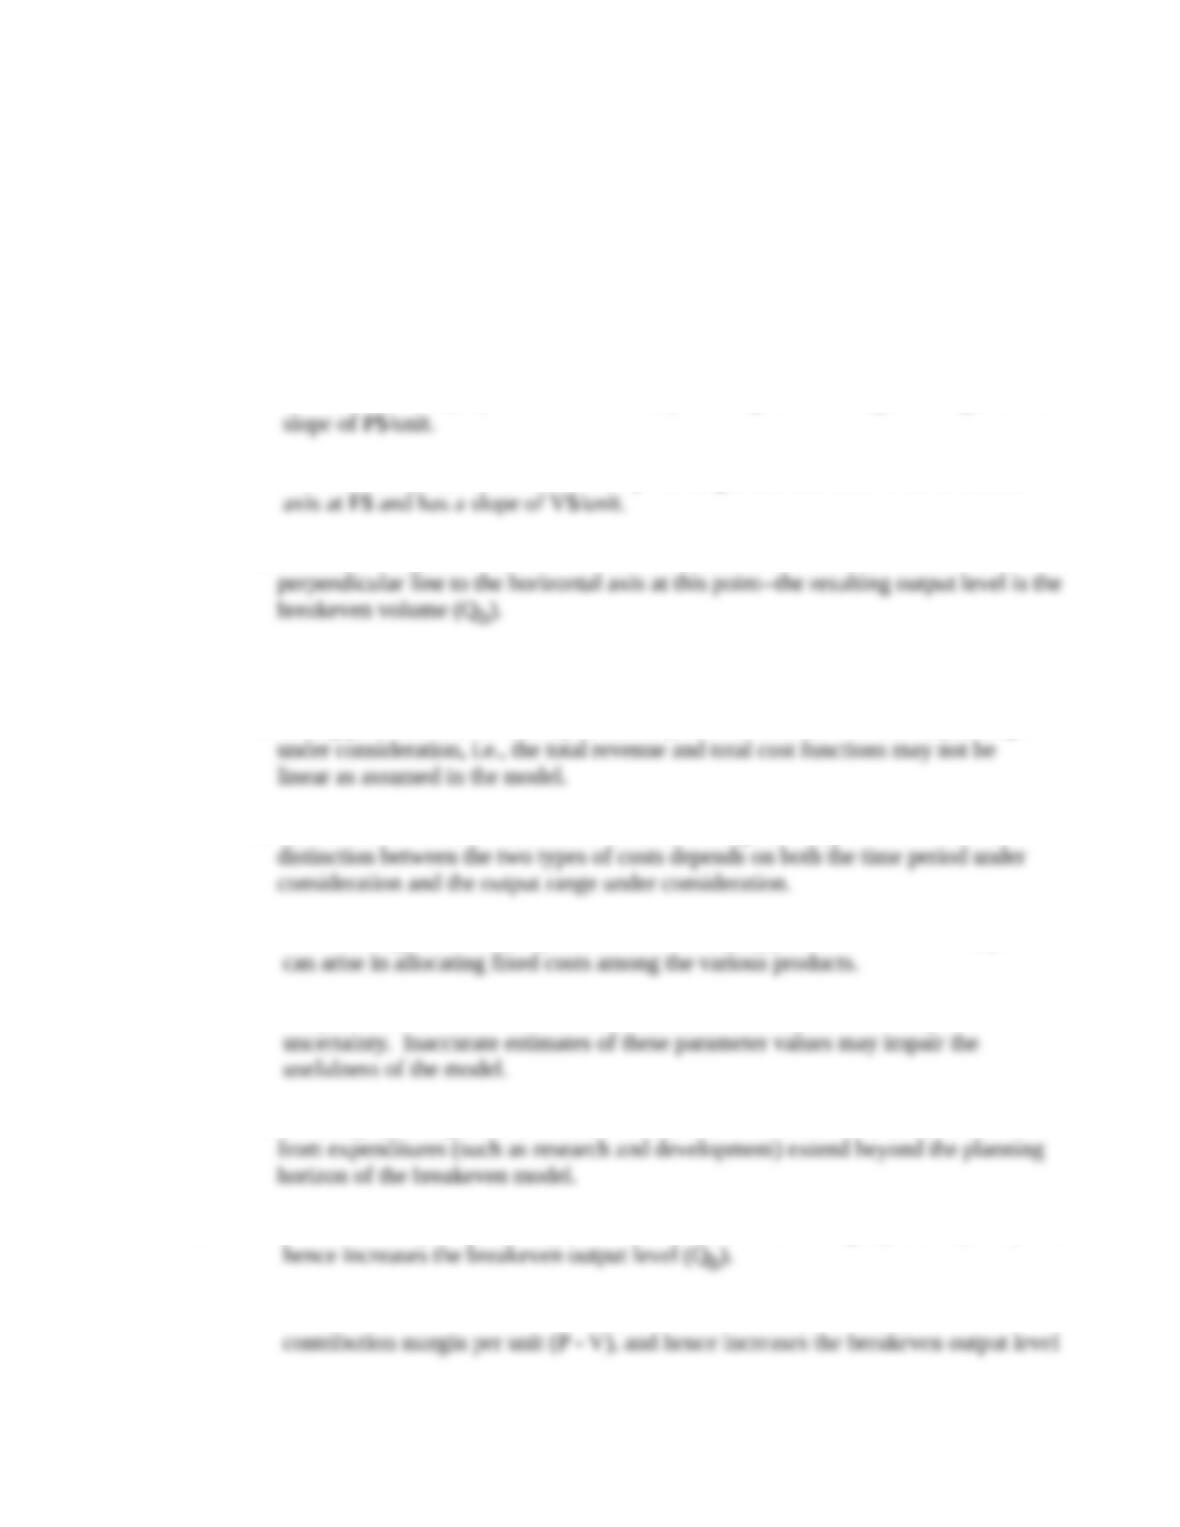
b. The total cost (TC) function is found by drawing a line that intersects the vertical
c. Determine the point where the TR and TC lines intersect and then construct a
2. Limitations of linear breakeven analysis:
a. Selling price and variable cost per unit may not be constant over the output range
b. Classification of costs into fixed and variable categories may be difficult since the
c. When dealing with multiple products and a changing product mix over time, problems
d. The parameters of the breakeven model (i.e., P, V, and F) are often subject to
e. Matching operating costs with revenues can be difficult when the benefits received
3. a. A reduction in price per unit (P) reduces the contribution margin per unit (P – V) and
b. An increase in direct labor costs increases variable cost per unit (V), reduces the
14A-5
Appendix 14A
Breakeven Analysis
(Qb).
SOLUTIONS TO PROBLEMS:
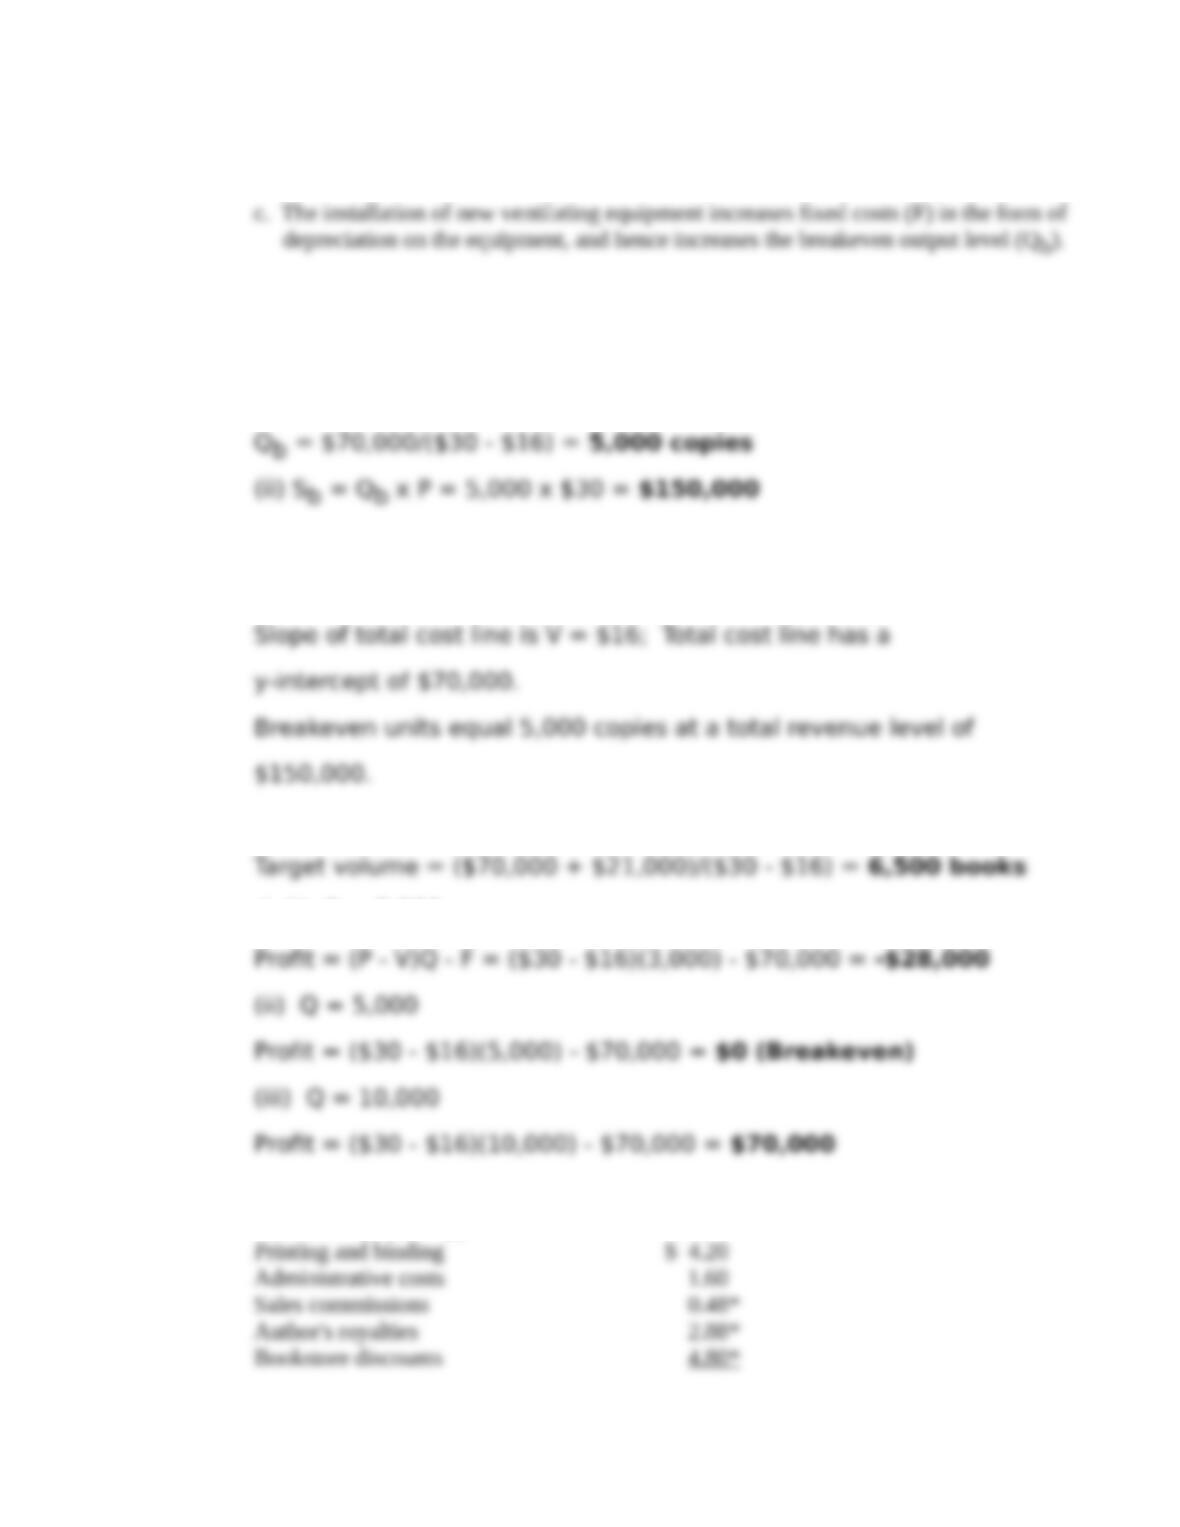
1. a. (i) F = $70,000; V = $16; P = $30
b. Slope of total revenue line is P = $30; Total revenue line originates
from the origin (0,0).
c. Target pro.t = $21,000
d. (i) Q = 3,000
e. Projected selling price $24.00
Variable costs per copy
14A-5
Appendix 14A
Breakeven Analysis
Total $13.96
*These variable costs are reduced because they are a function of
the selling price.
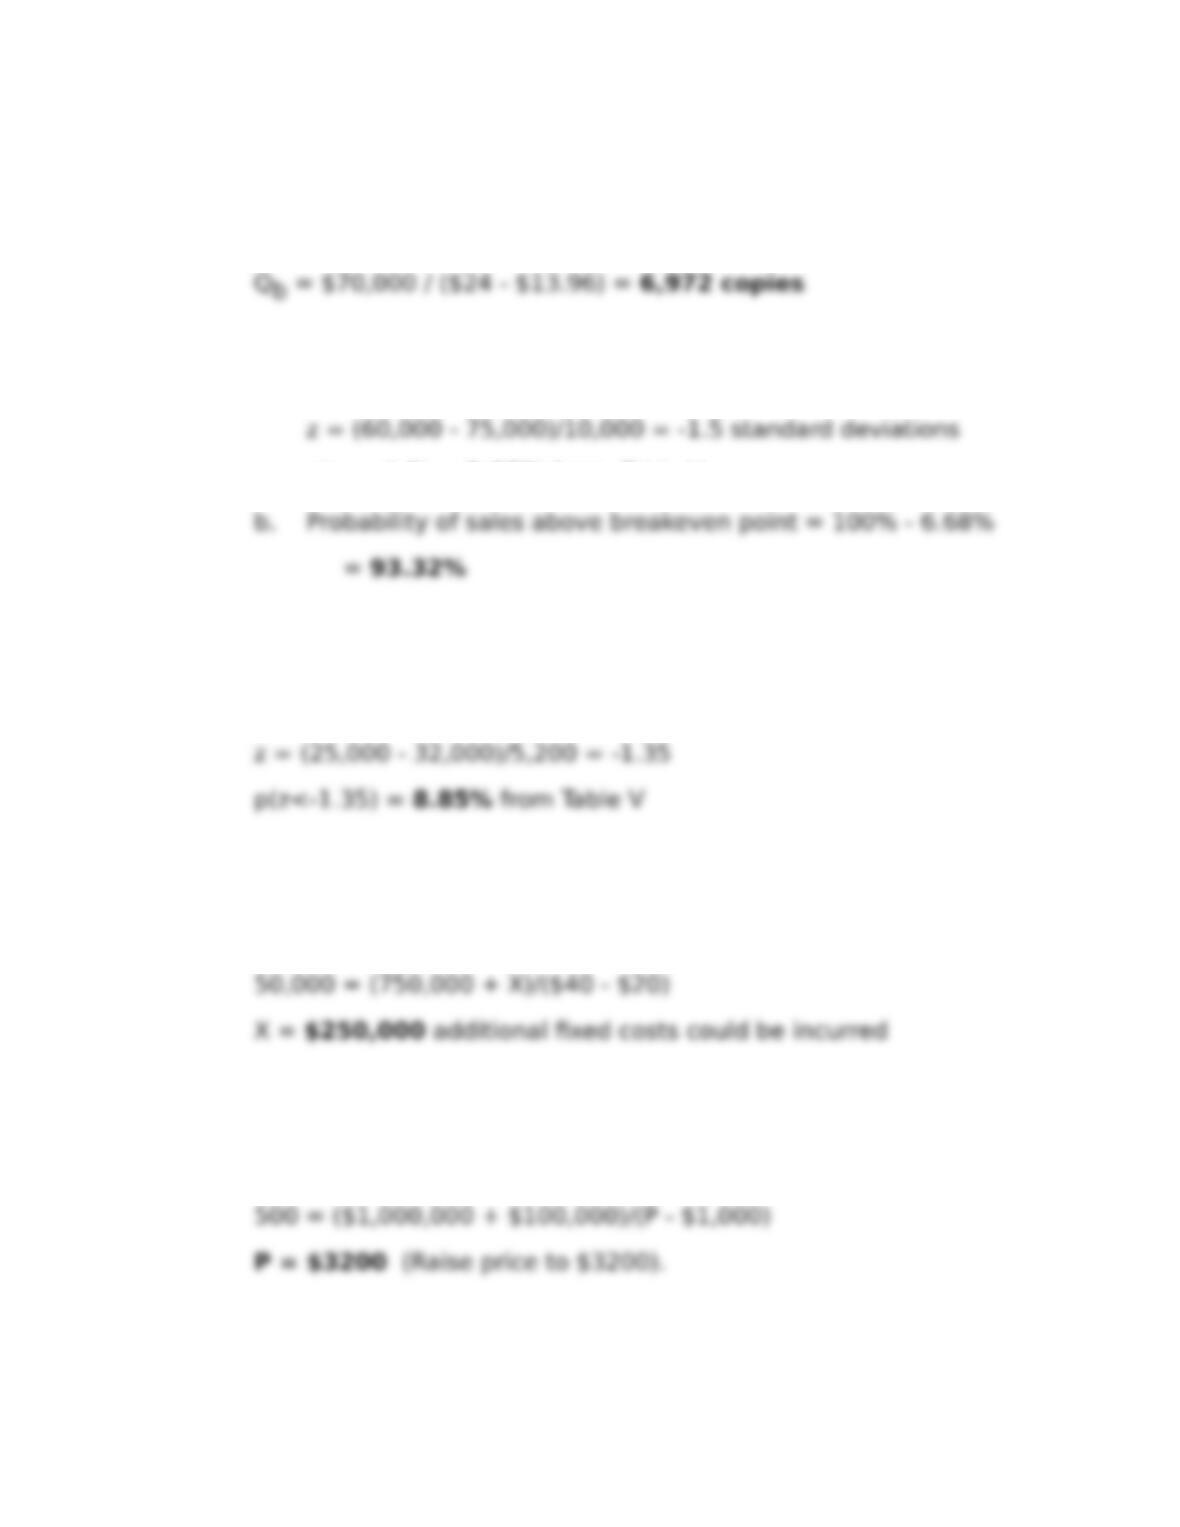
2. a. Probability of sales below 60,000 units:
p(z < -1.5) = 6.68% from Table V
3. Probability of operating losses is the probability of operating below the
breakeven point:
4. Current breakeven output level = $750,000/($40 – $25) = 50,000
units
5. Current breakeven output level = $1,000,000/($3,000 – $1,000)
= 500 desks
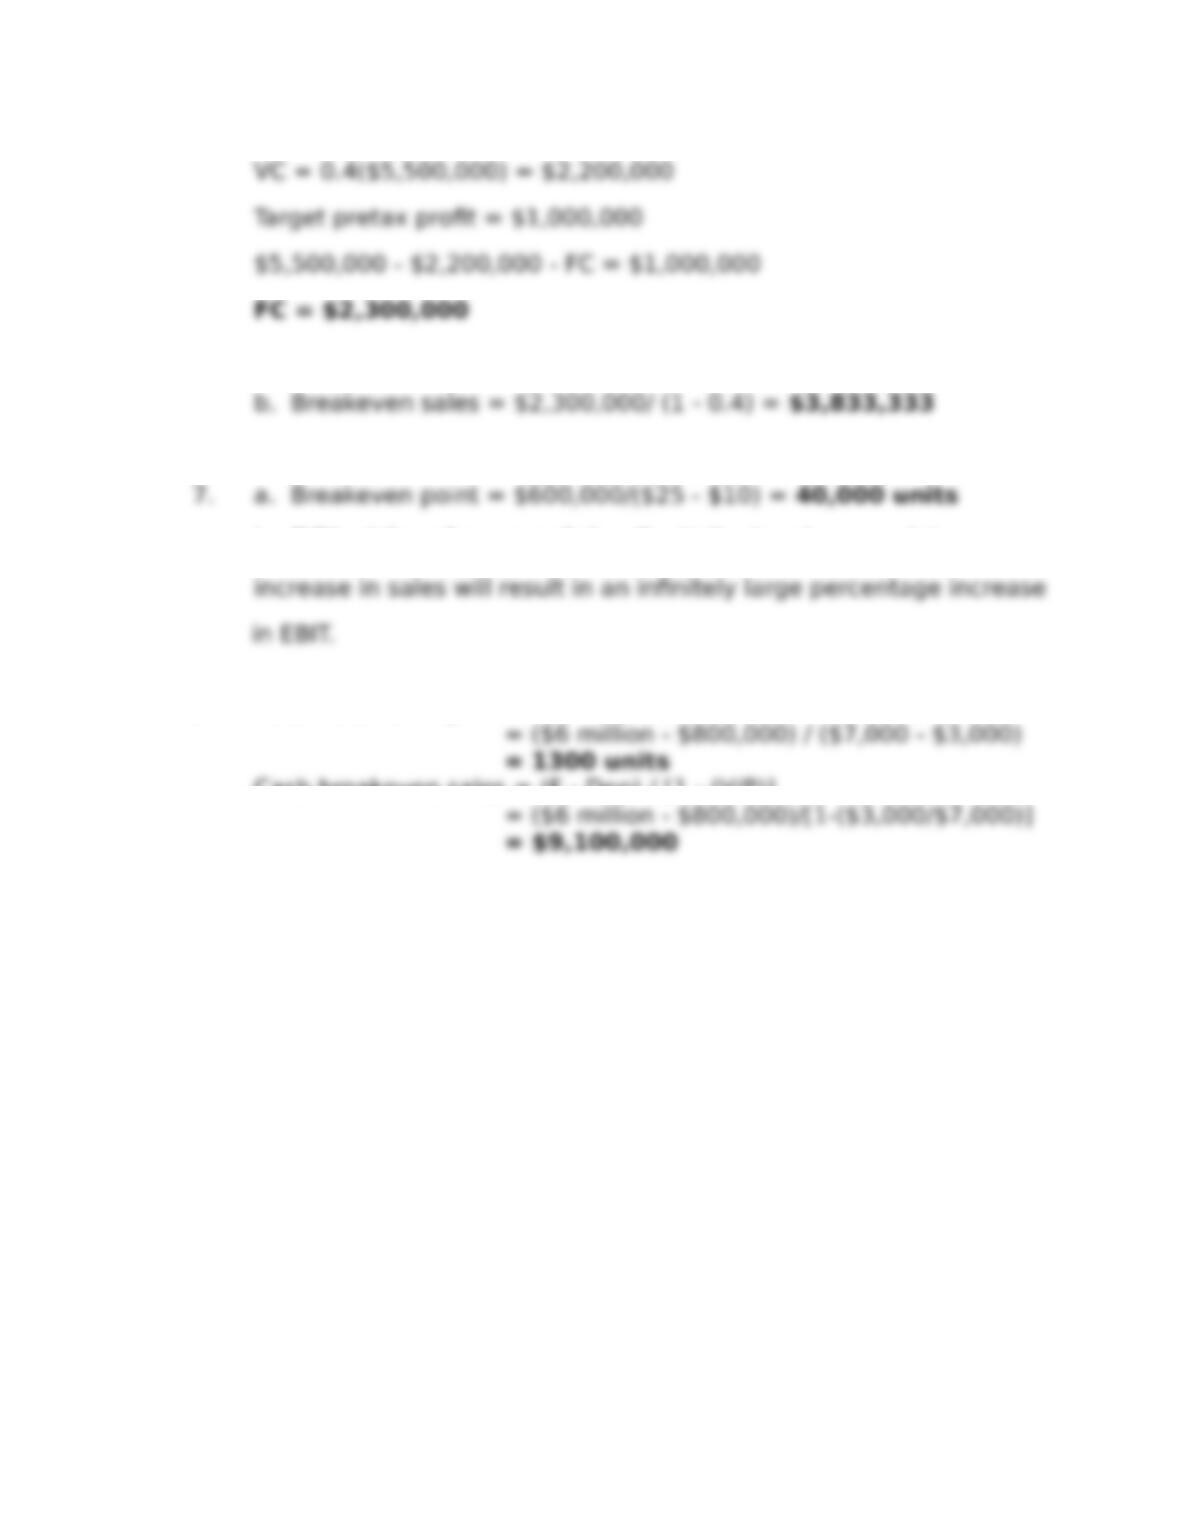
6. a. Sales = $5,500,000
14A-5
Appendix 14A
Breakeven Analysis
b. DOL at breakeven point = . At the breakeven point, any
8. Cash breakeven point = (F – Dep) / (P – V)
Cash breakeven sales = (F – Dep) / [1 – (V/P)]
14A-5