SOLUTIONS TO TEXT PROBLEMS:
Quick Quizzes
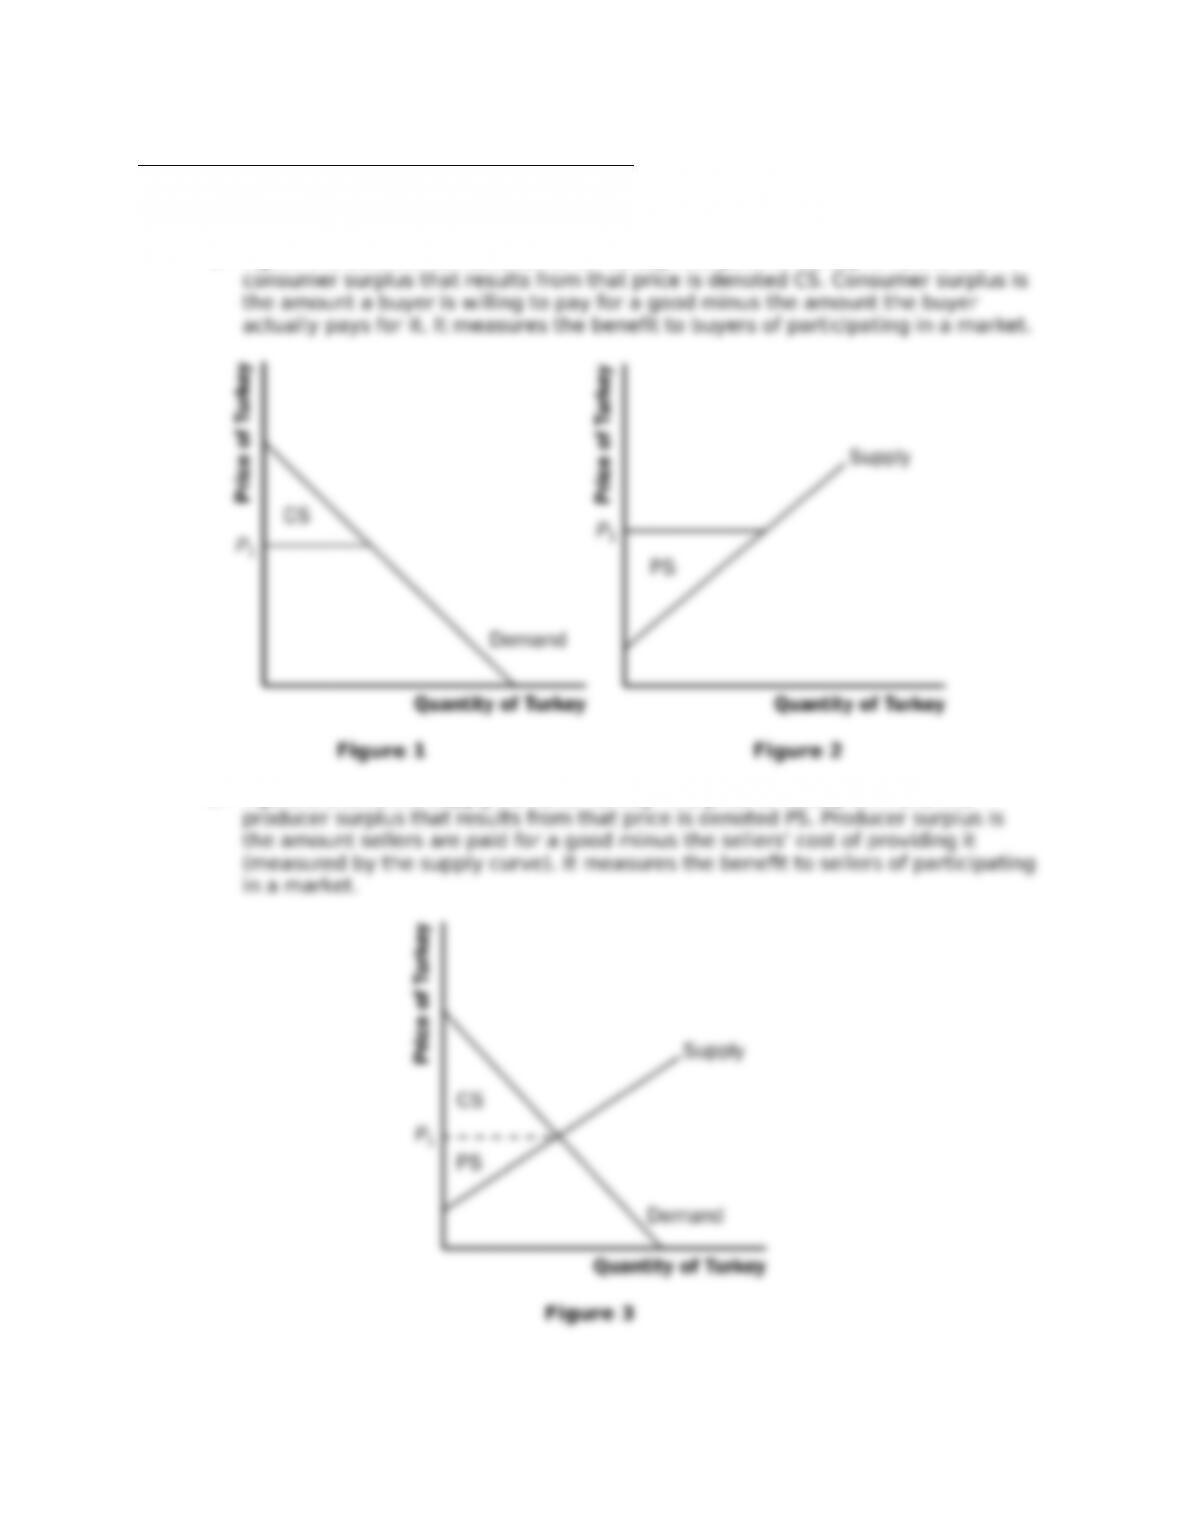
1. Figure 1 shows the demand curve for turkey. The price of turkey is P1 and the
2. Figure 2 shows the supply curve for turkey. The price of turkey is P1 and the
115
© 2018 Cengage Learning®. May not be scanned, copied or duplicated, or posted to a publicly accessible website,
in whole or in part, except for use as permitted in a license distributed with a certain product or service or otherwise
on a password-protected website or school-approved learning management system for classroom use.
Chapter 7/Consumers, Producers, and the E2ciency of Markets ❖ 116
3. Figure 3 shows the supply and demand for turkey. The price of turkey is P1,
Chapter Quick Quiz
1. a
Questions for Review
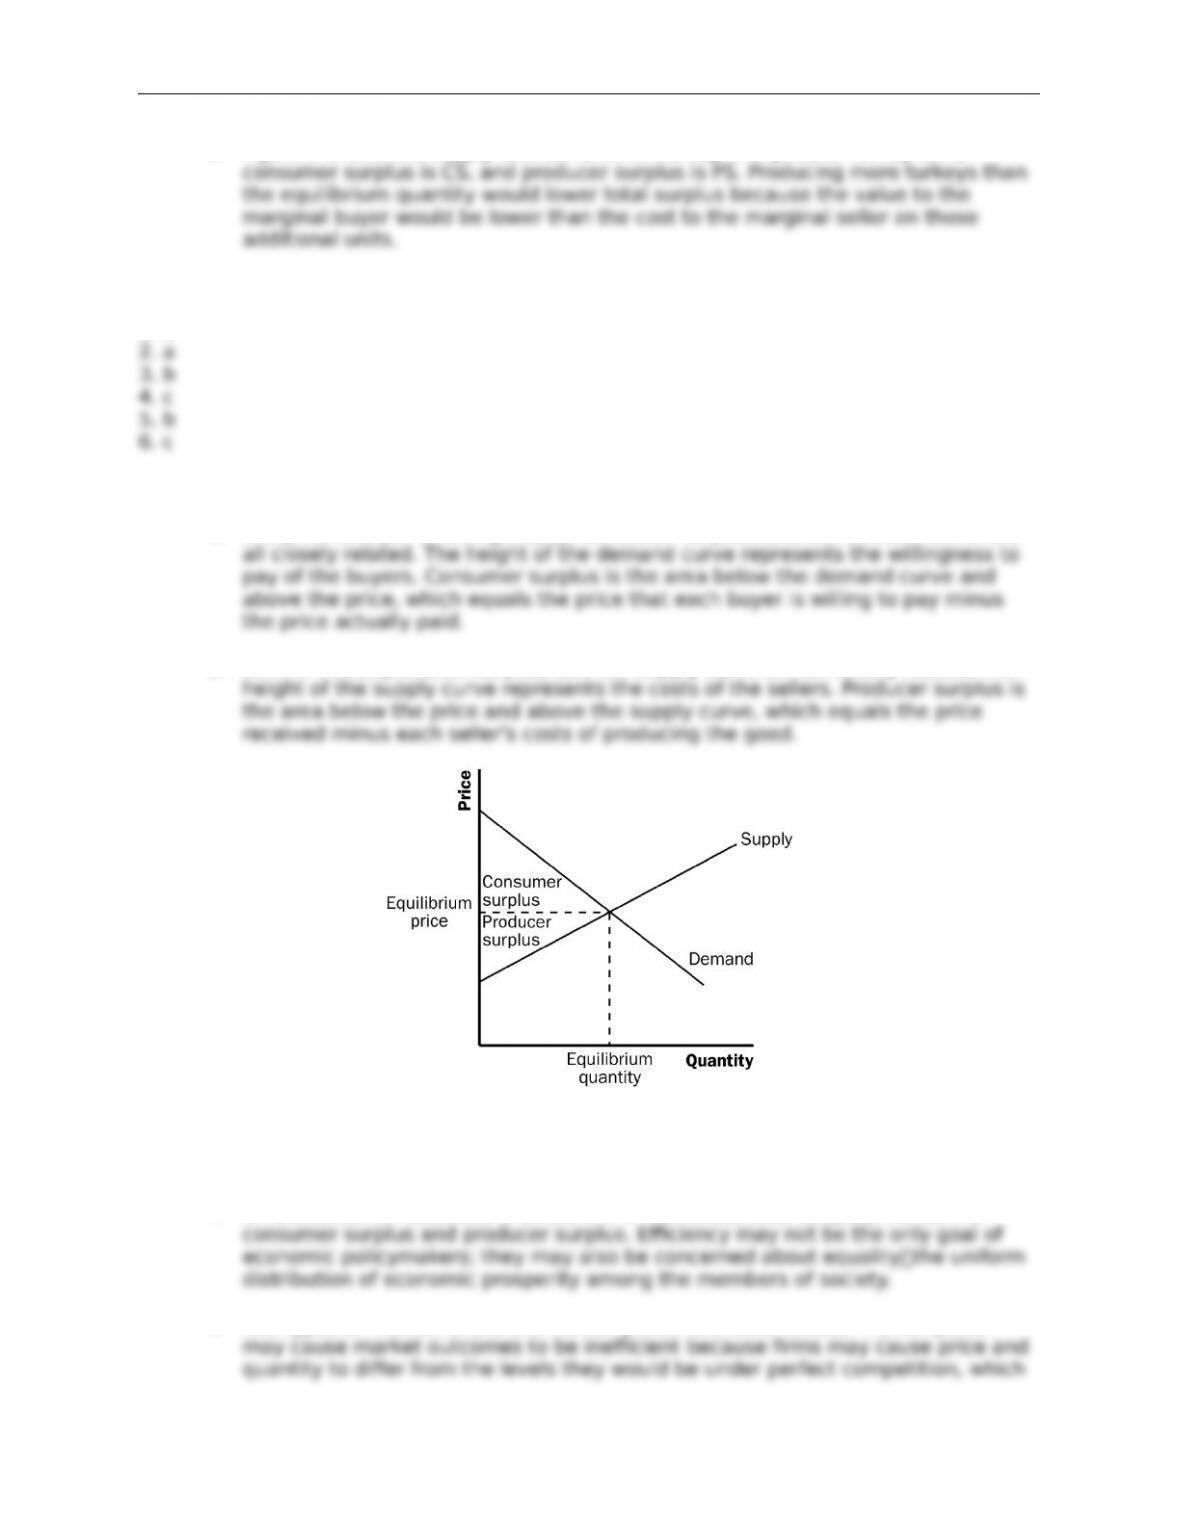
1. The price a buyer is willing to pay, consumer surplus, and the demand curve are
2. Sellers’ costs, producer surplus, and the supply curve are all closely related. The
Figure 4
3. Figure 4 shows producer and consumer surplus in a supply-and-demand diagram.
4. An allocation of resources is e2cient if it maximizes total surplus, the sum of
5. Two types of market failure are market power and externalities. Market power
© 2018 Cengage Learning®. May not be scanned, copied or duplicated, or posted to a publicly accessible website,
in whole or in part, except for use as permitted in a license distributed with a certain product or service or otherwise
on a password-protected website or school-approved learning management system for classroom use.
Chapter 7/Consumers, Producers, and the E2ciency of Markets ❖ 117
Problems and Applications
1.
a. Willingness to pay is the sum of the price paid and consumer surplus.
b. Her consumer surplus at a price of $180 would be $400 − $180 = $220.
c. If the price of an iPhone was $500, Melissa would not have purchased one
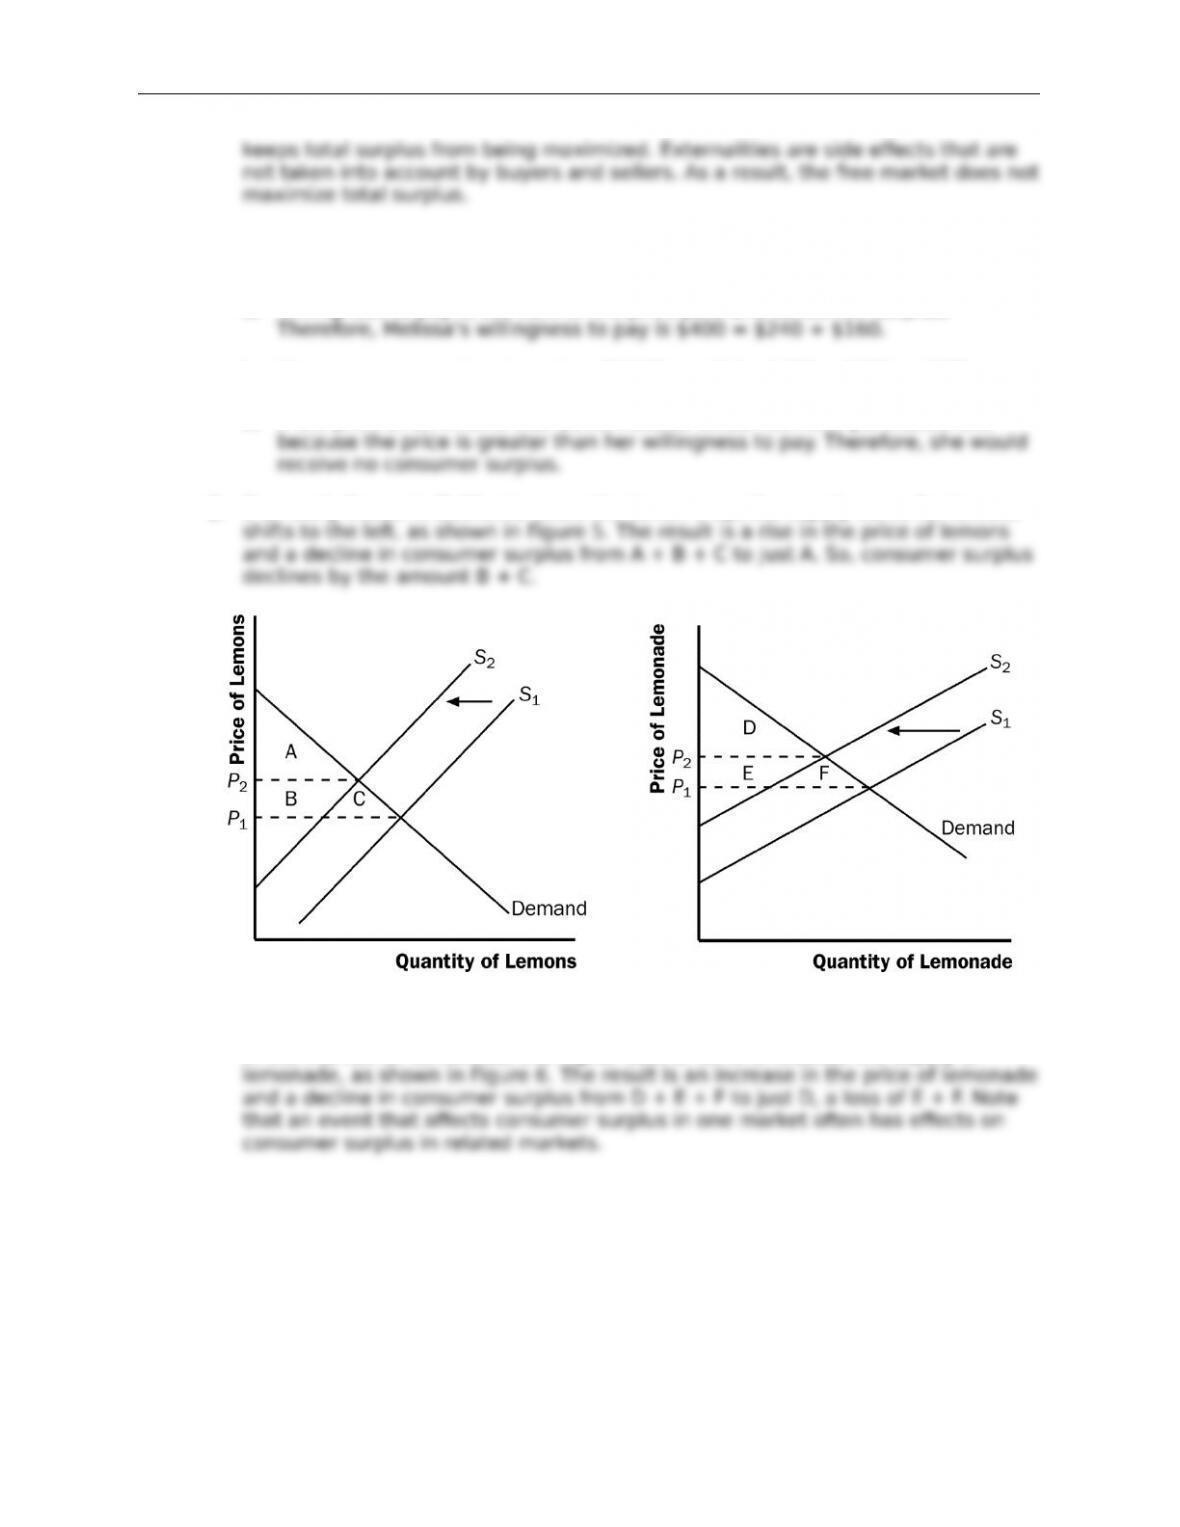
2. If an early freeze in California sours the lemon crop, the supply curve for lemons
Figure 5 Figure 6
In the market for lemonade, the higher cost of lemons reduces the supply of
© 2018 Cengage Learning®. May not be scanned, copied or duplicated, or posted to a publicly accessible website,
in whole or in part, except for use as permitted in a license distributed with a certain product or service or otherwise
on a password-protected website or school-approved learning management system for classroom use.
Chapter 7/Consumers, Producers, and the E2ciency of Markets ❖ 118
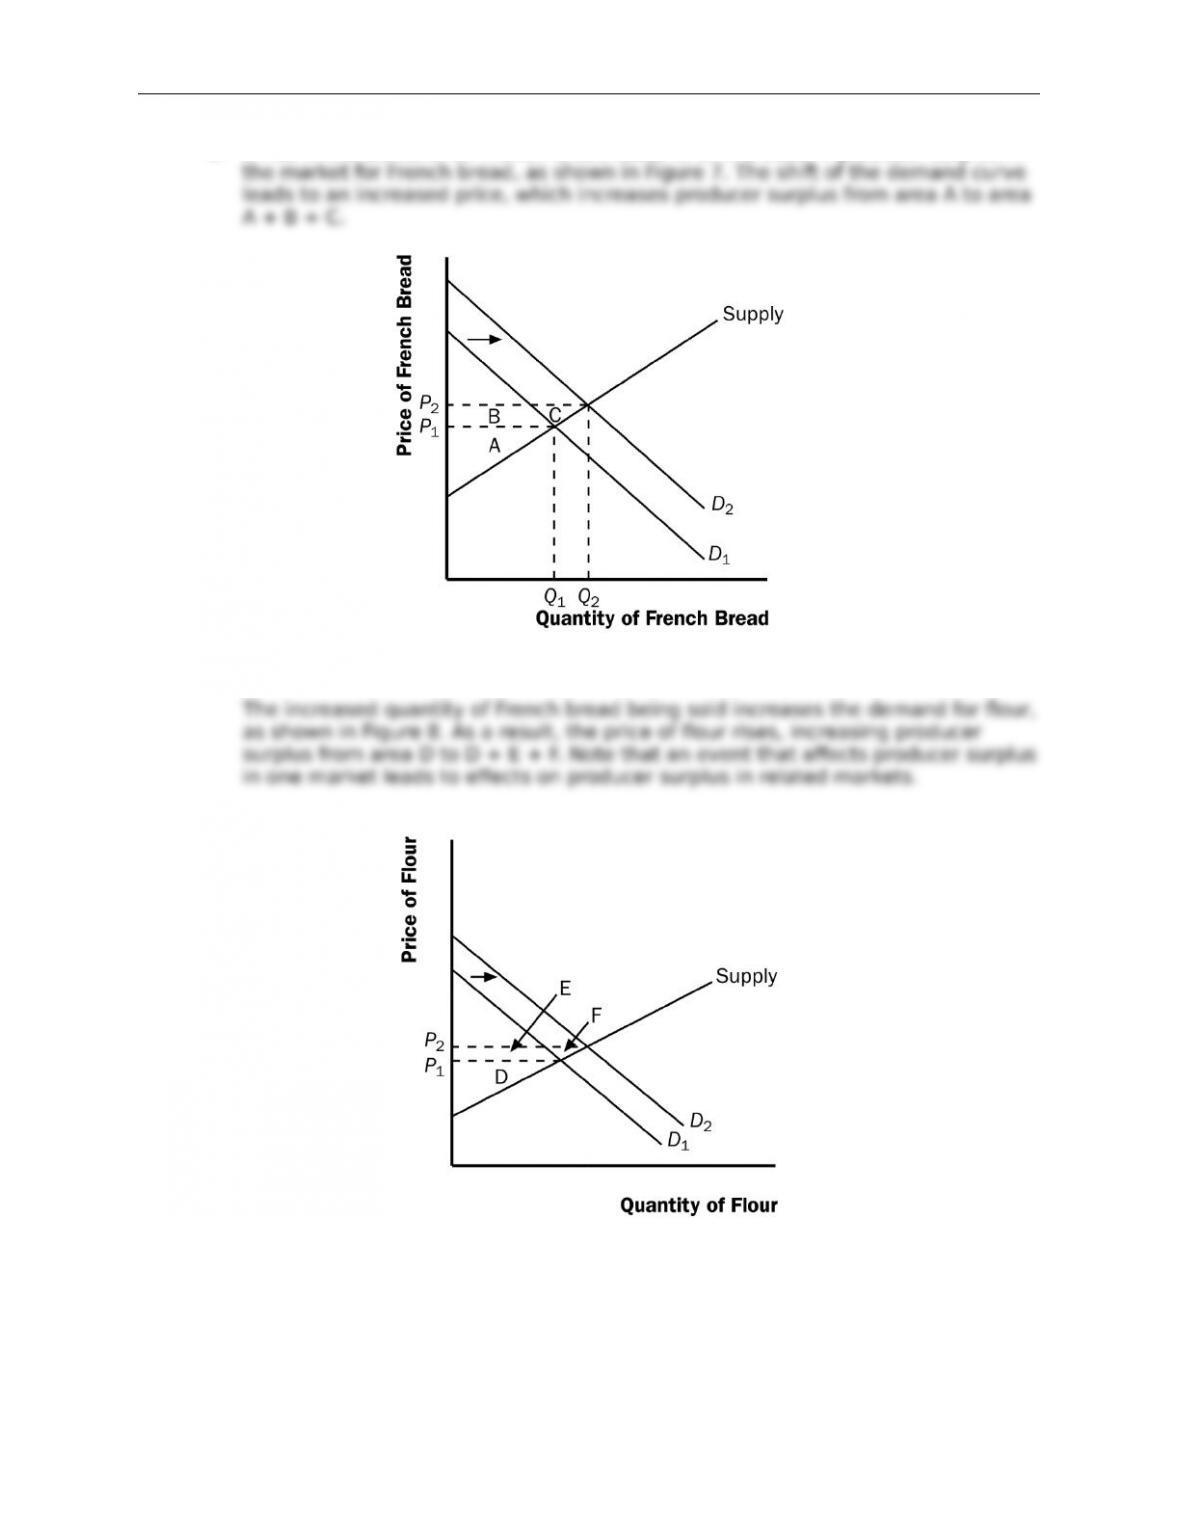
3. A rise in the demand for French bread leads to an increase in producer surplus in
Figure 7
Figure 8
© 2018 Cengage Learning®. May not be scanned, copied or duplicated, or posted to a publicly accessible website,
in whole or in part, except for use as permitted in a license distributed with a certain product or service or otherwise
on a password-protected website or school-approved learning management system for classroom use.
Chapter 7/Consumers, Producers, and the E2ciency of Markets ❖ 119
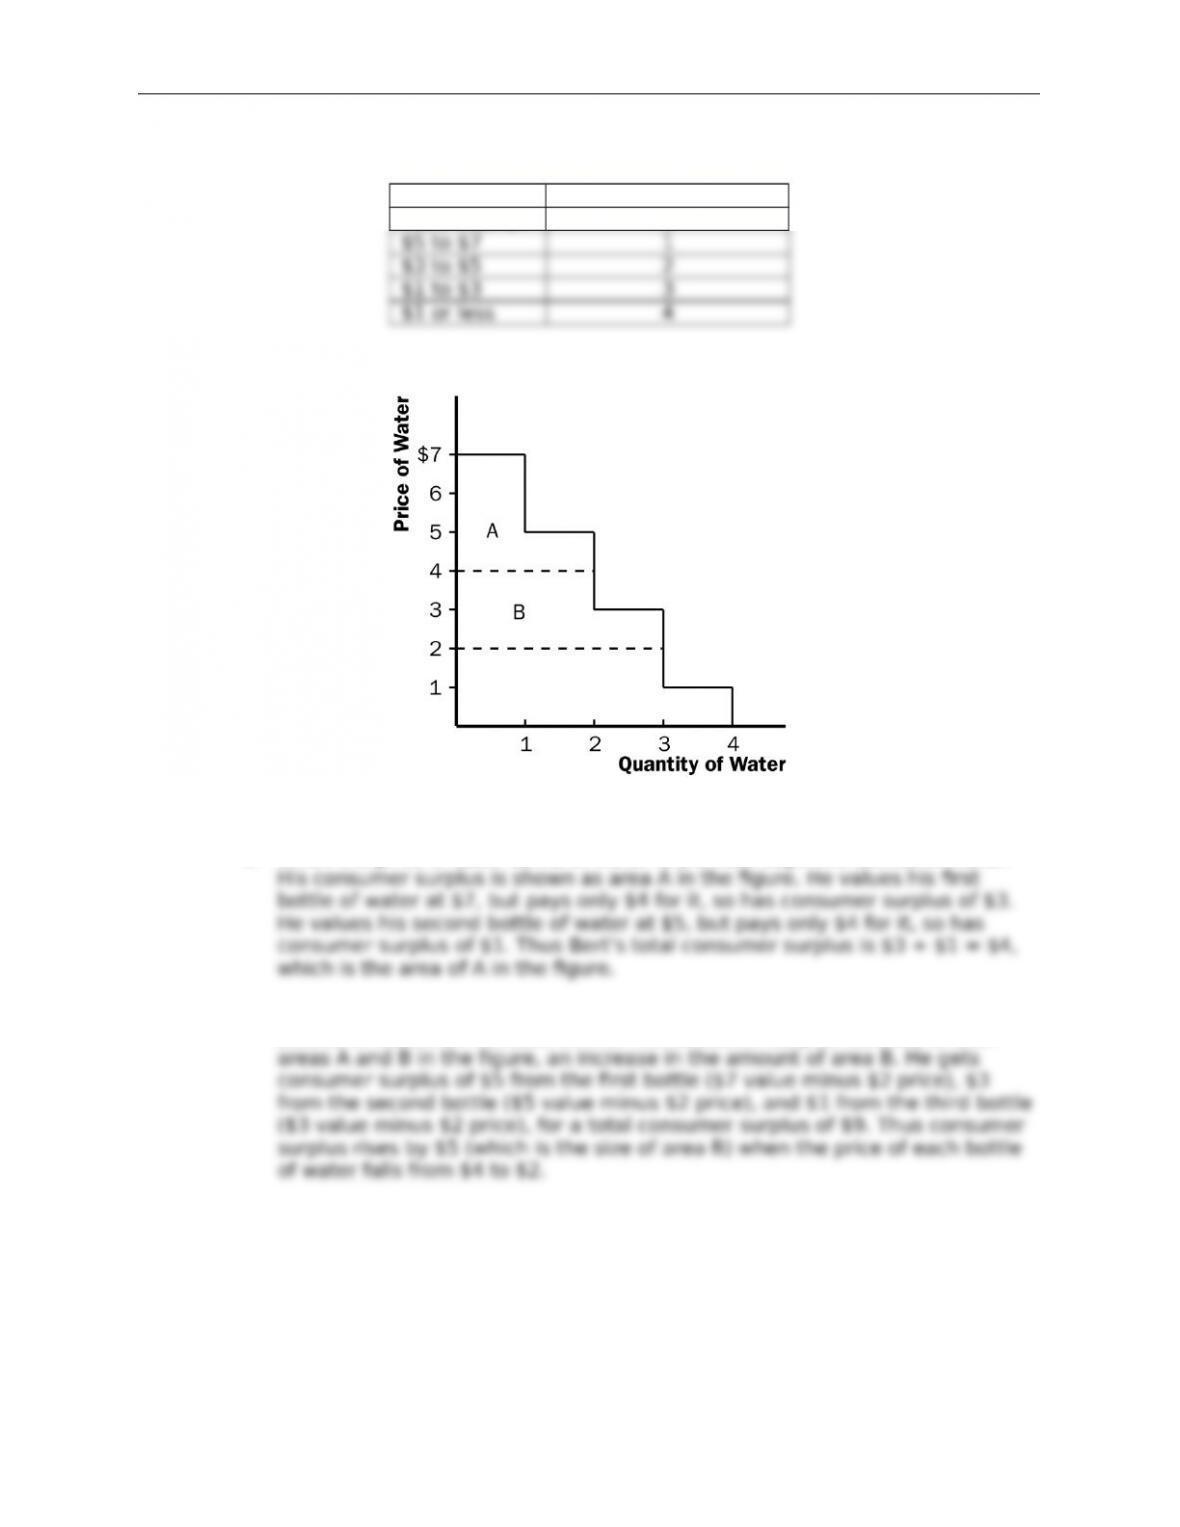
4. a. Bert’s demand schedule is:
Price Quantity Demanded
More than $7 0
Bert’s demand curve is shown in Figure 9.
Figure 9
b. When the price of each bottle of water is $4, Bert buys two bottles of water.
c. When the price of each bottle of water falls from $4 to $2, Bert buys three
bottles of water, an increase of one. His consumer surplus consists of both
© 2018 Cengage Learning®. May not be scanned, copied or duplicated, or posted to a publicly accessible website,
in whole or in part, except for use as permitted in a license distributed with a certain product or service or otherwise
on a password-protected website or school-approved learning management system for classroom use.
Chapter 7/Consumers, Producers, and the E2ciency of Markets ❖ 120
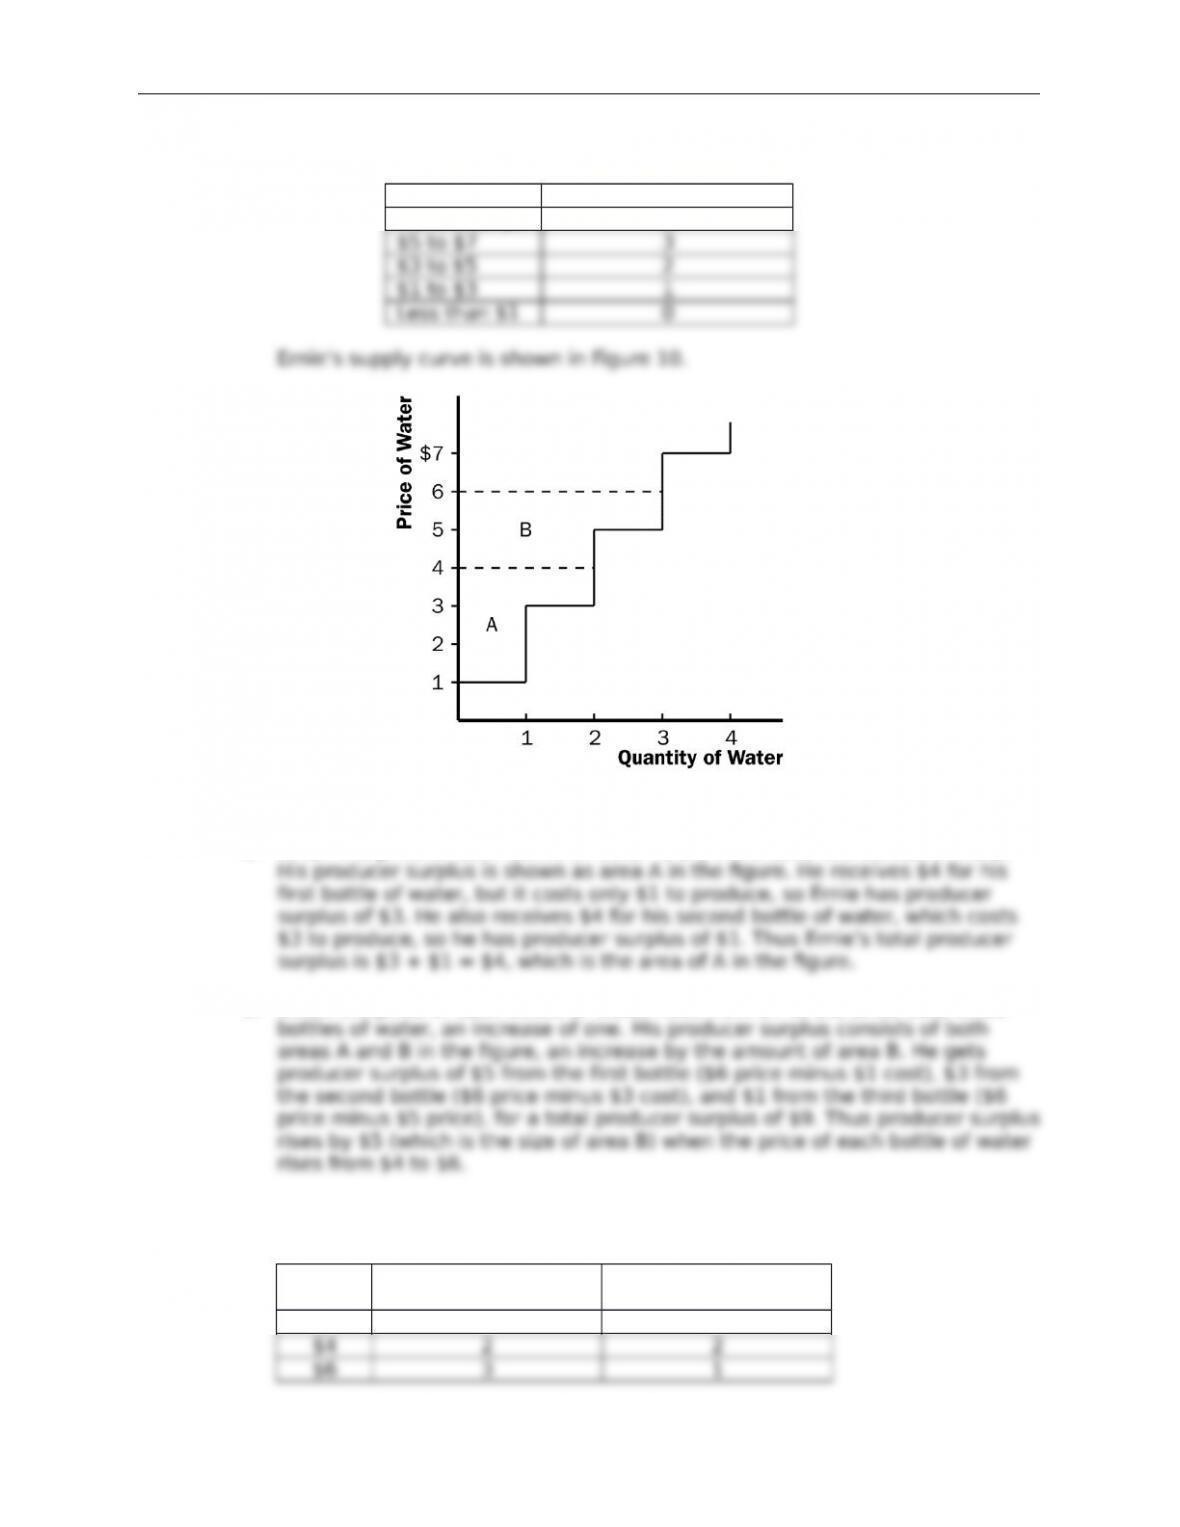
5. a. Ernie’s supply schedule for water is:
Price Quantity Supplied
More than $7 4
Figure 10
b. When the price of each bottle of water is $4, Ernie sells two bottles of water.
c. When the price of each bottle of water rises from $4 to $6, Ernie sells three
6. a. From Ernie’s supply schedule and Bert’s demand schedule, the quantity
demanded and supplied are:
Price Quantity Supplied Quantity
Demanded
$2 1 3
© 2018 Cengage Learning®. May not be scanned, copied or duplicated, or posted to a publicly accessible website,
in whole or in part, except for use as permitted in a license distributed with a certain product or service or otherwise
on a password-protected website or school-approved learning management system for classroom use.
Chapter 7/Consumers, Producers, and the E2ciency of Markets ❖ 121
b. At a price of $4, consumer surplus is $4 and producer surplus is $4, as shown
c. If Ernie produced one less bottle, his producer surplus would decline to $3, as
d. If Ernie produced one additional bottle of water, his cost would be $5, but the
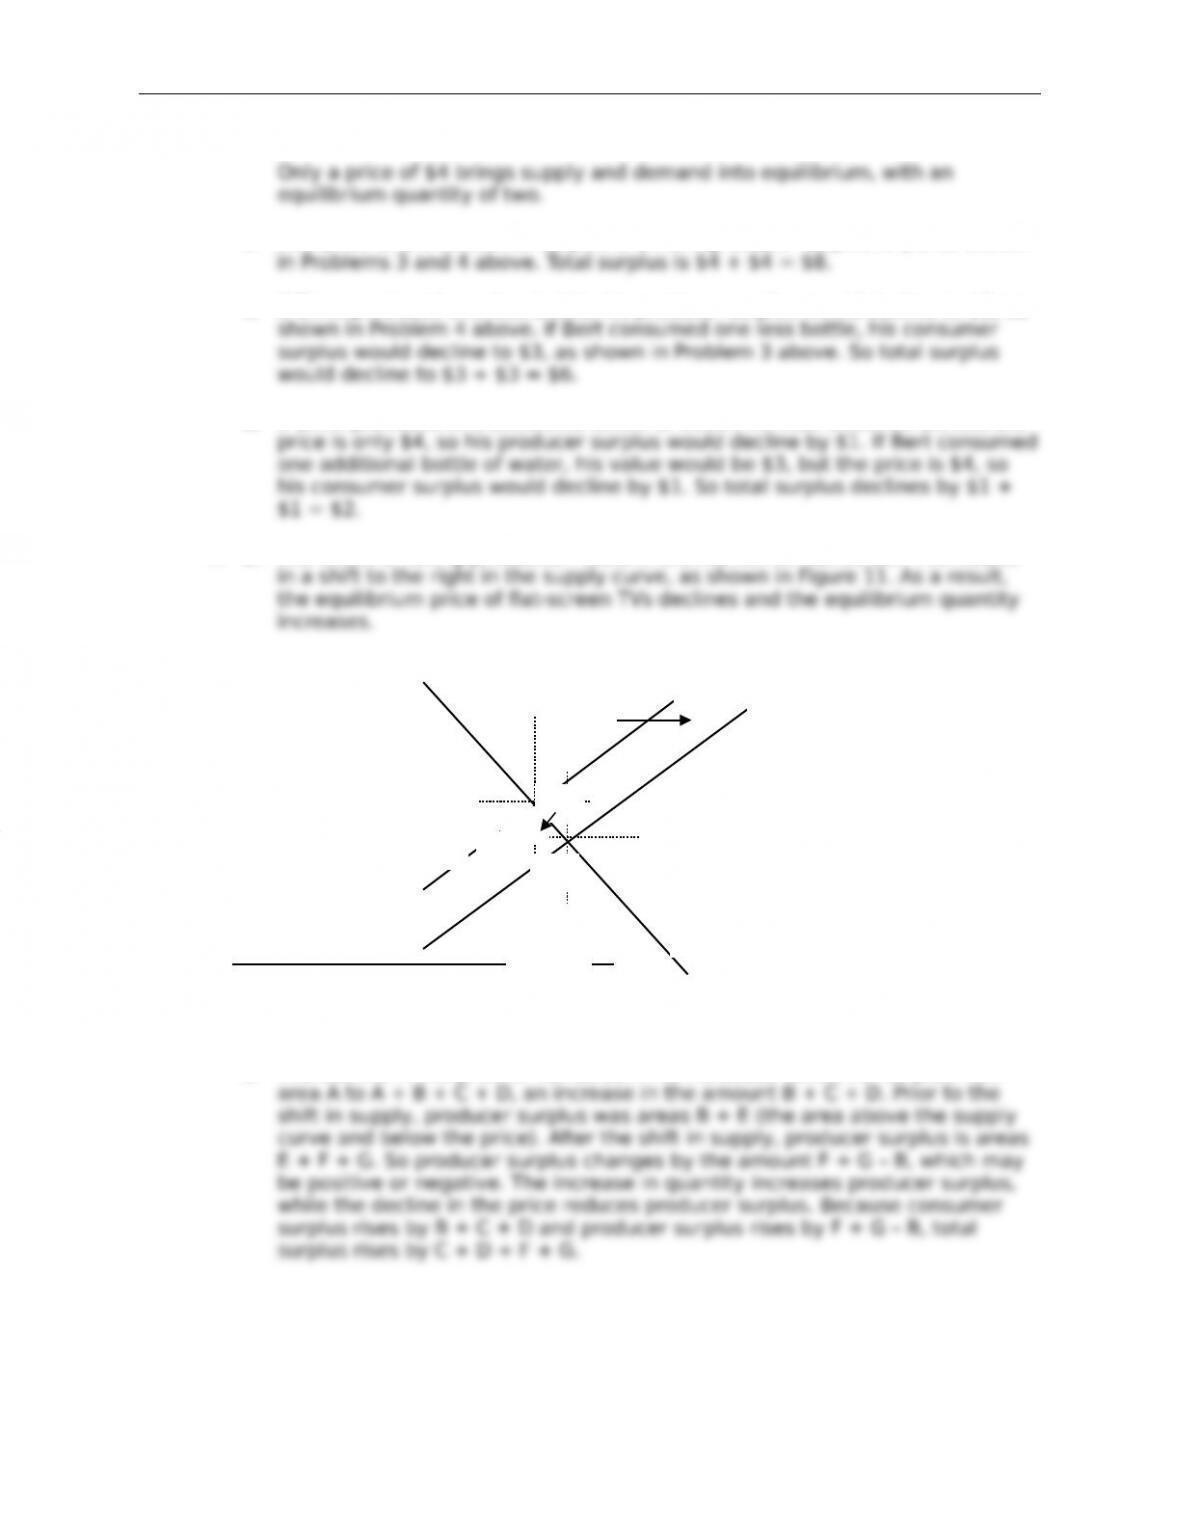
7. a. The e>ect of falling production costs in the market for Iat-screen TVs results
Figure 11
b. The decline in the price of Iat-screen TVs increases consumer surplus from
© 2018 Cengage Learning®. May not be scanned, copied or duplicated, or posted to a publicly accessible website,
in whole or in part, except for use as permitted in a license distributed with a certain product or service or otherwise
on a password-protected website or school-approved learning management system for classroom use.
Price of
6at-screen TVs
Quantity of 6at-screen
TVs
Deman
S2
S1
P1
P2
Q
1
Q
2
E
A
B
F
C
G
D
Chapter 7/Consumers, Producers, and the E2ciency of Markets ❖ 122
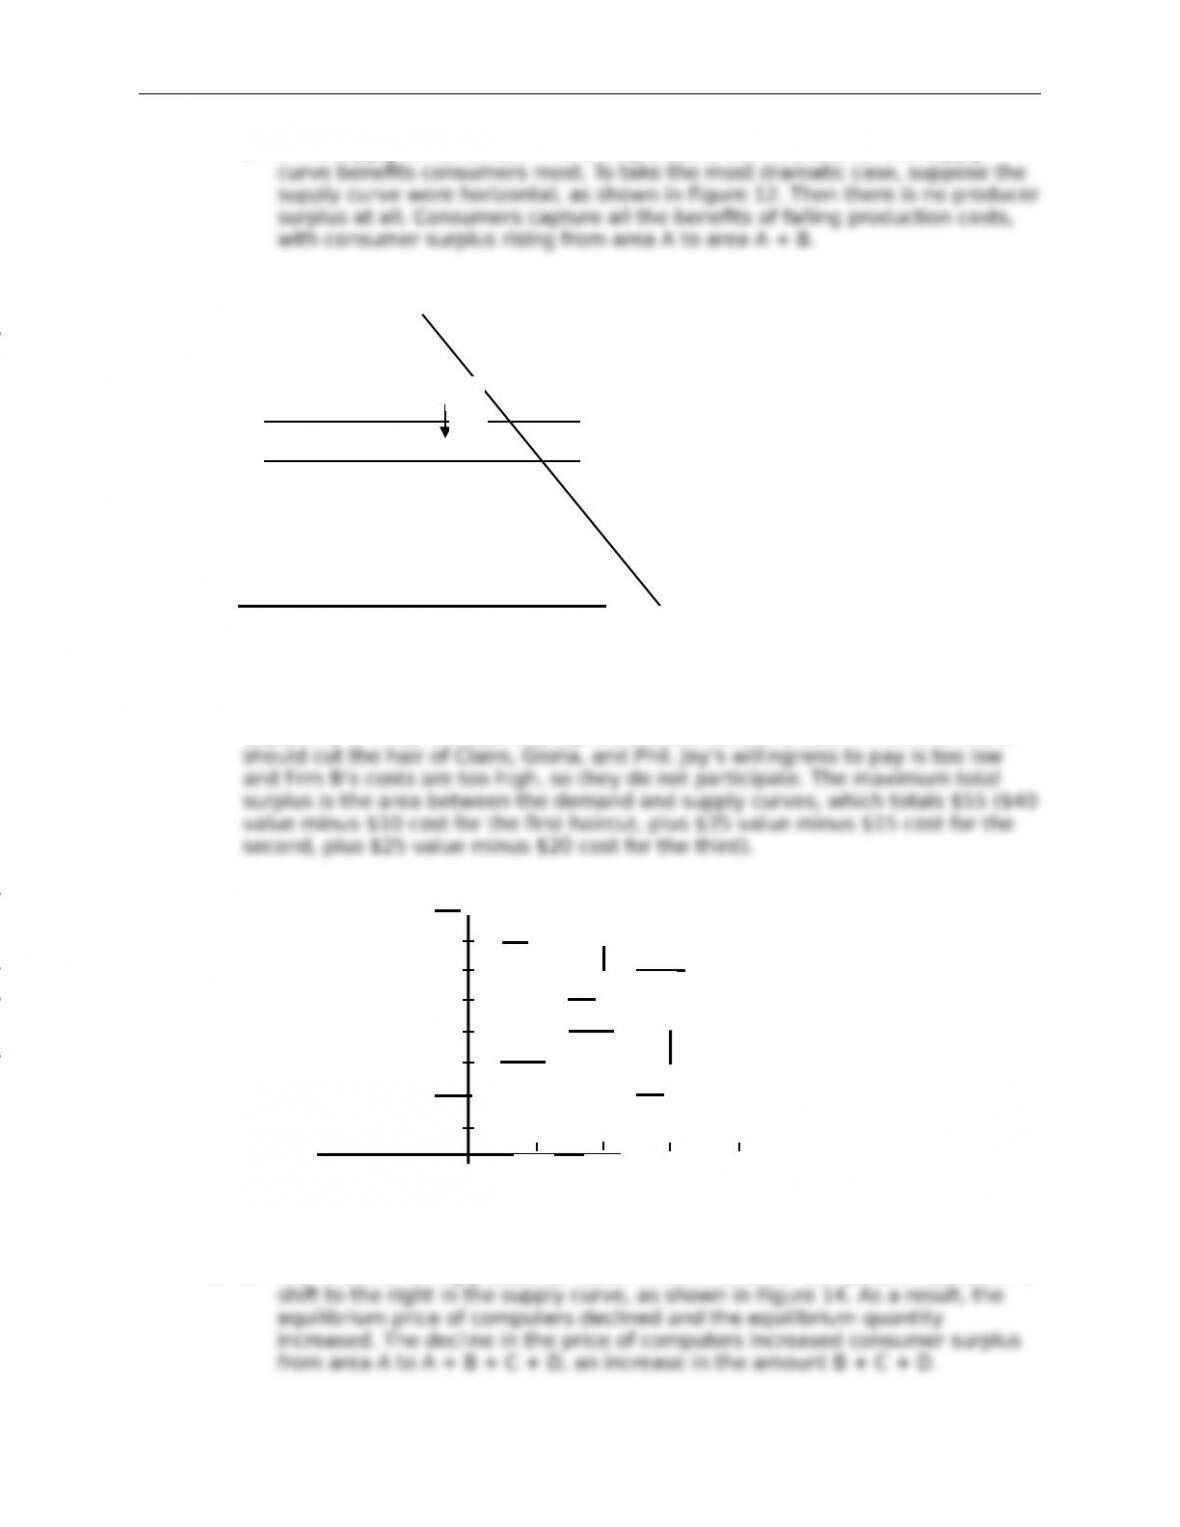
c. If the supply of Iat-screen TVs is very elastic, then the shift of the supply
Figure 12
8. Figure 13 shows supply and demand curves for haircuts. Supply equals demand at
a quantity of three haircuts and a price between $20 and $25. Firms A, C, and D
Figure 13
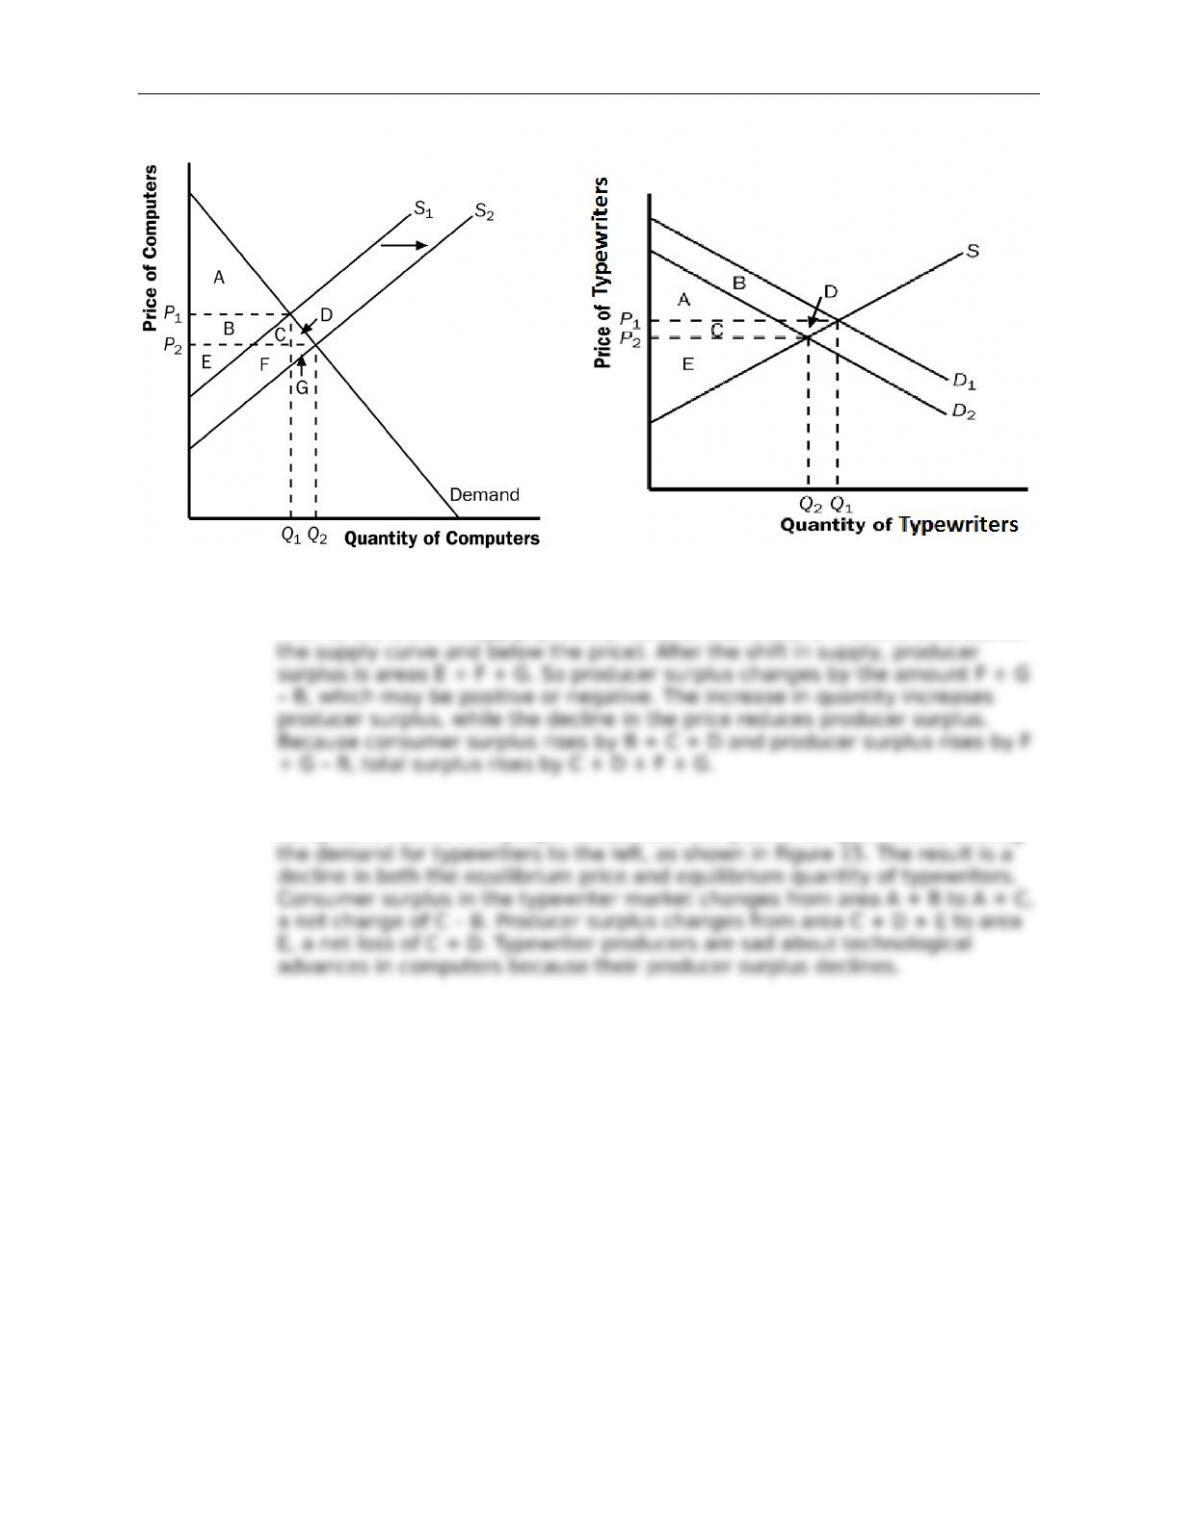
9. a. The e>ect of falling production costs in the market for computers resulted in a
© 2018 Cengage Learning®. May not be scanned, copied or duplicated, or posted to a publicly accessible website,
in whole or in part, except for use as permitted in a license distributed with a certain product or service or otherwise
on a password-protected website or school-approved learning management system for classroom use.
1 2 3 4
5
1
0
1
5
2
0
2
5
3
0
35
40
Quantity of Haircuts
Price of Haircuts
Claire
Gloria
Phil
Jay
D
A
C
B
A
B
S1
S2
Deman
Quantity of 6at-screen
Price of 6at-screen
Chapter 7/Consumers, Producers, and the E2ciency of Markets ❖ 123
Figure 14 Figure 15
Prior to the shift in supply, producer surplus was areas B + E (the area above
b. Typewriters and computers are substitutes. The decline in the price of
computers means that people substituted computers for typewriters, shifting
© 2018 Cengage Learning®. May not be scanned, copied or duplicated, or posted to a publicly accessible website,
in whole or in part, except for use as permitted in a license distributed with a certain product or service or otherwise
on a password-protected website or school-approved learning management system for classroom use.
Chapter 7/Consumers, Producers, and the E2ciency of Markets ❖ 124
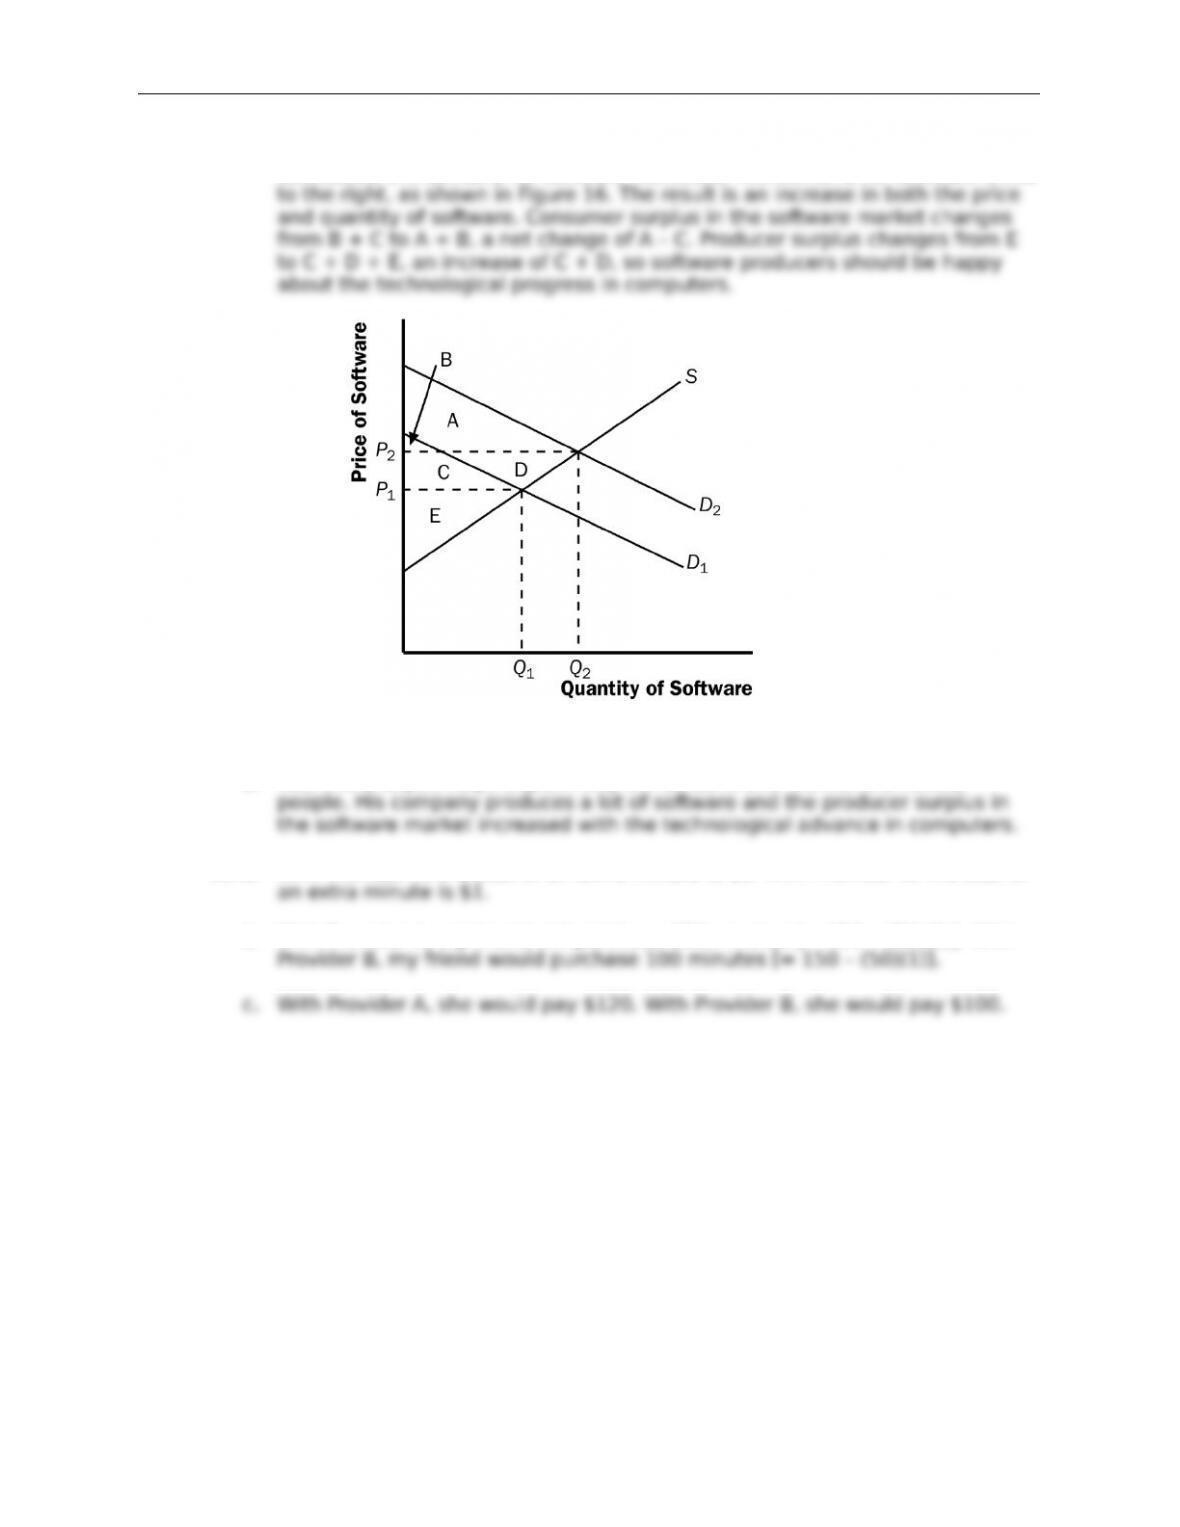
c. Software and computers are complements. When the price of computers
decreases, the demand for software increases. The demand for software shifts
Figure 16
d. Yes, this analysis helps explain why Bill Gates is one the world’s richest
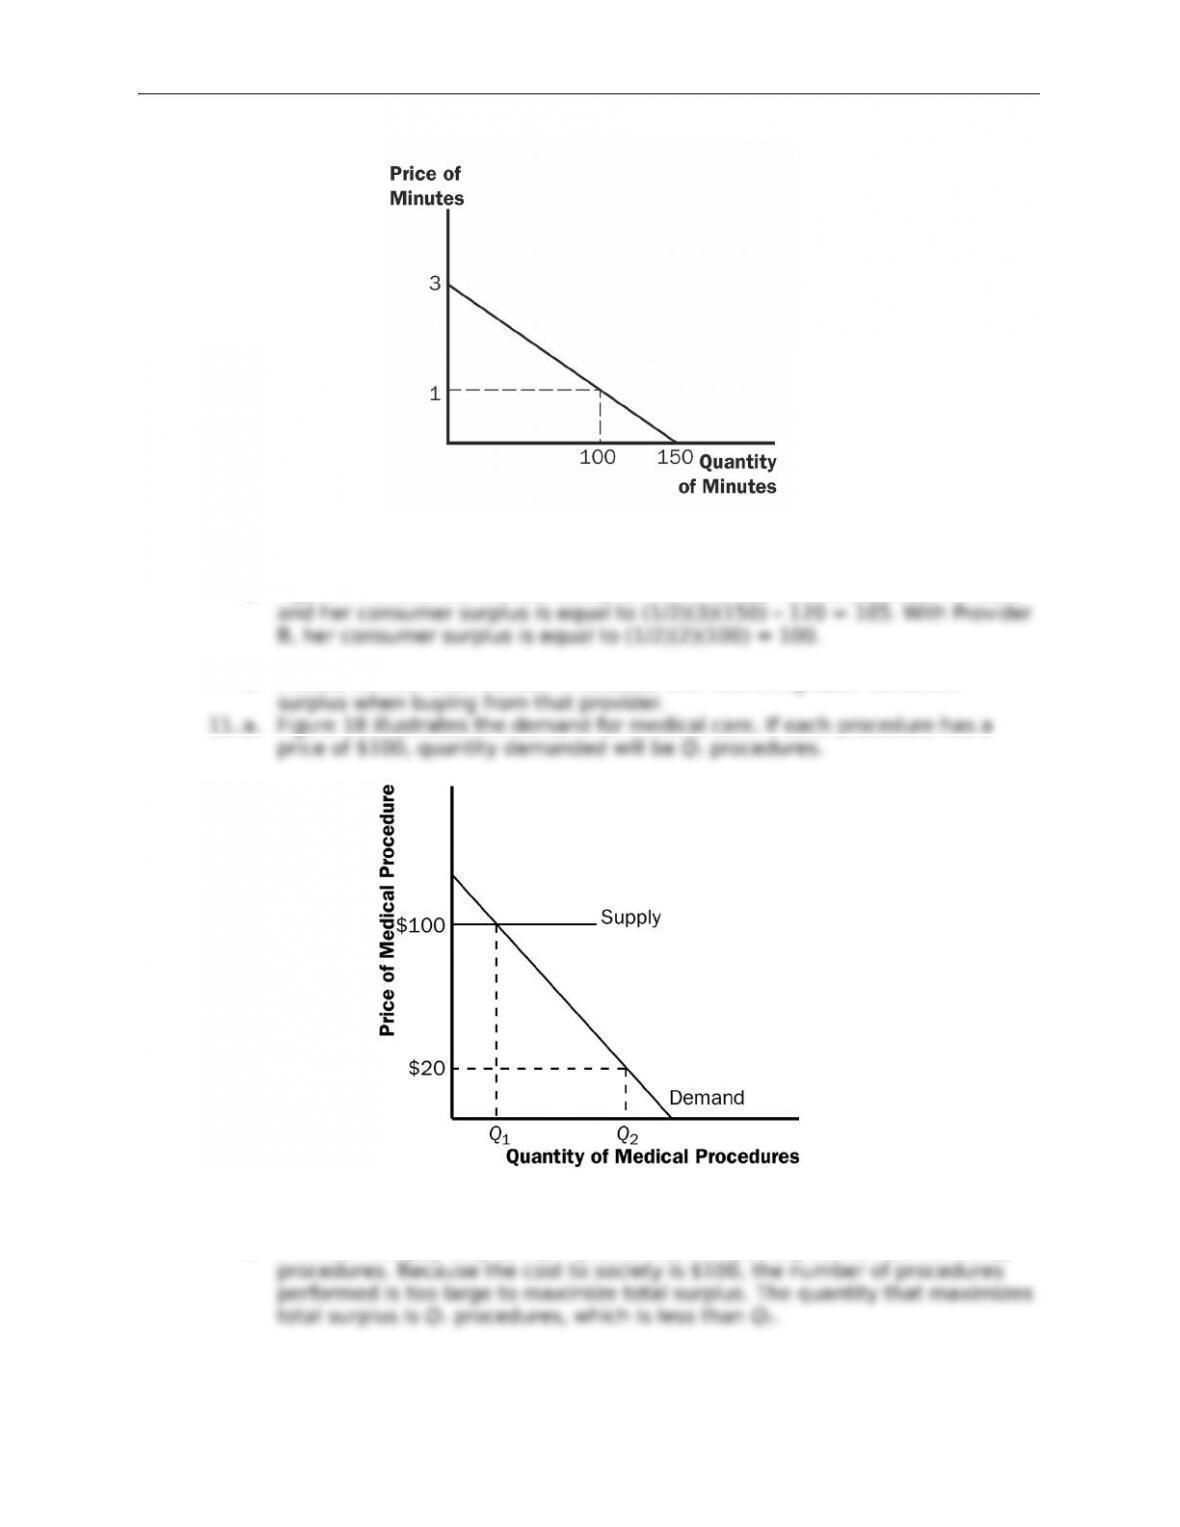
10. a. With Provider A, the cost of an extra minute is $0. With Provider B, the cost of
b. With Provider A, my friend will purchase 150 minutes [= 150 – (50)(0)]. With
© 2018 Cengage Learning®. May not be scanned, copied or duplicated, or posted to a publicly accessible website,
in whole or in part, except for use as permitted in a license distributed with a certain product or service or otherwise
on a password-protected website or school-approved learning management system for classroom use.
Chapter 7/Consumers, Producers, and the E2ciency of Markets ❖ 125
Figure 17
d. Figure 17 shows the friend’s demand. With Provider A, she buys 150 minutes
e. I would recommend Provider A because she receives greater consumer
11. a. Figure 18 illustrates the demand for medical care. If each procedure has a
Figure 18
b. If consumers pay only $20 per procedure, the quantity demanded will be Q2
© 2018 Cengage Learning®. May not be scanned, copied or duplicated, or posted to a publicly accessible website,
in whole or in part, except for use as permitted in a license distributed with a certain product or service or otherwise
on a password-protected website or school-approved learning management system for classroom use.
Chapter 7/Consumers, Producers, and the E2ciency of Markets ❖ 126
c. The use of medical care is excessive in the sense that consumers get
d. To prevent this excessive use, the consumer must bear the marginal cost of
the procedure. But this would require eliminating insurance. Another
© 2018 Cengage Learning®. May not be scanned, copied or duplicated, or posted to a publicly accessible website,
in whole or in part, except for use as permitted in a license distributed with a certain product or service or otherwise
on a password-protected website or school-approved learning management system for classroom use.