rkets
WHAT’S NEW IN THE EIGHTH EDITION:
There is a new Ask the Experts feature on “Supplying Kidneys.”
LEARNING OBJECTIVES:
By the end of this chapter, students should understand:
the link between buyers’ willingness to pay for a good and the demand curve.
how to dene and measure consumer surplus.
the link between sellers’ costs of producing a good and the supply curve.
how to dene and measure producer surplus.
115
© 2018 Cengage Learning®. May not be scanned, copied or duplicated, or posted to a publicly accessible website,
in whole or in part, except for use as permitted in a license distributed with a certain product or service or otherwise
on a password-protected website or school-approved learning management system for classroom use.
7CONSUMERS, PRODUCERS,
AND THE EFFICIENCY OF

116 ❖ Chapter 7/Consumers, Producers, and the E>ciency of Markets
that the equilibrium of supply and demand maximizes total surplus in a market.
CONTEXT AND PURPOSE:
Chapter 7 is the rst chapter in a three-chapter sequence on welfare economics and market
e>ciency. Chapter 7 employs the supply and demand model to develop consumer surplus
and producer surplus as a measure of welfare and market e>ciency. These concepts are
used in Chapters 8 and 9 to determine the winners and losers from taxation and restrictions
on international trade.
The purpose of Chapter 7 is to develop welfare economics—the study of how the
allocation of resources aCects economic well-being. Chapters 4 through 6 employed supply
and demand in a positive framework, which focused on the question, “What is the
equilibrium price and quantity in a market?” This chapter now addresses the normative
question, “Is the equilibrium price and quantity in a market the best possible solution to the
resource allocation problem, or is it simply the price and quantity that balance supply and
demand?” Students will discover that under most circumstances the equilibrium price and
quantity is also the one that maximizes welfare.
KEY POINTS:
Consumer surplus equals buyers’ willingness to pay for a good minus the amount they
actually pay, and it measures the benet buyers get from participating in a market.
Consumer surplus can be computed by nding the area below the demand curve and
above the price.
Producer surplus equals the amount sellers receive for their goods minus their costs of
production, and it measures the benet sellers get from participating in a market.
Producer surplus can be computed by nding the area below the price and above the
supply curve.
An allocation of resources that maximizes total surplus (the sum of consumer and
producer surplus) is said to be e>cient. Policymakers are often concerned with the
e>ciency, as well as the equality, of economic outcomes.
© 2018 Cengage Learning®. May not be scanned, copied or duplicated, or posted to a publicly accessible website,
in whole or in part, except for use as permitted in a license distributed with a certain product or service or otherwise
on a password-protected website or school-approved learning management system for classroom use.
Chapter 7/Consumers, Producers, and the E>ciency of Markets ❖ 117
The equilibrium of supply and demand maximizes total surplus. That is, the invisible
hand of the marketplace leads buyers and sellers to allocate resources e>ciently.
Markets do not allocate resources e>ciently in the presence of market failures such as
market power or externalities.
CHAPTER OUTLINE:
I. Denition of welfare economics: the study of how the allocation of resources
a-ects economic well-being.
II. Consumer Surplus
A. Willingness to Pay
1. Denition of willingness to pay: the maximum amount that a buyer will
pay for a good.
2. Example: You are auctioning a mint-condition recording of Elvis Presley’s rst
album. Four buyers show up. Their willingness to pay is as follows:
© 2018 Cengage Learning®. May not be scanned, copied or duplicated, or posted to a publicly accessible website,
in whole or in part, except for use as permitted in a license distributed with a certain product or service or otherwise
on a password-protected website or school-approved learning management system for classroom use.
Students will understand consumer surplus if you take the time to work
through the Elvis Presley example. If you start with this simple example,
students will have no trouble understanding how to nd consumer surplus
Table 1
Students often are confused by the use of the word “welfare.” Remind
them that we are talking about social well-being and not public
assistance.
118 ❖ Chapter 7/Consumers, Producers, and the E>ciency of Markets
Buyer Willingness to
Pay
Taylor $100
Carrie $80
Rihanna $70
Gaga $50
If the bidding goes to slightly higher than $80, all buyers drop out except for
Taylor. Because Taylor is willing to pay more than she has to for the album, she
derives some benet from participating in the market.
3. Denition of consumer surplus: the amount a buyer is willing to pay for a
good minus the amount the buyer actually pays for it.
© 2018 Cengage Learning®. May not be scanned, copied or duplicated, or posted to a publicly accessible website,
in whole or in part, except for use as permitted in a license distributed with a certain product or service or otherwise
on a password-protected website or school-approved learning management system for classroom use.

Chapter 7/Consumers, Producers, and the E>ciency of Markets ❖ 119
4. Note that if you had more than one copy of the album, the price in the auction
would end up being lower (a little over $70 in the case of two albums) and both
Taylor and Carrie would gain consumer surplus.
© 2018 Cengage Learning®. May not be scanned, copied or duplicated, or posted to a publicly accessible website,
in whole or in part, except for use as permitted in a license distributed with a certain product or service or otherwise
on a password-protected website or school-approved learning management system for classroom use.
Activity 1—Value of a Time Machine
Type: In-class demonstration
Topics: Consumer surplus
Materials needed: None
Time: 10 minutes
Class limitations: Works in any size class
Purpose
Consumer surplus can be a hard concept for students because it is based on
avoided expense rather than on money that is actually exchanged. This example
puts a specic dollar value on consumer surplus.
Instructions
Tell the class, “A new technology has been developed that allows individuals to
travel backward or forward in time. We want to identify the value this time
machine provides to consumers. Let’s assume the four consumers who most
desire this product are in this class.”
Choose four student names and use them in the following example:
“Scott is the consumer who most values this product. He wants to go back to
the time of the dinosaurs. He is willing to pay $3,000.”
“Carol is the consumer with the next highest willingness to pay. She would like
to see 200 years in the future. She’d pay $2,500.”
“Steve is the next highest bidder. He’d like to relive this entire semester. He’ll
pay up to $800.”
“We can calculate the consumer surplus of three trips. Scott would pay $3,000 but
only pays $500, leaving $2,500 of net benets.” (Put these numbers on the
board.) “Carol has net benets of $2,000. Steve has $300 in net benets. Adding
up these net savings gives $4,800 in consumer surplus.”
Points for Discussion
The consumer surplus depends on a good’s selling price and the number of
consumers who are willing to purchase the good at that price. The lower the price,
120 ❖ Chapter 7/Consumers, Producers, and the E>ciency of Markets
B. Using the Demand Curve to Measure Consumer Surplus
1. We can use the information on willingness to pay to derive a demand curve for
the rare Elvis Presley album.
Price Buyers Quantity
Demande
d
More than
$100
None 0
$80 to
$100
Taylor 1
$70 to $80 Taylor,
Carrie
2
$50 to $70 Taylor,
Carrie,
Rihanna
3
$50 or less Taylor,
Carrie,
Rihanna,
Gaga
4
2. At any given quantity, the price given by the demand curve rePects the
willingness to pay of the marginal buyer. Because the demand curve shows the
buyers’ willingness to pay, we can use the demand curve to measure consumer
surplus.
© 2018 Cengage Learning®. May not be scanned, copied or duplicated, or posted to a publicly accessible website,
in whole or in part, except for use as permitted in a license distributed with a certain product or service or otherwise
on a password-protected website or school-approved learning management system for classroom use.
Quantit
y
8
0
Price
of
Album
1234
0
100
70
50
Demand
Figure 1
Figure 2
Chapter 7/Consumers, Producers, and the E>ciency of Markets ❖ 121
3. Consumer surplus can be measured as the area below the demand curve and
above the price.
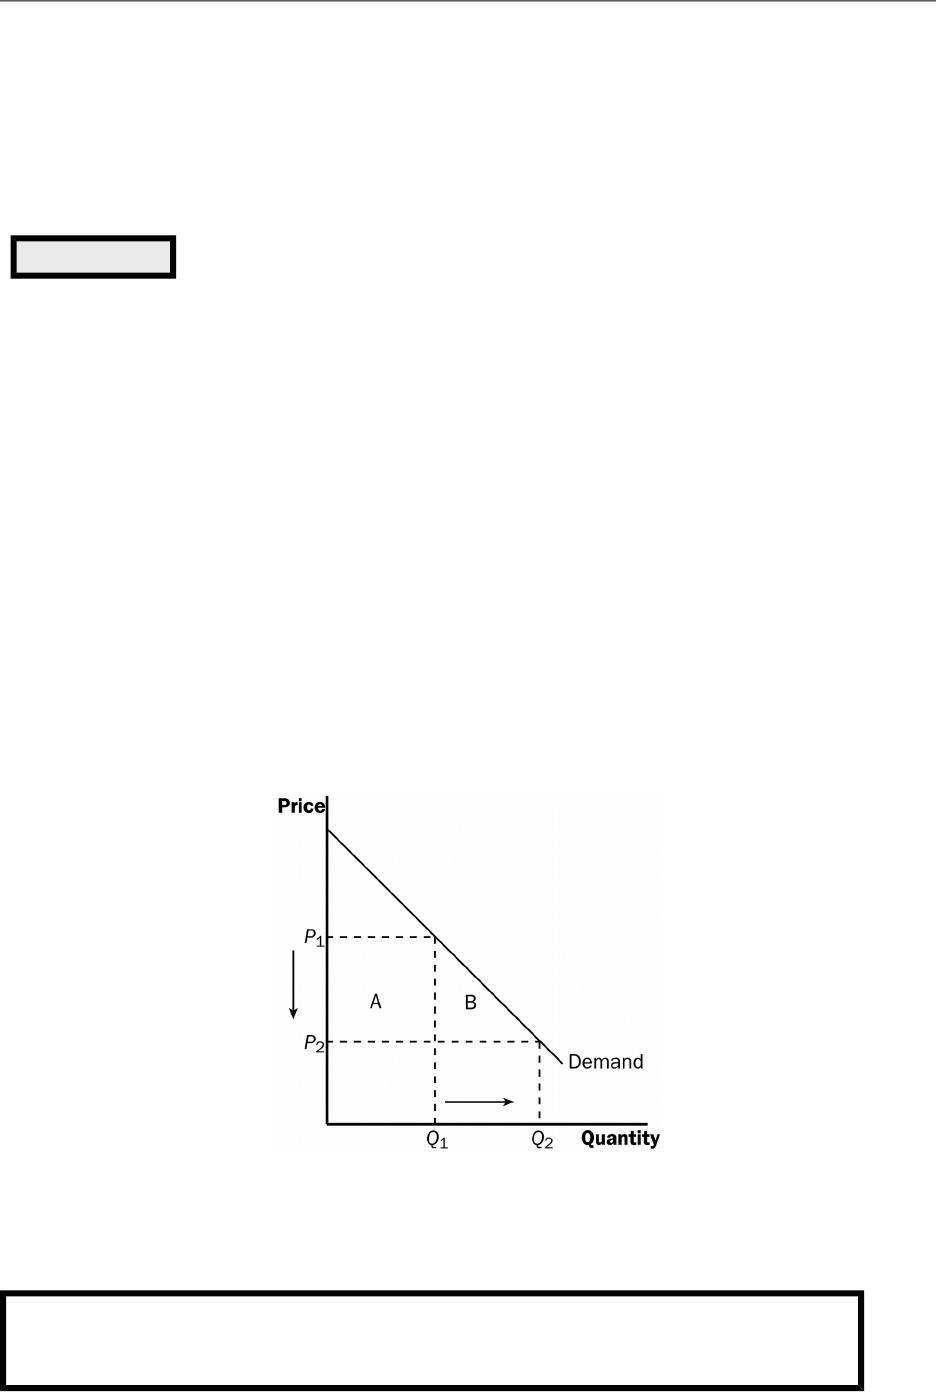
C. How a Lower Price Raises Consumer Surplus
1. As price falls, consumer surplus increases for two reasons.
a. Those already buying the product will receive additional consumer surplus
because they are paying less for the product than before (area A on the
graph).
b. Because the price is now lower, some new buyers will enter the market and
receive consumer surplus on these additional units of output purchased (area
B on the graph).
D. What Does Consumer Surplus Measure?
© 2018 Cengage Learning®. May not be scanned, copied or duplicated, or posted to a publicly accessible website,
in whole or in part, except for use as permitted in a license distributed with a certain product or service or otherwise
on a password-protected website or school-approved learning management system for classroom use.
It is important to stress that consumer surplus is measured in monetary
terms. Consumer surplus gives us a way to place a monetary cost on
ine>cient market outcomes (due to government involvement or market
Figure 3
122 ❖ Chapter 7/Consumers, Producers, and the E>ciency of Markets
1. Remember that consumer surplus is the diCerence between the amount that
buyers are willing to pay for a good and the price that they actually pay.
2. Thus, it measures the benet that consumers receive from the good as the buyers
themselves perceive it.
ALTERNATIVE CLASSROOM EXAMPLE:
Review the material on price ceilings from Chapter 6. Redraw the market for
two-bedroom apartments in your town. Draw in a price ceiling below the
equilibrium price.
III. Producer Surplus
A. Cost and the Willingness to Sell
1. Denition of cost: the value of everything a seller must give up to
produce a good.
© 2018 Cengage Learning®. May not be scanned, copied or duplicated, or posted to a publicly accessible website,
in whole or in part, except for use as permitted in a license distributed with a certain product or service or otherwise
on a password-protected website or school-approved learning management system for classroom use.
You will need to take some time to explain the relationship between the
producers’ willingness to sell and the cost of producing the good. The
relationship between cost and the supply curve is not as apparent as the
relationship between the demand curve and willingness to pay.
Chapter 7/Consumers, Producers, and the E>ciency of Markets ❖ 123
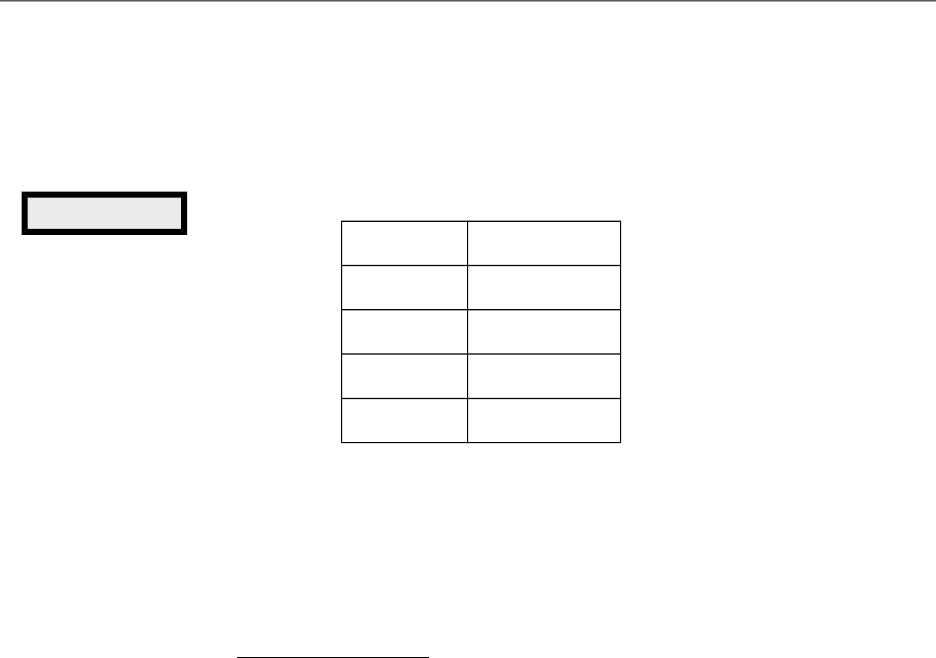
2. Example: You want to hire someone to paint your house. You accept bids for the
work from four sellers. Each painter is willing to work if the price you will pay
exceeds her opportunity cost. (Note that this opportunity cost thus represents
willingness to sell.) The costs are:
Seller Cost
Vincent $900
Claude $800
Pablo $600
Andy $500
3. Bidding will stop when the price gets to be slightly below $600. All sellers will
drop out except for Andy. Because Andy receives more than he would require to
paint the house, he derives some benet from producing in the market.
4. Denition of producer surplus: the amount a seller is paid for a good
minus the seller’s cost of providing it.
5. Note that if you had more than one house to paint, the price in the auction would
end up being higher (a little under $800 in the case of two houses) and both Andy
and Pablo would gain producer surplus.
© 2018 Cengage Learning®. May not be scanned, copied or duplicated, or posted to a publicly accessible website,
in whole or in part, except for use as permitted in a license distributed with a certain product or service or otherwise
on a password-protected website or school-approved learning management system for classroom use.
Table 2
124 ❖ Chapter 7/Consumers, Producers, and the E>ciency of Markets
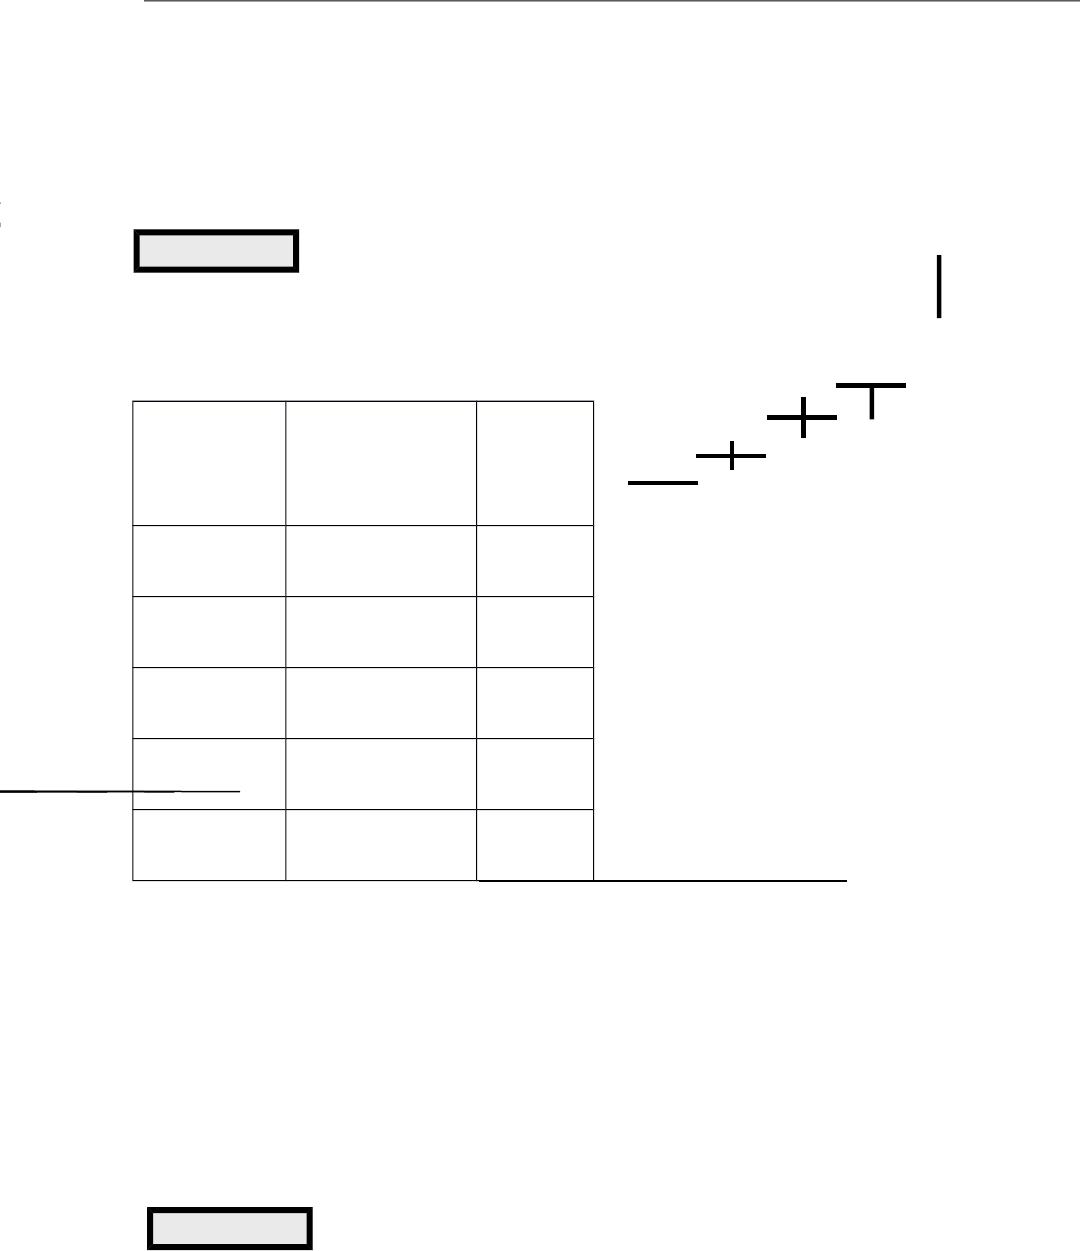
B. Using the Supply Curve to Measure Producer Surplus
1. We can use the information on cost (willingness to sell) to derive a supply curve
for house painting services.
Price Sellers Quantit
y
Supplie
d
$900 or
more
Vincent, Claude,
Pablo, Andy
4
$800 to
$900
Claude, Pablo,
Andy
3
$600 to
$800
Pablo, Andy 2
$500 to
$600
Andy 1
less than
$500
None 0
2. At any given quantity, the price given by the supply curve represents the cost of
the marginal seller. Because the supply curve shows the sellers’ cost (willingness
to sell), we can use the supply curve to measure producer surplus.
3. Producer surplus can be measured as the area above the supply curve and below
the price.
© 2018 Cengage Learning®. May not be scanned, copied or duplicated, or posted to a publicly accessible website,
in whole or in part, except for use as permitted in a license distributed with a certain product or service or otherwise
on a password-protected website or school-approved learning management system for classroom use.
Figure 5
Price of
House
Painting
1 2 3 4
0
900
800
500
600
Supply
Quantit
y
Figure 4
Chapter 7/Consumers, Producers, and the E>ciency of Markets ❖ 125
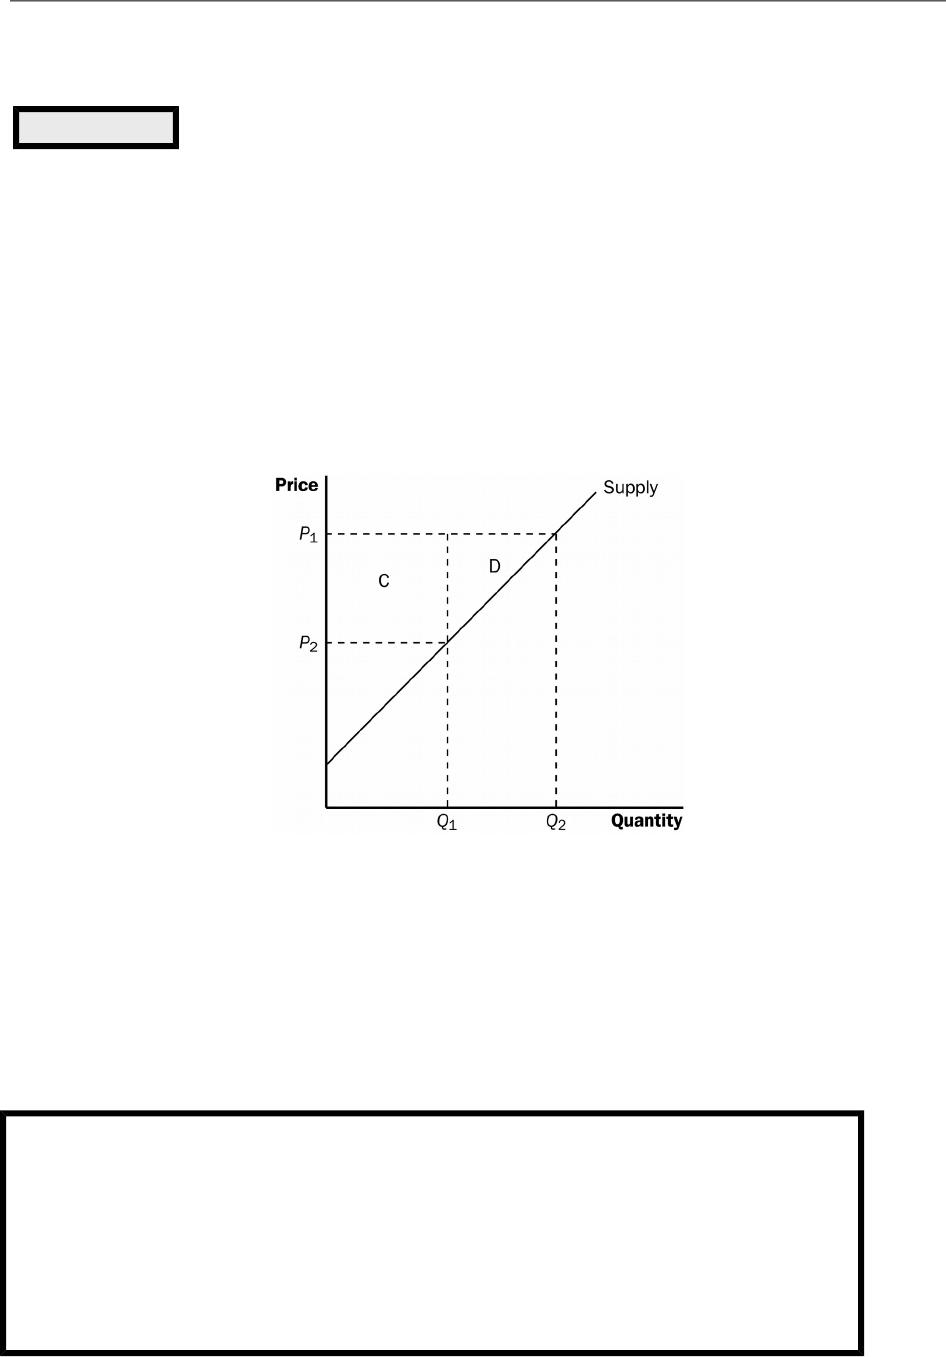
C. How a Higher Price Raises Producer Surplus
1. As price rises, producer surplus increases for two reasons.
a. Those already selling the product will receive additional producer surplus
because they are receiving more for the product than before (area C on the
graph).
b. Because the price is now higher, some new sellers will enter the market and
receive producer surplus on these additional units of output sold (area D on
the graph).
D. Producer surplus is used to measure the economic well-being of producers, much like
consumer surplus is used to measure the economic well-being of consumers.
© 2018 Cengage Learning®. May not be scanned, copied or duplicated, or posted to a publicly accessible website,
in whole or in part, except for use as permitted in a license distributed with a certain product or service or otherwise
on a password-protected website or school-approved learning management system for classroom use.
ALTERNATIVE CLASSROOM EXAMPLE:
Review the material on price Poors from Chapter 6. Redraw the market for an
agricultural product such as corn. Draw in a price support above the equilibrium
price.
Then go through:
Figure 6
126 ❖ Chapter 7/Consumers, Producers, and the E>ciency of Markets
IV. Market E>ciency
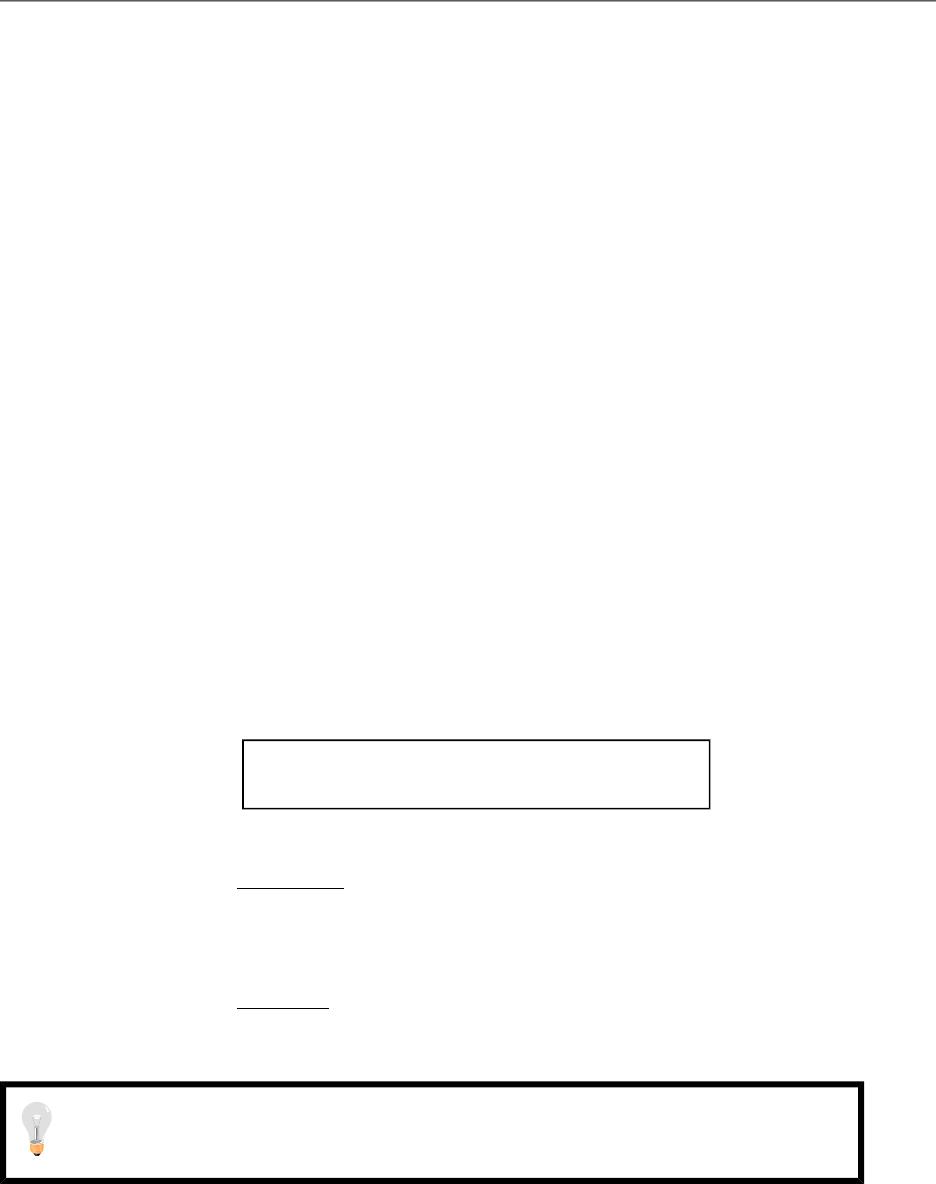
A. The Benevolent Social Planner
1. The economic well-being of everyone in society can be measured by total surplus,
which is the sum of consumer surplus and producer surplus:
Total Surplus = Consumer Surplus + Producer Surplus
Total Surplus = (Value to Buyers – Amount Paid by Buyers) +
(Amount Received by Sellers – Cost to Sellers)
Because the Amount Paid by Buyers = Amount Received by
Sellers:
2. Denition of e8ciency: the property of a resource allocation of
maximizing the total surplus received by all members of society.
3. Denition of equality: the property of distributing economic prosperity
uniformly the members of society.
B. Evaluating the Market Equilibrium
© 2018 Cengage Learning®. May not be scanned, copied or duplicated, or posted to a publicly accessible website,
in whole or in part, except for use as permitted in a license distributed with a certain product or service or otherwise
on a password-protected website or school-approved learning management system for classroom use.
Now might be a good time to point out that many government policies
involve a trade-oC between e>ciency and equality. When you evaluate
government policies, like price ceilings or Poors, you can explain them in
Total Surplus = Value to Buyers Cost to Sellers–
Chapter 7/Consumers, Producers, and the E>ciency of Markets ❖ 127
1. At the market equilibrium price:
a. Buyers who value the product more than the equilibrium price will purchase
the product; those who do not, will not purchase the product. In other words,
the free market allocates the supply of a good to the buyers who value it most
highly, as measured by their willingness to pay.
b. Sellers whose costs are lower than the equilibrium price will produce the
product; those whose costs are higher, will not produce the product. In other
words, the free market allocates the demand for goods to the sellers who can
produce it at the lowest cost.
2. Total surplus is maximized at the market equilibrium.
© 2018 Cengage Learning®. May not be scanned, copied or duplicated, or posted to a publicly accessible website,
in whole or in part, except for use as permitted in a license distributed with a certain product or service or otherwise
on a password-protected website or school-approved learning management system for classroom use.
Figure 7
128 ❖ Chapter 7/Consumers, Producers, and the E>ciency of Markets
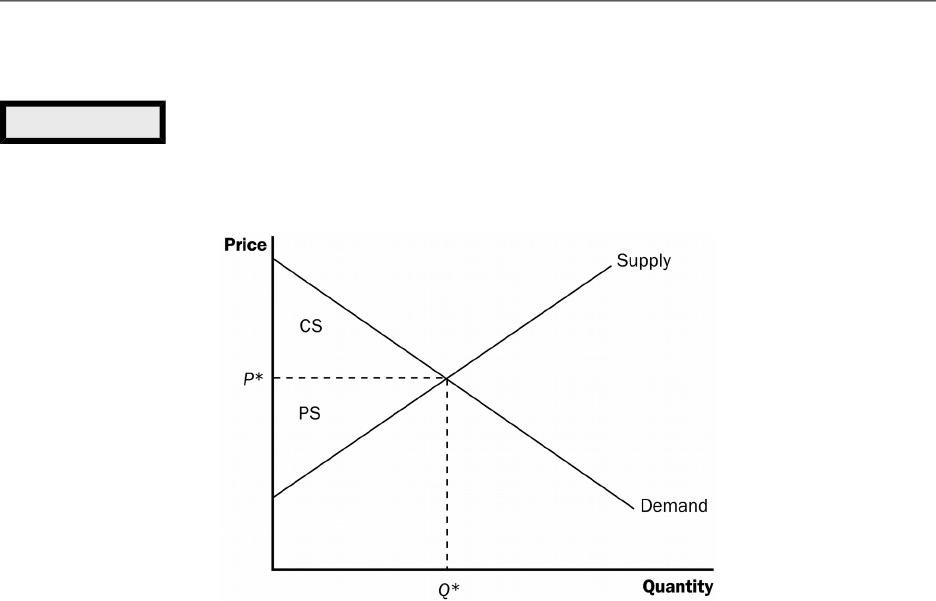
a. At any quantity of output smaller than the equilibrium quantity, the value of
the product to the marginal buyer is greater than the cost to the marginal
seller so total surplus would rise if output increases.
b. At any quantity of output greater than the equilibrium quantity, the value of
the product to the marginal buyer is less than the cost to the marginal seller
so total surplus would rise if output decreases.
3. Note that this is one of the reasons that economists believe Principle #6: Markets
are usually a good way to organize economic activity.
© 2018 Cengage Learning®. May not be scanned, copied or duplicated, or posted to a publicly accessible website,
in whole or in part, except for use as permitted in a license distributed with a certain product or service or otherwise
on a password-protected website or school-approved learning management system for classroom use.
It would be a good idea to remind students that there are circumstances
when the market process does not lead to the most e>cient outcome.
Examples include situations such as when a rm (or buyer) has market
power over price or when there are externalities present. These situations
Figure 8

Chapter 7/Consumers, Producers, and the E>ciency of Markets ❖ 129
C. In the News: The Invisible Hand Can Park Your Car
1. Parking spots with meters that have variable rates depending on demand and
supply can result in a more e>cient allocation of this scarce resource.
2. This article from The New York Times describes an experiment with parking meter
rates in San Francisco.
D. Case Study: Should There Be a Market for Organs?
1. As a matter of public policy, people are not allowed to sell their organs.
a. In essence, this means that there is a price ceiling on organs of $0.
b. This has led to a shortage of organs.
2. The creation of a market for organs would lead to a more e>cient allocation of
resources, but critics worry about the fairness of a market system for organs.
E. Ask the Experts: Supplying Kidneys
1. Economic experts were asked whether they agreed with the creation of a trial
market that allows payment for human kidneys to extend the lives of those with
kidney disease.
2. 57 percent of the experts agreed, while 16 percent disagreed and 27 percent
were uncertain.
V. Market E>ciency and Market Failure
© 2018 Cengage Learning®. May not be scanned, copied or duplicated, or posted to a publicly accessible website,
in whole or in part, except for use as permitted in a license distributed with a certain product or service or otherwise
on a password-protected website or school-approved learning management system for classroom use.

130 ❖ Chapter 7/Consumers, Producers, and the E>ciency of Markets
A. To conclude that markets are e>cient, we made several assumptions about how
markets worked.
1. Perfectly competitive markets.
2. No externalities.
B. When these assumptions do not hold, the market equilibrium may not be e>cient.
C. When markets fail, public policy can potentially remedy the situation.
© 2018 Cengage Learning®. May not be scanned, copied or duplicated, or posted to a publicly accessible website,
in whole or in part, except for use as permitted in a license distributed with a certain product or service or otherwise
on a password-protected website or school-approved learning management system for classroom use.