WHAT’S NEW IN THE EIGHTH EDITION:
There are two new Ask the Experts features on “Rent Control” and “The Minimum Wage.”
LEARNING OBJECTIVES:
By the end of this chapter, students should understand:
the eects of government policies that place a ceiling on prices.
the eects of government policies that put a oor under prices.
how a tax on a good aects the price of the good and the quantity sold.
that taxes levied on sellers and taxes levied on buyers are equivalent.
99
© 2018 Cengage Learning®. May not be scanned, copied or duplicated, or posted to a publicly accessible website,
in whole or in part, except for use as permitted in a license distributed with a certain product or service or otherwise
on a password-protected website or school-approved learning management system for classroom use.
6SUPPLY, DEMAND, AND
GOVERNMENT POLICIES

100 ❖ Chapter 6/Supply, Demand, and Government Policies
how the burden of a tax is split between buyers and sellers.
CONTEXT AND PURPOSE:
Chapter 6 is the third chapter in a three-chapter sequence that deals with supply and
demand and how markets work. Chapter 4 developed the model of supply and demand.
Chapter 5 added precision to the model of supply and demand by developing the concept of
elasticity—the sensitivity of the quantity supplied and quantity demanded to changes in
economic conditions. Chapter 6 addresses the impact of government policies on competitive
markets using the tools of supply and demand that you learned in Chapters 4 and 5.
The purpose of Chapter 6 is to consider two types of government policies—price controls
and taxes. Price controls set the maximum or minimum price at which a good can be sold
while a tax creates a wedge between what the buyer pays and what the seller receives.
These policies can be analyzed within the model of supply and demand. We will Cnd that
government policies sometimes produce unintended consequences.
KEY POINTS:
A price ceiling is a legal maximum on the price of a good or service. An example is rent
control. If the price ceiling is below the equilibrium price, then the price ceiling is binding,
and the quantity demanded exceeds the quantity supplied. Because of the resulting
shortage, sellers must in some way ration the good or service among buyers.
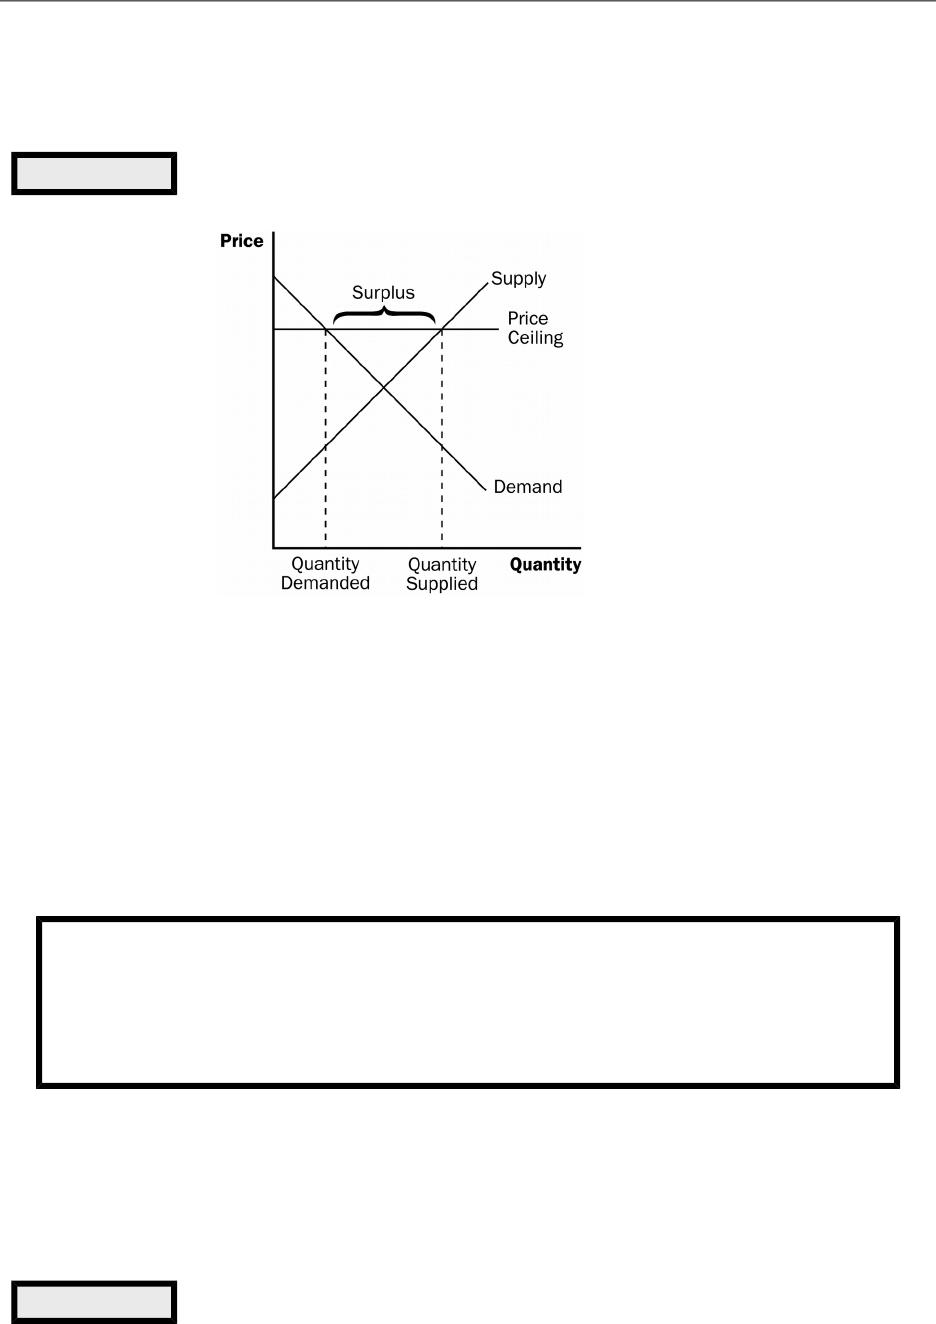
A price oor is a legal minimum on the price of a good or service. An example is the
minimum wage. If the price oor is above the equilibrium price, then the price oor is
binding, and the quantity supplied exceeds the quantity demanded. Because of the
resulting surplus, buyers’ demands for the good or service must in some way be rationed
among sellers.
When the government levies a tax on a good, the equilibrium quantity of the good falls.
That is, a tax on a market shrinks the size of the market.
© 2018 Cengage Learning®. May not be scanned, copied or duplicated, or posted to a publicly accessible website,
in whole or in part, except for use as permitted in a license distributed with a certain product or service or otherwise
on a password-protected website or school-approved learning management system for classroom use.
Chapter 6/Supply, Demand, and Government Policies ❖ 101
A tax on a good places a wedge between the price paid by buyers and the price received
by sellers. When the market moves to the new equilibrium, buyers pay more for the good
and sellers receive less for it. In this sense, buyers and sellers share the tax burden. The
incidence of a tax (that is, the division of the tax burden) does not depend on whether
the tax is levied on buyers or sellers.
The incidence of a tax depends on the price elasticities of supply and demand. Most of
the burden falls on the side of the market that is less elastic because that side of the
market cannot respond as easily to the tax by changing the quantity bought or sold.
CHAPTER OUTLINE:
I. Controls on Prices
A. DeCnition of price ceiling: a legal maximum on the price at which a good can
be sold.
B. DeCnition of price 1oor: a legal minimum on the price at which a good can be
sold.
C. How Price Ceilings Aect Market Outcomes
1. There are two possible outcomes if a price ceiling is put into place in a market.
a. If the price ceiling is higher than or equal to the equilibrium price, it is not
binding and has no eect on the price or quantity sold.
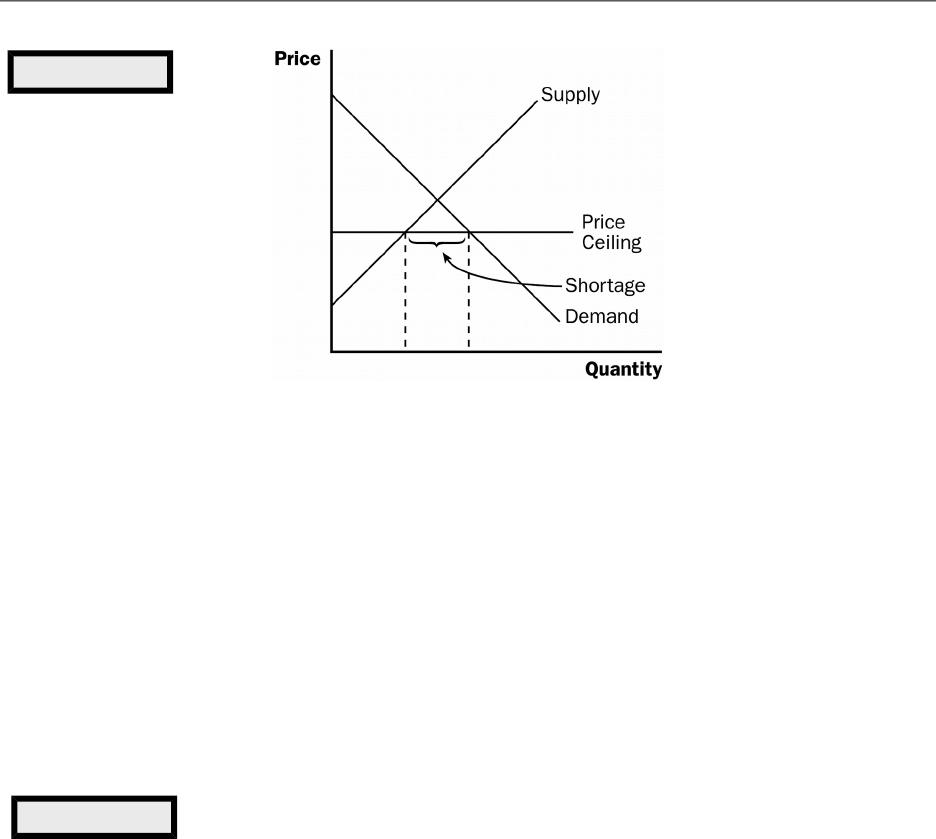
b. If the price ceiling is lower than the equilibrium price, the ceiling is a binding
constraint and a shortage is created.
© 2018 Cengage Learning®. May not be scanned, copied or duplicated, or posted to a publicly accessible website,
in whole or in part, except for use as permitted in a license distributed with a certain product or service or otherwise
on a password-protected website or school-approved learning management system for classroom use.
102 ❖ Chapter 6/Supply, Demand, and Government Policies
2. If a shortage for a product occurs (and price cannot adjust to eliminate it), a
method for rationing the good must develop.
3. Not all buyers beneCt from a price ceiling because some will be unable to
purchase the product.
4. Case Study: Lines at the Gas Pump
Figure 2
a. In 1973, OPEC raised the price of crude oil, which led to a reduction in the
supply of gasoline.
b. The federal government put a price ceiling into place and this created large
shortages.
c. Motorists were forced to spend large amounts of time in line at the gas pump
(which is how the gas was rationed).
d. Eventually, the government realized its mistake and repealed the price ceiling.
© 2018 Cengage Learning®. May not be scanned, copied or duplicated, or posted to a publicly accessible website,
in whole or in part, except for use as permitted in a license distributed with a certain product or service or otherwise
on a password-protected website or school-approved learning management system for classroom use.
Figure 1
Chapter 6/Supply, Demand, and Government Policies ❖ 103
5. Case Study: Rent Control in the Short Run and the Long Run
Figure 3
a. The goal of rent control is to make housing more aordable for the poor.
b. Because the supply of apartments is Cxed (perfectly inelastic) in the short run
and upward sloping (elastic) in the long run, the shortage is much larger in the
long run than in the short run.
c. Rent-controlled apartments are rationed in a number of ways including long
waiting lists, discrimination against minorities and families with children, and
even under-the-table payments to landlords.
d. The quality of apartments also suers due to rent control.
6. Ask the Experts: Rent Control
a. 95 percent of economic experts disagreed that local ordinances allowing rent
control have had a positive eect over the past three decades on the amount
and quality of aordable rental housing.
D. How Price Floors Aect Market Outcomes
© 2018 Cengage Learning®. May not be scanned, copied or duplicated, or posted to a publicly accessible website,
in whole or in part, except for use as permitted in a license distributed with a certain product or service or otherwise
on a password-protected website or school-approved learning management system for classroom use.
ALTERNATIVE CLASSROOM EXAMPLE:
Ask students about the rental market in their town. Draw a supply-and-demand
graph for two-bedroom apartments asking students what they believe the
equilibrium rental rate is. Then suggest that the city council is accusing landlords
of taking advantage of students and thus places a price ceiling below the
equilibrium price. Make sure that students can see that a shortage of apartments
104 ❖ Chapter 6/Supply, Demand, and Government Policies
1. There are two possible outcomes if a price oor is put into place in a market.
Figure 4
a. If the price oor is lower than or equal to the equilibrium price, it is not
binding and has no eect on the price or quantity sold.
b. If the price oor is higher than the equilibrium price, the oor is a binding
constraint and a surplus is created.
ALTERNATIVE CLASSROOM EXAMPLE:
Go through an example with an agricultural price support. Show students that,
even though a price support is not a legal minimum price, its result is exactly the
same as a price oor. Make sure that students can see that a surplus will result.
Ask students to identify the winners and losers of this government policy. Make
2. Case Study: The Minimum Wage
Figure 5
© 2018 Cengage Learning®. May not be scanned, copied or duplicated, or posted to a publicly accessible website,
in whole or in part, except for use as permitted in a license distributed with a certain product or service or otherwise
on a password-protected website or school-approved learning management system for classroom use.

Chapter 6/Supply, Demand, and Government Policies ❖ 105
a. The market for labor looks like any other market: downward-sloping demand,
upward-sloping supply, an equilibrium price (called a wage), and an
equilibrium quantity of labor hired.
b. If the minimum wage is above the equilibrium wage in the labor market, a
surplus of labor will develop (unemployment).
c. The minimum wage will be a binding constraint only in markets where
equilibrium wages are low.
d. Thus, the minimum wage will have its greatest impact on the market for
teenagers and other unskilled workers.
© 2018 Cengage Learning®. May not be scanned, copied or duplicated, or posted to a publicly accessible website,
in whole or in part, except for use as permitted in a license distributed with a certain product or service or otherwise
on a password-protected website or school-approved learning management system for classroom use.
106 ❖ Chapter 6/Supply, Demand, and Government Policies
3. Ask the Experts : The Minimum Wage
a. Economic experts’ opinions are split on the eects of an increase in the
minimum wage.
b. When asked if they thought the employment rate for low wage US workers
would be substantially lower with a minimum wage that gradually increased to
$15 per hour by 2020, 34 percent agreed, 29 percent disagreed, and 37
percent were uncertain.
E. Evaluating Price Controls
1. Because most economists feel that markets are usually a good way to organize
economic activity, most oppose the use of price ceilings and oors.
a. Prices balance supply and demand and thus coordinate economic activity.
b. If prices are set by laws, they obscure the signals that eOciently allocate
scarce resources.
This is a good chance to reinforce the principle “Markets are usually a
good way to organize economic activity.”
2. Price ceilings and price oors often hurt the people they are intended to help.
a. Rent controls create a shortage of quality housing and provide disincentives
for building maintenance.
b. Minimum wage laws create higher rates of unemployment for teenage and
low skilled workers.
© 2018 Cengage Learning®. May not be scanned, copied or duplicated, or posted to a publicly accessible website,
in whole or in part, except for use as permitted in a license distributed with a certain product or service or otherwise
on a password-protected website or school-approved learning management system for classroom use.
Chapter 6/Supply, Demand, and Government Policies ❖ 107
Be prepared to answer the question, “If price controls have such adverse
consequences, why are they imposed?” You may want to point out that,
sometimes, economic ignorance leads to unintended outcomes. You may
also want to point out that economic analysis serves as only a guide to
policymakers. They may choose to ignore it when forming policy. In
addition, it is often interesting to encourage the students to think about
© 2018 Cengage Learning®. May not be scanned, copied or duplicated, or posted to a publicly accessible website,
in whole or in part, except for use as permitted in a license distributed with a certain product or service or otherwise
on a password-protected website or school-approved learning management system for classroom use.

108 ❖ Chapter 6/Supply, Demand, and Government Policies
Activity 1—Ducks in a Row
Type: In-class demonstration
Topics: Price ceilings, subsidies, and unintended consequences
Materials needed: 2 toy ducks, some play money, 3 volunteers
Time: 10 minutes
Class limitations: Works in any size class
Purpose
This demonstration illustrates some common problems of government
intervention in markets.
Instructions
One volunteer plays the role of the government in a poor country. Give the play
money to the “government,” except for $1. The government uses this money to
buy ducks from the farmer and provides the ducks to the shopkeeper. The second
volunteer is an urban shopkeeper. The shopkeeper asks the government for more
ducks whenever he or she is sold out. Give the shopkeeper one duck. The third
volunteer is a consumer. The consumer buys ducks. Give the consumer $1 in play
money. The instructor is a duck farmer. The farmer keeps the second duck.
Explain this background: “Ducks are a staple food in this country but they are
expensive at $3 each. The government wants to make food cheap for the urban
poor to alleviate hunger. They calculate people could aord ducks if they were
priced at $1. The government decides to impose a price ceiling of $1; $1 is now
the maximum retail price for ducks.”
Examples of unit taxes include most government excise taxes on products
such as gasoline, alcohol, and tobacco.
© 2018 Cengage Learning®. May not be scanned, copied or duplicated, or posted to a publicly accessible website,
in whole or in part, except for use as permitted in a license distributed with a certain product or service or otherwise
on a password-protected website or school-approved learning management system for classroom use.
Chapter 6/Supply, Demand, and Government Policies ❖ 109
Use this chance to reinforce the three steps learned in Chapter 4.
Students should decide whether this tax law aects the demand curve or
the supply curve, decide which way it shifts, and then examine how the
shift aects equilibrium price and quantity.
II. Taxes
A. DeCnition of tax incidence: the manner in which the burden of a tax is shared
among participants in a market.
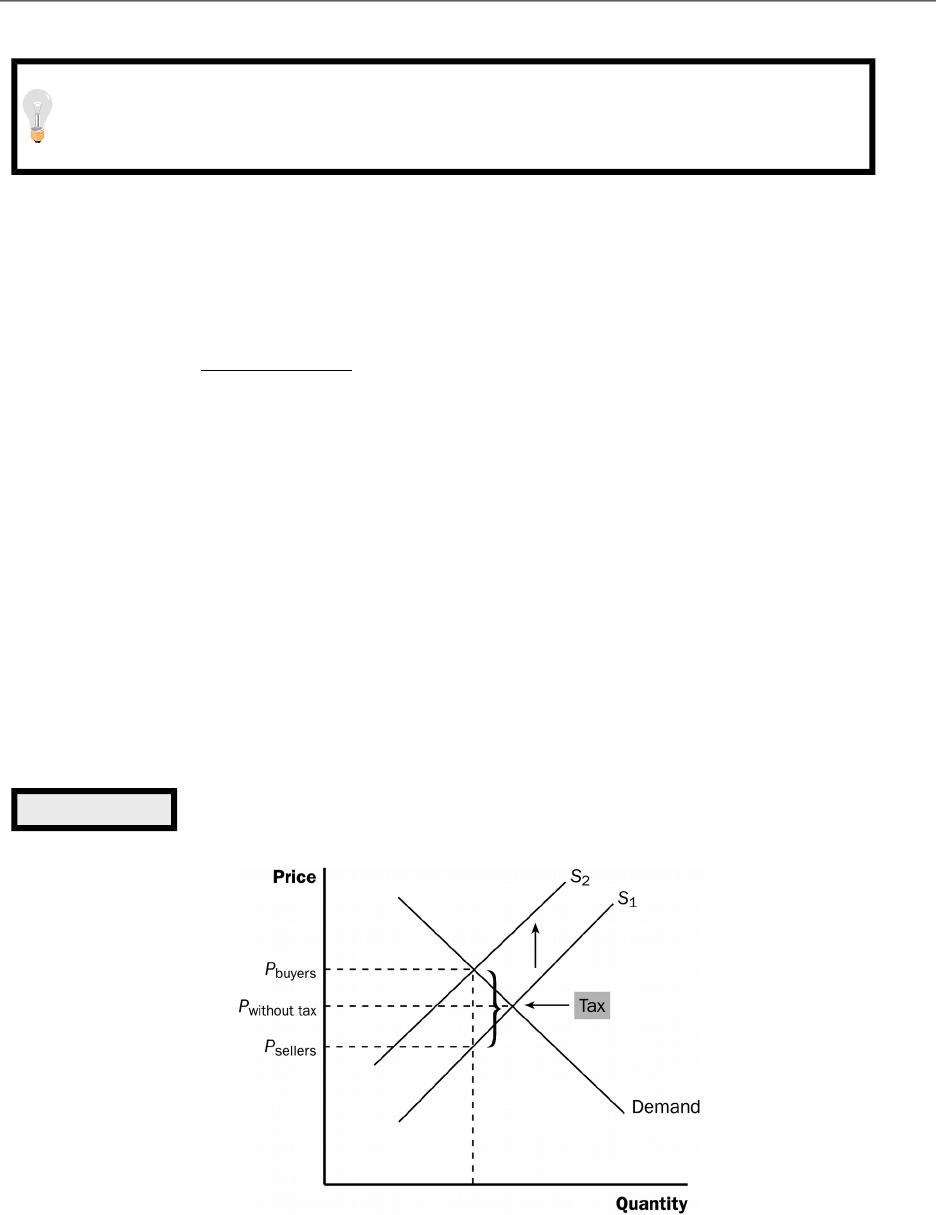
B. How Taxes on Sellers Aect Market Outcomes
1. If the government requires the seller to pay a certain dollar amount for each unit
of a good sold, this will cause a decrease in supply.
2. The supply curve will shift left by the exact amount of the tax.
Figure 6
© 2018 Cengage Learning®. May not be scanned, copied or duplicated, or posted to a publicly accessible website,
in whole or in part, except for use as permitted in a license distributed with a certain product or service or otherwise
on a password-protected website or school-approved learning management system for classroom use.
110 ❖ Chapter 6/Supply, Demand, and Government Policies
You will want to be very careful when discussing the “upward” shift of the
supply curve given that we encourage students to think of supply and
demand curves shifting “right” and “left.” Make sure to emphasize the
eects of the tax on sellers’ willingness to sell.
3. The quantity of the good sold will decline.
4. Buyers and sellers will share the burden of the tax; buyers pay more for the good
(including the tax) and sellers receive less.
5. Two lessons can be learned here.
a. Taxes discourage market activity.
b. Buyers and sellers share the burden of a tax.
C. How Taxes on Buyers Aect Market Outcomes
1. If the government requires the buyer to pay a certain dollar amount for each unit
of a good purchased, this will cause a decrease in demand.
2. The demand curve will shift left by the exact amount of the tax.
Again, be very careful when discussing the “downward” shift of the
demand curve. Describe the eects of the tax on buyers’ willingness to
buy.
Figure 7
© 2018 Cengage Learning®. May not be scanned, copied or duplicated, or posted to a publicly accessible website,
in whole or in part, except for use as permitted in a license distributed with a certain product or service or otherwise
on a password-protected website or school-approved learning management system for classroom use.
Chapter 6/Supply, Demand, and Government Policies ❖ 111
3. The quantity of the good sold will decline.
4. Buyers and sellers will share the burden of the tax; buyers pay more for the good
and sellers receive less (because of the tax).
Stress that the outcome of a tax levied on sellers is exactly the same as
the outcome of a tax levied on buyers. When drawing this in class, make
sure that the price that buyers end up paying and the price that sellers
end up receiving is the same in both examples.
D. Case Study: Can Congress Distribute the Burden of a Payroll Tax?
Figure 8
1. FICA (Social Security) taxes were designed so that Crms and workers would
equally share the burden of the tax.
2. This type of payroll tax will simply put a wedge between the wage the Crm pays
and the wage the workers will receive.
© 2018 Cengage Learning®. May not be scanned, copied or duplicated, or posted to a publicly accessible website,
in whole or in part, except for use as permitted in a license distributed with a certain product or service or otherwise
on a password-protected website or school-approved learning management system for classroom use.
112 ❖ Chapter 6/Supply, Demand, and Government Policies
3. It is true that Crms and workers share the burden of this tax, but it is not
necessarily 50-50.
Go through this material slowly. Make sure that students can see how to
Cnd the burden of the tax paid by consumers and the burden of the tax
paid by producers before discussing the eects of elasticity on tax
incidence. If you rush through this material, you will lose them.
E. Elasticity and Tax Incidence
1. When supply is elastic and demand is inelastic, the largest share of the tax
burden falls on consumers.
2. When supply is inelastic and demand is elastic, the largest share of the tax
burden falls on producers.
3. In general, a tax burden falls more heavily on the side of the market that is less
elastic.
a. A small elasticity of demand means that buyers do not have good alternatives
to consuming this product.
b. A small elasticity of supply means that sellers do not have good alternatives
to producing this particular good.
Figure 9
© 2018 Cengage Learning®. May not be scanned, copied or duplicated, or posted to a publicly accessible website,
in whole or in part, except for use as permitted in a license distributed with a certain product or service or otherwise
on a password-protected website or school-approved learning management system for classroom use.
Chapter 6/Supply, Demand, and Government Policies ❖ 113
4. Case Study: Who Pays the Luxury Tax?
a. In 1990, Congress adopted a new luxury tax.
b. The goal of the tax was to raise revenue from those who could most easily
aord to pay.
c. Because the demand for luxuries is often relatively more elastic than supply,
the burden of the tax fell on producers and their workers.
© 2018 Cengage Learning®. May not be scanned, copied or duplicated, or posted to a publicly accessible website,
in whole or in part, except for use as permitted in a license distributed with a certain product or service or otherwise
on a password-protected website or school-approved learning management system for classroom use.