
WHAT’S NEW IN THE EIGHTH EDITION:
A new question has been added to the Problems and Applications section.
LEARNING OBJECTIVES:
By the end of this chapter, students should understand:
the meaning of the elasticity of demand.
what determines the elasticity of demand.
the meaning of the elasticity of supply.
what determines the elasticity of supply.
80
© 2018 Cengage Learning®. May not be scanned, copied or duplicated, or posted to a publicly accessible website,
in whole or in part, except for use as permitted in a license distributed with a certain product or service or otherwise
on a password-protected website or school-approved learning management system for classroom use.
5ELASTICITY AND ITS
APPLICATION

81 ❖ Chapter 5/Elasticity and Its Application
the concept of elasticity in three very di4erent markets (the market for wheat, the
market for oil, and the market for illegal drugs).
CONTEXT AND PURPOSE:
Chapter 5 is the second chapter of a three-chapter sequence that deals with supply and
demand and how markets work. Chapter 4 introduced supply and demand. Chapter 5 shows
how much buyers and sellers respond to changes in market conditions. Chapter 6 will
address the impact of government policies on competitive markets.
The purpose of Chapter 5 is to add precision to the supply-and-demand model. We
introduce the concept of elasticity, which measures the responsiveness of buyers and sellers
to changes in economic variables such as prices and income. The concept of elasticity allows
us to make quantitative observations about the impact of changes in supply and demand on
equilibrium prices and quantities.
KEY POINTS:
The price elasticity of demand measures how much the quantity demanded responds to
changes in the price. Demand tends to be more elastic if close substitutes are available,
if the good is a luxury rather than a necessity, if the market is narrowly de;ned, or if
buyers have substantial time to react to a price change.
The price elasticity of demand is calculated as the percentage change in quantity
demanded divided by the percentage change in price. If quantity demanded moves
proportionately less than the price, then the elasticity is less than one, and demand is
said to be inelastic. If quantity demanded moves proportionately more than the price,
then the elasticity is greater than one, and demand is said to be elastic.
Total revenue, the total amount paid for a good, equals the price of the good times the
quantity sold. For inelastic demand curves, total revenue moves in the same direction as
the price. For elastic demand curves, total revenue moves in the opposite direction as
the price.
© 2018 Cengage Learning®. May not be scanned, copied or duplicated, or posted to a publicly accessible website,
in whole or in part, except for use as permitted in a license distributed with a certain product or service or otherwise
on a password-protected website or school-approved learning management system for classroom use.

Chapter 5/Elasticity and Its Application ❖ 82
The income elasticity of demand measures how much the quantity demanded responds
to changes in consumers’ income. The cross-price elasticity of demand measures how
much the quantity demanded of one good responds to the price of another good.
The price elasticity of supply measures how much the quantity supplied responds to
changes in the price. This elasticity often depends on the time horizon under
consideration. In most markets, supply is more elastic in the long run than in the short
run.
The price elasticity of supply is calculated as the percentage change in quantity supplied
divided by the percentage change in price. If quantity supplied moves proportionately
less than the price, then the elasticity is less than one, and supply is said to be inelastic.
If quantity supplied moves proportionately more than the price, then the elasticity is
greater than one, and supply is said to be elastic.
The tools of supply and demand can be applied in many di4erent kinds of markets. This
chapter uses them to analyze the market for wheat, the market for oil, and the market
for illegal drugs.
CHAPTER OUTLINE:
I. The Elasticity of Demand
A. De;nition of elasticity: a measure of the responsiveness of quantity
demanded or quantity supplied to one of its determinants.
B. The Price Elasticity of Demand and Its Determinants
1. De;nition of price elasticity of demand: a measure of how much the
quantity demanded of a good responds to a change in the price of that
good, computed as the percentage change in quantity demanded
divided by the percentage change in price.
© 2018 Cengage Learning®. May not be scanned, copied or duplicated, or posted to a publicly accessible website,
in whole or in part, except for use as permitted in a license distributed with a certain product or service or otherwise
on a password-protected website or school-approved learning management system for classroom use.

83 ❖ Chapter 5/Elasticity and Its Application
2. Determinants of the Price Elasticity of Demand
a. Availability of Close Substitutes: the more substitutes a good has, the more
elastic its demand.
b. Necessities versus Luxuries: necessities are more price inelastic.
c. De;nition of the market: narrowly de;ned markets (ice cream) have more
elastic demand than broadly de;ned markets (food).
d. Time Horizon: goods tend to have more elastic demand over longer time
horizons.
C. Computing the Price Elasticity of Demand
1. Formula
% change in quantity demanded
Price elasticity of demand = % change in price
Work through a few elasticity calculations, starting with the example in
the book. For principles of economics courses where there is no
mathematical prerequisite, this may be diCcult for some students.
Working through a few simple examples will help to alleviate some of the
2. Example: the price of ice cream rises by 10% and quantity demanded falls by
20%.
© 2018 Cengage Learning®. May not be scanned, copied or duplicated, or posted to a publicly accessible website,
in whole or in part, except for use as permitted in a license distributed with a certain product or service or otherwise
on a password-protected website or school-approved learning management system for classroom use.
Chapter 5/Elasticity and Its Application ❖ 84
Price elasticity of demand = (20%)/(10%) = 2
3. Because there is an inverse relationship between price and quantity demanded
(the price of ice cream rose by 10% and the quantity demanded fell by 20%), the
price elasticity of demand is sometimes reported as a negative number. We will
ignore the minus sign and concentrate on the absolute value of the elasticity.
Students hate this! Explain that it really makes things easier and makes
more sense because larger elasticities (in absolute value) imply greater
sensitivity and responsiveness.
D. The Midpoint Method: A Better Way to Calculate Percentage Changes and Elasticities
1. Because we use percentage changes in calculating the price elasticity of demand,
the elasticity calculated by going from one point to another on a demand curve
will be di4erent from an elasticity calculated by going from the second point to
the ;rst. This di4erence arises because the percentage changes are calculated
using a di4erent base.
a. A way around this problem is to use the midpoint method.
b. Using the midpoint method involves calculating the percentage change in
either price or quantity demanded by dividing the change in the variable by
the midpoint between the initial and ;nal levels rather than by the initial level
itself.
c. Example: the price rises from $4 to $6 and quantity demanded falls from 120
to 80.
% change in price = (6 − 4)/5 × 100 = 40%
% change in quantity demanded = (120 − 80)/100 x 100 = 40%
© 2018 Cengage Learning®. May not be scanned, copied or duplicated, or posted to a publicly accessible website,
in whole or in part, except for use as permitted in a license distributed with a certain product or service or otherwise
on a password-protected website or school-approved learning management system for classroom use.

85 ❖ Chapter 5/Elasticity and Its Application
price elasticity of demand = 40/40 = 1
( – ) /[( ) / ]
( – ) /[( ) / ]
2 1 1 2
2 1 1 2
2
Price elasticity of demand = 2
+
+
Q Q Q Q
P P P P
E. The Variety of Demand Curves
To clearly show the di4erences between relatively elastic and relatively
inelastic demand curves, draw a graph showing a relatively Mat demand
curve and one showing a relatively steep demand curve. Show that any
given change in price will result in a larger change in quantity demanded
if the demand curve is relatively Mat. Use the same method when
discussing the shape of the supply curve later in the chapter.
1. Classi;cation of Elasticity
a. When the price elasticity of demand is greater than one, demand is de;ned to
be elastic.
b. When the price elasticity of demand is less than one, the demand is de;ned to
be inelastic.
c. When the price elasticity of demand is equal to one, the demand is said to
have unit elasticity.
© 2018 Cengage Learning®. May not be scanned, copied or duplicated, or posted to a publicly accessible website,
in whole or in part, except for use as permitted in a license distributed with a certain product or service or otherwise
on a password-protected website or school-approved learning management system for classroom use.
Figure 1

Chapter 5/Elasticity and Its Application ❖ 86
Activity 1—How the Ball Bounces
Type: In-class demonstration
Topics: Elastic, inelastic
Materials needed: One rubber ball and one “dead” ball. The “dead” ball is
made of shock-absorbing material and doesn’t bounce.
Museum stores and magic shops carry them.
Time: 1 minute
Class limitations: Works in any size class
Purpose
This quick, but memorable, demonstration can be used to introduce the concepts
of elastic and inelastic.
Instructions
2. In general, the Matter the demand curve that passes through a given point, the
more elastic the demand.
3. Extreme Cases
a. When the price elasticity of demand is equal to zero, the demand is perfectly
inelastic and is a vertical line.
b. When the price elasticity of demand is in;nite, the demand is perfectly elastic
and is a horizontal line.
Make sure that you provide several examples of goods with these types of
demand curves. You may want to point out that students will see the
perfectly elastic demand curve again when competitive ;rms are
© 2018 Cengage Learning®. May not be scanned, copied or duplicated, or posted to a publicly accessible website,
in whole or in part, except for use as permitted in a license distributed with a certain product or service or otherwise
on a password-protected website or school-approved learning management system for classroom use.

87 ❖ Chapter 5/Elasticity and Its Application
4. FYI: A Few Elasticities from the Real World
Activity 2—Ranking Elasticities
Type: In-class assignment
Topics: The determinants of price elasticity of demand
Materials needed: None
Time: 20 minutes
Class limitations: Works in any size class
Purpose
The intent of this exercise is to get students to think about varying degrees of
elasticity and the factors that determine demand elasticity.
Instructions
Give the students the following list of goods. Ask them to rank them from most to
least elastic.
1. beef
2. salt
3. European vacation
4. steak
5. new Honda Accord
© 2018 Cengage Learning®. May not be scanned, copied or duplicated, or posted to a publicly accessible website,
in whole or in part, except for use as permitted in a license distributed with a certain product or service or otherwise
on a password-protected website or school-approved learning management system for classroom use.
Chapter 5/Elasticity and Its Application ❖ 88
F. Total Revenue and the Price Elasticity of Demand
Figure 2
1. De;nition of total revenue: the amount paid by buyers and received by
sellers of a good, computed as the price of the good times the quantity
sold.
Another term for price times quantity is “total expenditure.” This term is
sometimes used in questions found in the study guide and test bank. It is
also important to point this out when discussing the market for illegal
Students ;nd the relationship between changes in total revenue and
elasticity diCcult to understand. It may take several thorough discussions
of this material before students will be able to master it.
2. If demand is inelastic, the percentage change in price will be greater than the
percentage change in quantity demanded.
Figure 3
a. If price rises, quantity demanded falls, and total revenue will rise (because the
increase in price will be larger than the decrease in quantity demanded).
b. If price falls, quantity demanded rises, and total revenue will fall (because the
fall in price will be larger than the increase in quantity demanded).
© 2018 Cengage Learning®. May not be scanned, copied or duplicated, or posted to a publicly accessible website,
in whole or in part, except for use as permitted in a license distributed with a certain product or service or otherwise
on a password-protected website or school-approved learning management system for classroom use.

89 ❖ Chapter 5/Elasticity and Its Application
3. If demand is elastic, the percentage change in quantity demanded will be greater
than the percentage change in price.
a. If price rises, quantity demanded falls, and total revenue will fall (because the
increase in price will be smaller than the decrease in quantity demanded).
b. If price falls, quantity demanded rises, and total revenue will rise (because the
fall in price will be smaller than the increase in quantity demanded).
4. If demand is unit elastic, the percentage change in price will be equal to the
percentage change in quantity demanded.
a. If price rises, quantity demanded falls, and total revenue will remain the same
(because the increase in price will be equal to the decrease in quantity
demanded).
b. If price falls, quantity demanded rises, and total revenue will remain the same
(because the fall in price will be equal to the increase in quantity demanded).
Point out the usefulness of elasticity from a business owner’s point of
view. Students should be able to see why a ;rm’s manager would want to
know the elasticity of demand for the ;rm’s products.
G. Elasticity and Total Revenue along a Linear Demand Curve
© 2018 Cengage Learning®. May not be scanned, copied or duplicated, or posted to a publicly accessible website,
in whole or in part, except for use as permitted in a license distributed with a certain product or service or otherwise
on a password-protected website or school-approved learning management system for classroom use.
Chapter 5/Elasticity and Its Application ❖ 90
Figure 4
1. The slope of a linear demand curve is constant, but the elasticity is not.
a. At points with a low price and a high quantity demanded, demand is inelastic.
b. At points with a high price and a low quantity demanded, demand is elastic.
2. Total revenue also varies at each point along the demand curve.
Note that when demand is elastic and price falls, total revenue rises. Also
point out that once demand is inelastic, any further decrease in price
results in a decrease in total revenue.
H. Other Demand Elasticities
1. De;nition of income elasticity of demand: a measure of how much the
quantity demanded of a good responds to a change in consumers’
income, computed as the percentage change in quantity demanded
divided by the percentage change in income.
© 2018 Cengage Learning®. May not be scanned, copied or duplicated, or posted to a publicly accessible website,
in whole or in part, except for use as permitted in a license distributed with a certain product or service or otherwise
on a password-protected website or school-approved learning management system for classroom use.

91 ❖ Chapter 5/Elasticity and Its Application
a. Formula
% change in quantity demanded
Income elasticity of demand = % change in income
b. Normal goods have positive income elasticities, while inferior goods have
negative income elasticities.
ALTERNATIVE CLASSROOM EXAMPLE:
John’s income rises from $20,000 to $22,000 and the quantity of hamburger he
buys each week falls from 2 pounds to 1 pound.
% change in quantity demanded = (1−2)/1.5 x 100 = -66.67%
% change in income = (22,000 −20,000)/21,000 x 100 = 9.52%
c. Necessities tend to have small income elasticities, while luxuries tend to have
large income elasticities.
2. De;nition of cross-price elasticity of demand: a measure of how much the
quantity demanded of one good responds to a change in the price of
another good, computed as the percentage change in the quantity
demanded of the 8rst good divided by the percentage change in the
price of the second good.
a. Formula
© 2018 Cengage Learning®. May not be scanned, copied or duplicated, or posted to a publicly accessible website,
in whole or in part, except for use as permitted in a license distributed with a certain product or service or otherwise
on a password-protected website or school-approved learning management system for classroom use.

Chapter 5/Elasticity and Its Application ❖ 92
% change in quantity demanded of good 1
Cross-price elasticity of demand = % change in price of good 2
b. Substitutes have positive cross-price elasticities, while complements have
negative cross-price elasticities.
ALTERNATIVE CLASSROOM EXAMPLE:
The price of apples rises from $1.00 per pound to $1.50 per pound. As a result,
the quantity of oranges demanded rises from 8,000 per week to 9,500.
% change in quantity of oranges demanded = (9,500 − 8,000)/8,750 x 100 =
17.14%
Make sure that you explain to students why the signs of the income
elasticity and the cross-price elasticity matter. This will undoubtedly lead
to some confusion because we ignore the sign of the own-price elasticity
of demand. You may want to put together a table to present this
II. The Elasticity of Supply
A. The Price Elasticity of Supply and Its Determinants
1. De;nition of price elasticity of supply: a measure of how much the
quantity supplied of a good responds to a change in the price of that
good, computed as the percentage change in quantity supplied divided
by the percentage change in price.
2. Determinants of the Price Elasticity of Supply
© 2018 Cengage Learning®. May not be scanned, copied or duplicated, or posted to a publicly accessible website,
in whole or in part, except for use as permitted in a license distributed with a certain product or service or otherwise
on a password-protected website or school-approved learning management system for classroom use.
93 ❖ Chapter 5/Elasticity and Its Application
a. Flexibility of sellers: goods that are somewhat ;xed in supply (beachfront
property) have inelastic supplies.
b. Time horizon: supply is usually more inelastic in the short run than in the long
run.
B. Computing the Price Elasticity of Supply
1. Formula
% change in quantity supplied
Price elasticity of supply = % change in price
2. Example: the price of milk increases from $2.85 per gallon to $3.15 per gallon
and the quantity supplied rises from 9,000 to 11,000 gallons per month.
% change in price = (3.15 – 2.85)/3.00 × 100 = 10%
% change in quantity supplied = (11,000 – 9,000)/10,000 × 100 = 20%
Price elasticity of supply = (20%)/(10%) = 2
C. The Variety of Supply Curves
Figure 5
1. In general, the Matter the supply curve that passes through a given point, the
more elastic the supply.
© 2018 Cengage Learning®. May not be scanned, copied or duplicated, or posted to a publicly accessible website,
in whole or in part, except for use as permitted in a license distributed with a certain product or service or otherwise
on a password-protected website or school-approved learning management system for classroom use.

Chapter 5/Elasticity and Its Application ❖ 94
2. Extreme Cases
a. When the elasticity is equal to zero, the supply is said to be perfectly inelastic
and is a vertical line.
b. When the elasticity is in;nite, the supply is said to be perfectly elastic and is a
horizontal line.
3. Because ;rms often have a maximum capacity for production, the elasticity of
supply may be very high at low levels of quantity supplied and very low at high
levels of quantity supplied.
Figure 6
Again, you may want to present several examples of goods that may have
supply curves like these.
III. Three Applications of Supply, Demand, and Elasticity
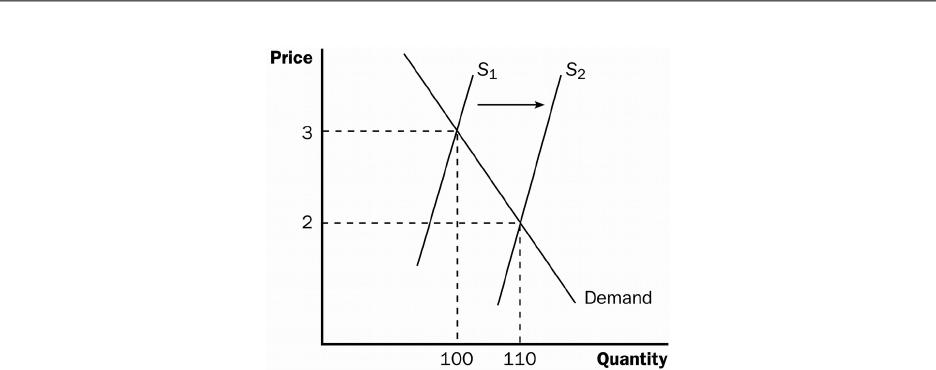
A. Can Good News for Farming Be Bad News for Farmers?
Figure 7
© 2018 Cengage Learning®. May not be scanned, copied or duplicated, or posted to a publicly accessible website,
in whole or in part, except for use as permitted in a license distributed with a certain product or service or otherwise
on a password-protected website or school-approved learning management system for classroom use.
95 ❖ Chapter 5/Elasticity and Its Application
1. A new hybrid of wheat is developed that is more productive than those used in
the past. What happens?
2. Supply increases, price falls, and quantity demanded rises.
3. If demand is inelastic, the fall in price is greater than the increase in quantity
demanded and total revenue falls.
4. If demand is elastic, the fall in price is smaller than the rise in quantity demanded
and total revenue rises.
5. In practice, the demand for basic foodstu4s (like wheat) is usually inelastic.
a. This means less revenue for farmers.
b. Because farmers are price takers, they still have the incentive to adopt the
new hybrid so that they can produce and sell more wheat.
c. This may help explain why the number of farms has declined so dramatically
over the past two centuries.
© 2018 Cengage Learning®. May not be scanned, copied or duplicated, or posted to a publicly accessible website,
in whole or in part, except for use as permitted in a license distributed with a certain product or service or otherwise
on a password-protected website or school-approved learning management system for classroom use.

Chapter 5/Elasticity and Its Application ❖ 96
d. This may also explain why some government policies encourage farmers to
decrease the amount of crops planted.
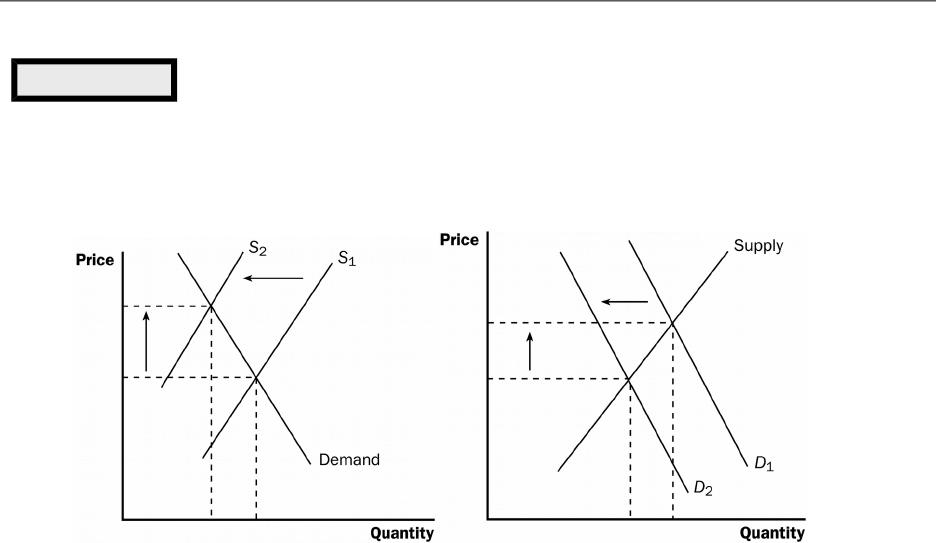
B. Why Did OPEC Fail to Keep the Price of Oil High?
© 2018 Cengage Learning®. May not be scanned, copied or duplicated, or posted to a publicly accessible website,
in whole or in part, except for use as permitted in a license distributed with a certain product or service or otherwise
on a password-protected website or school-approved learning management system for classroom use.
97 ❖ Chapter 5/Elasticity and Its Application
Figure 8
1. In the 1970s and 1980s, OPEC reduced the amount of oil it was willing to supply
to world markets. The decrease in supply led to an increase in the price of oil and
a decrease in quantity demanded. The increase in price was much larger in the
short run than the long run. Why?
2. The demand and supply of oil are much more inelastic in the short run than the
long run. The demand is more elastic in the long run because consumers can
adjust to the higher price of oil by carpooling or buying a vehicle that gets better
mileage. The supply is more elastic in the long run because non-OPEC producers
will respond to the higher price of oil by producing more.
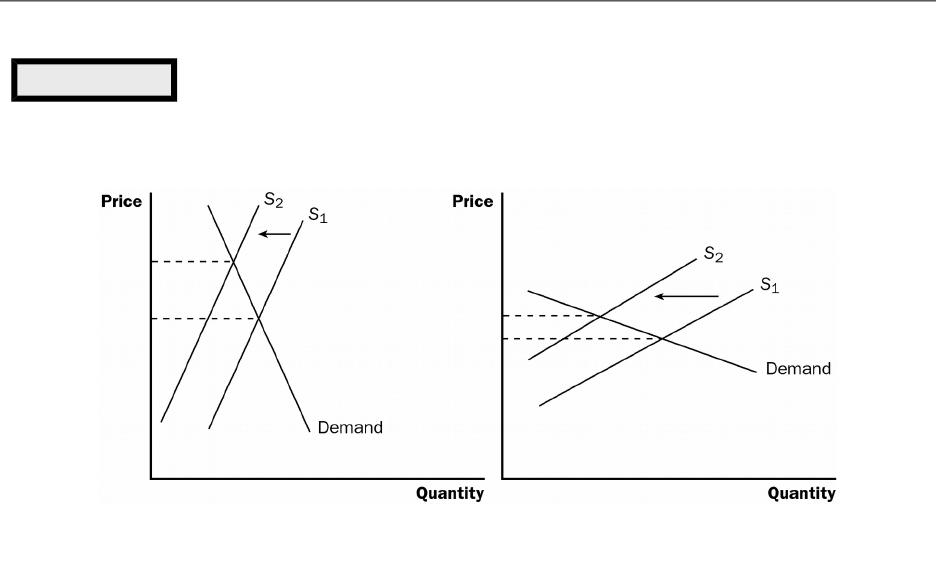
C. Does Drug Interdiction Increase or Decrease Drug-Related Crime?
1. The federal government increases the number of federal agents devoted to the
war on drugs. What happens?
a. The supply of drugs decreases, which raises the price and leads to a reduction
in quantity demanded. If demand is inelastic, total expenditure on drugs
(equal to total revenue) will increase. If demand is elastic, total expenditure
will fall.
© 2018 Cengage Learning®. May not be scanned, copied or duplicated, or posted to a publicly accessible website,
in whole or in part, except for use as permitted in a license distributed with a certain product or service or otherwise
on a password-protected website or school-approved learning management system for classroom use.
Short
Run
Long
Run

Chapter 5/Elasticity and Its Application ❖ 98
b. Thus, because the demand for drugs is likely to be inelastic, drug-related
crime may rise.
2. What happens if the government instead pursued a policy of drug education?
a. The demand for drugs decreases, which lowers price and quantity supplied.
Total expenditure must fall (because both price and quantity fall).
b. Thus, drug education should not increase drug-related crime.
© 2018 Cengage Learning®. May not be scanned, copied or duplicated, or posted to a publicly accessible website,
in whole or in part, except for use as permitted in a license distributed with a certain product or service or otherwise
on a password-protected website or school-approved learning management system for classroom use.
99 ❖ Chapter 5/Elasticity and Its Application
Figure 9
© 2018 Cengage Learning®. May not be scanned, copied or duplicated, or posted to a publicly accessible website,
in whole or in part, except for use as permitted in a license distributed with a certain product or service or otherwise
on a password-protected website or school-approved learning management system for classroom use.
(a) Drug Interdiction (b) Drug Education