SOLUTIONS TO TEXT PROBLEMS:
Quick Quizzes
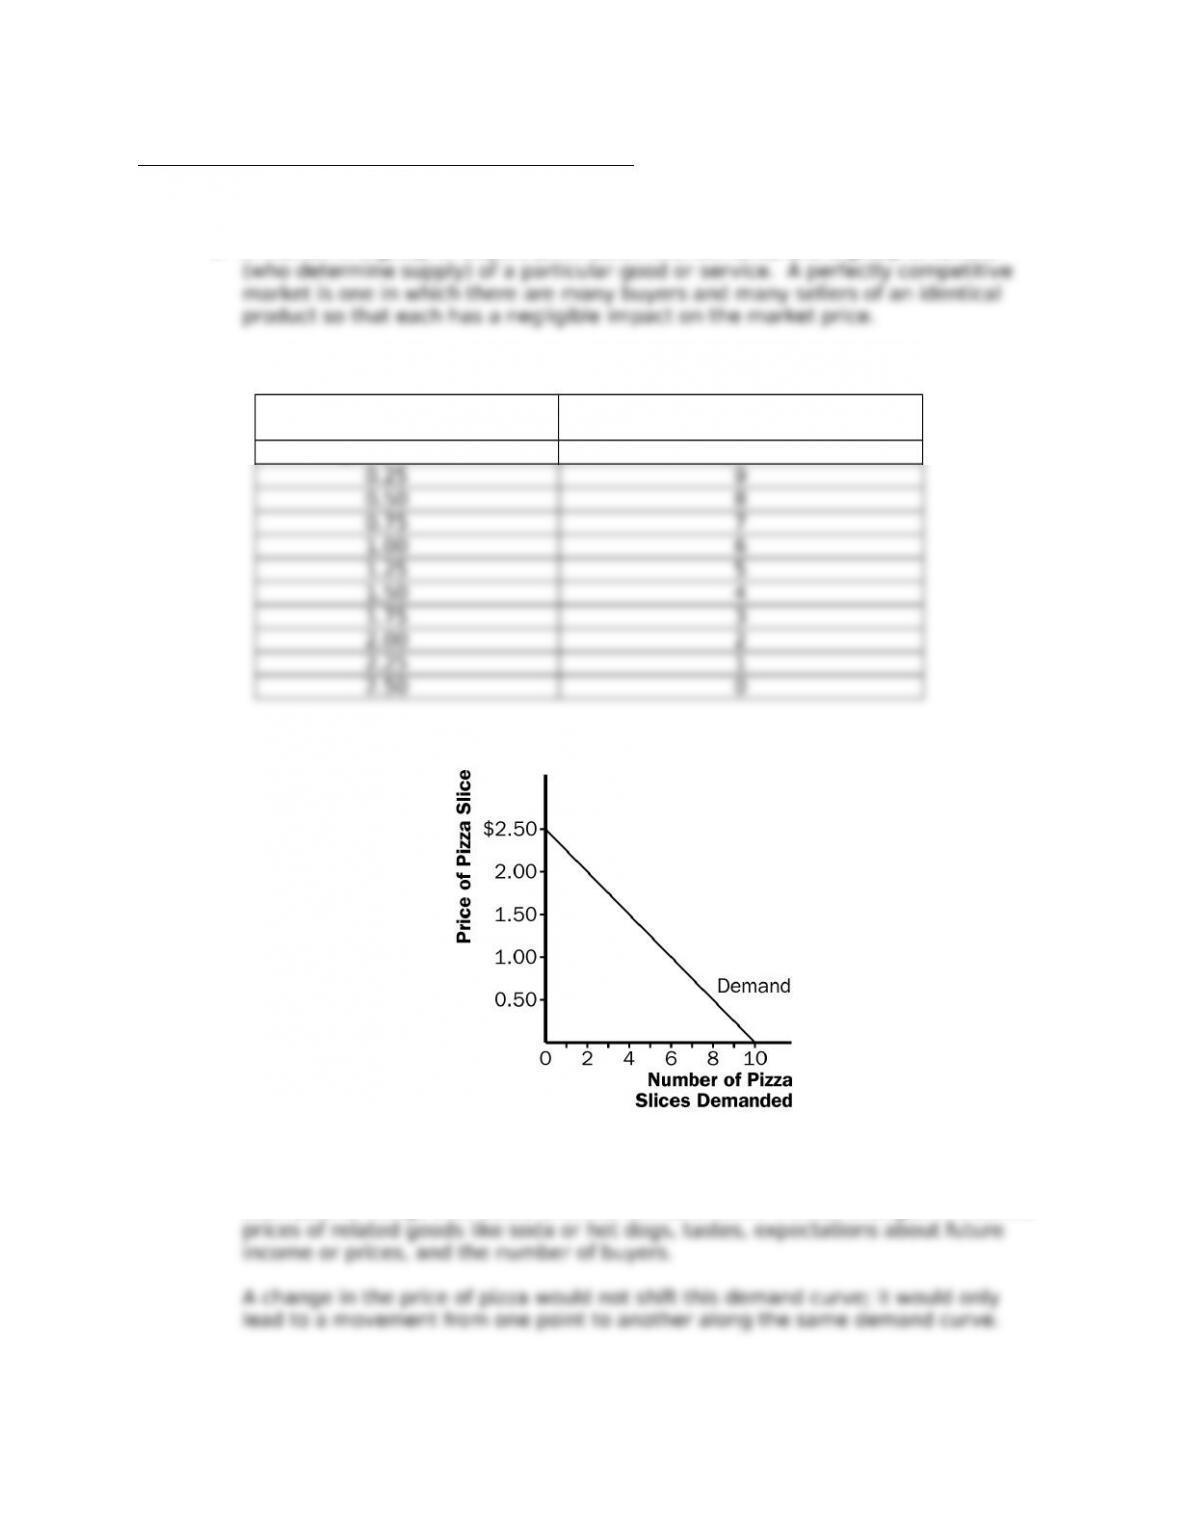
1. A market is a group of buyers (who determine demand) and a group of sellers
2. Here is an example of a monthly demand schedule for pizza:
Price of Pizza Slice Number of Pizza Slices
Demanded
$ 0.00 10
The demand curve is graphed in Figure 1.
Figure 1
Examples of things that would shift the demand curve include changes in income,
48
© 2018 Cengage Learning®. May not be scanned, copied or duplicated, or posted to a publicly accessible website,
in whole or in part, except for use as permitted in a license distributed with a certain product or service or otherwise
on a password-protected website or school-approved learning management system for classroom use.
Chapter 4/The Market Forces of Supply and Demand ❖ 49
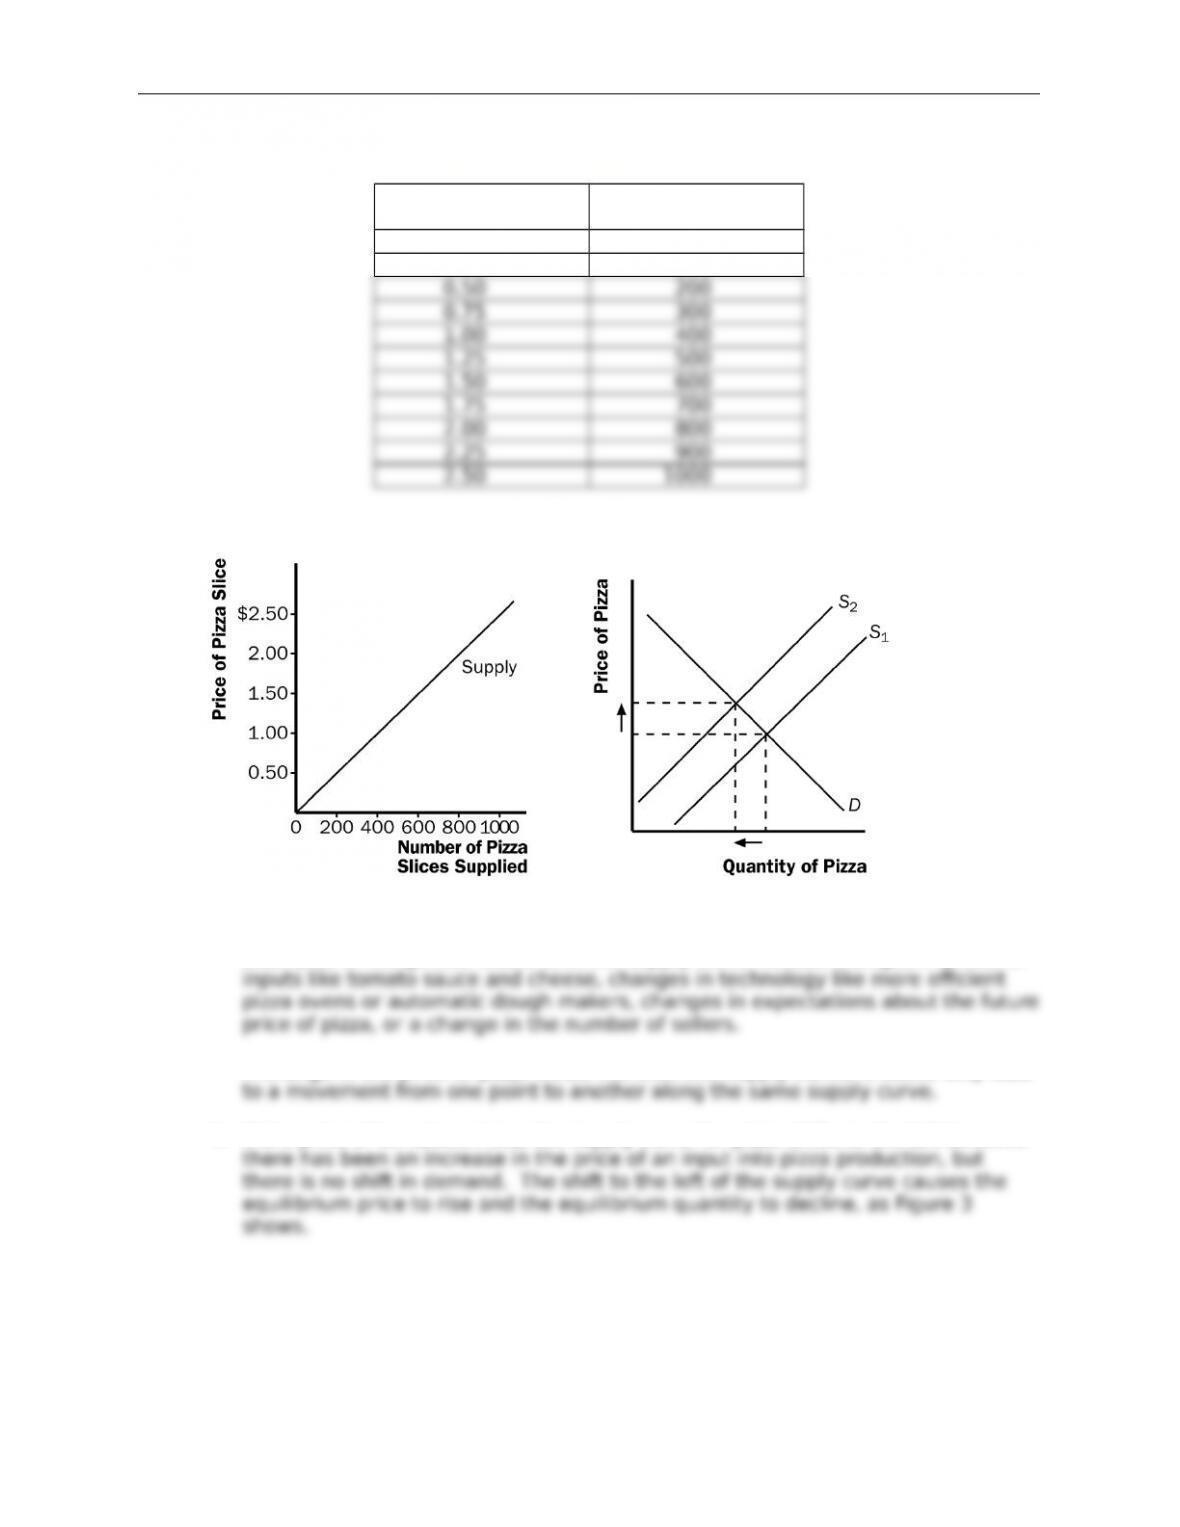
3. Here is an example of a monthly supply schedule for pizza:
Price of Pizza
Slice
Number of Pizza
Slices Supplied
$ 0.00 0
0.25 100
The supply curve is graphed in Figure 2.
Figure 2 Figure 3
Examples of things that would shift the supply curve include changes in prices of
A change in the price of pizza would not shift this supply curve; it would only lead
4. If the price of tomatoes rises, the supply curve for pizza shifts to the left because
© 2018 Cengage Learning®. May not be scanned, copied or duplicated, or posted to a publicly accessible website,
in whole or in part, except for use as permitted in a license distributed with a certain product or service or otherwise
on a password-protected website or school-approved learning management system for classroom use.
Chapter 4/The Market Forces of Supply and Demand ❖ 50
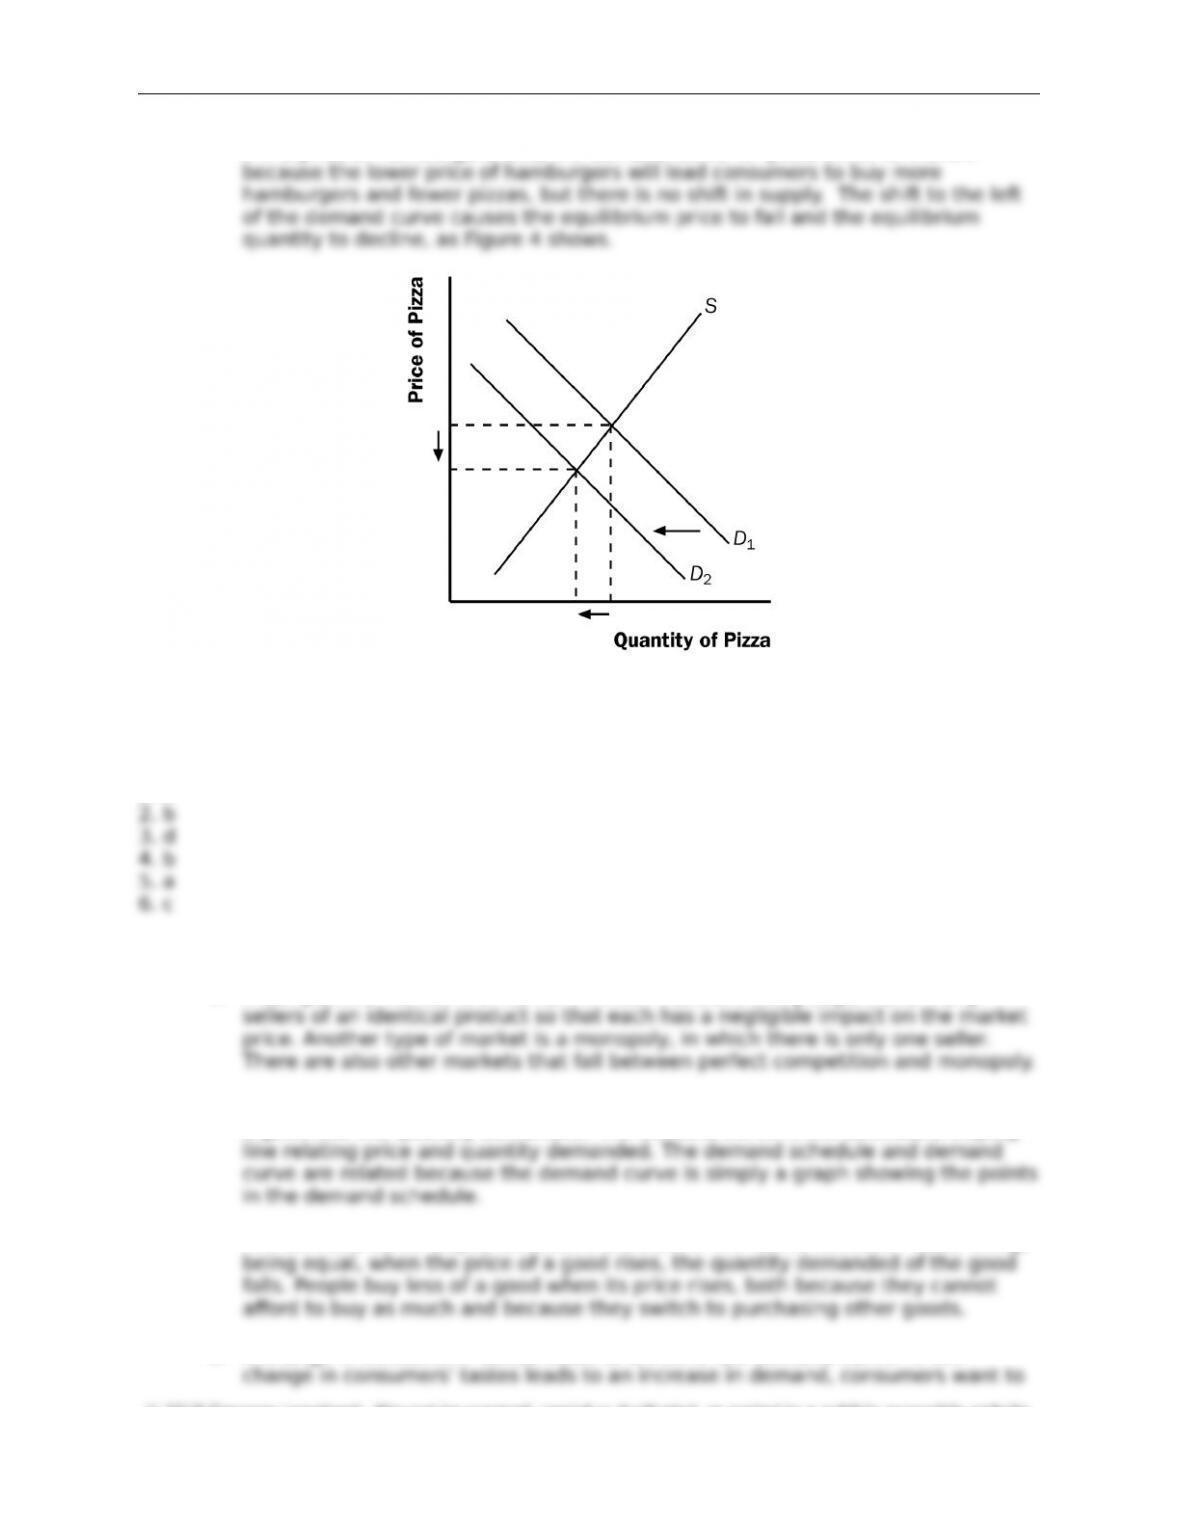
If the price of hamburgers falls, the demand curve for pizza shifts to the left
Figure 4
Chapter Quick Quiz
1. b
Questions for Review
1. A competitive market is a market in which there are many buyers and many
2. The demand schedule is a table that shows the relationship between the price of
a good and the quantity demanded. The demand curve is the downward-sloping
The demand curve slopes downward because of the law of demand—other things
3. A change in consumers’ tastes leads to a shift of the demand curve. If the
© 2018 Cengage Learning®. May not be scanned, copied or duplicated, or posted to a publicly accessible website,
in whole or in part, except for use as permitted in a license distributed with a certain product or service or otherwise
on a password-protected website or school-approved learning management system for classroom use.
Chapter 4/The Market Forces of Supply and Demand ❖ 51
4. Because Harry buys more pumpkin juice when his income falls, pumpkin juice is
5. A supply schedule is a table showing the relationship between the price of a good
and the quantity a producer is willing and able to supply. The supply curve is the
6. A change in producers’ technology leads to a shift in the supply curve. A change
7. The equilibrium of a market is the point at which the quantity demanded is equal
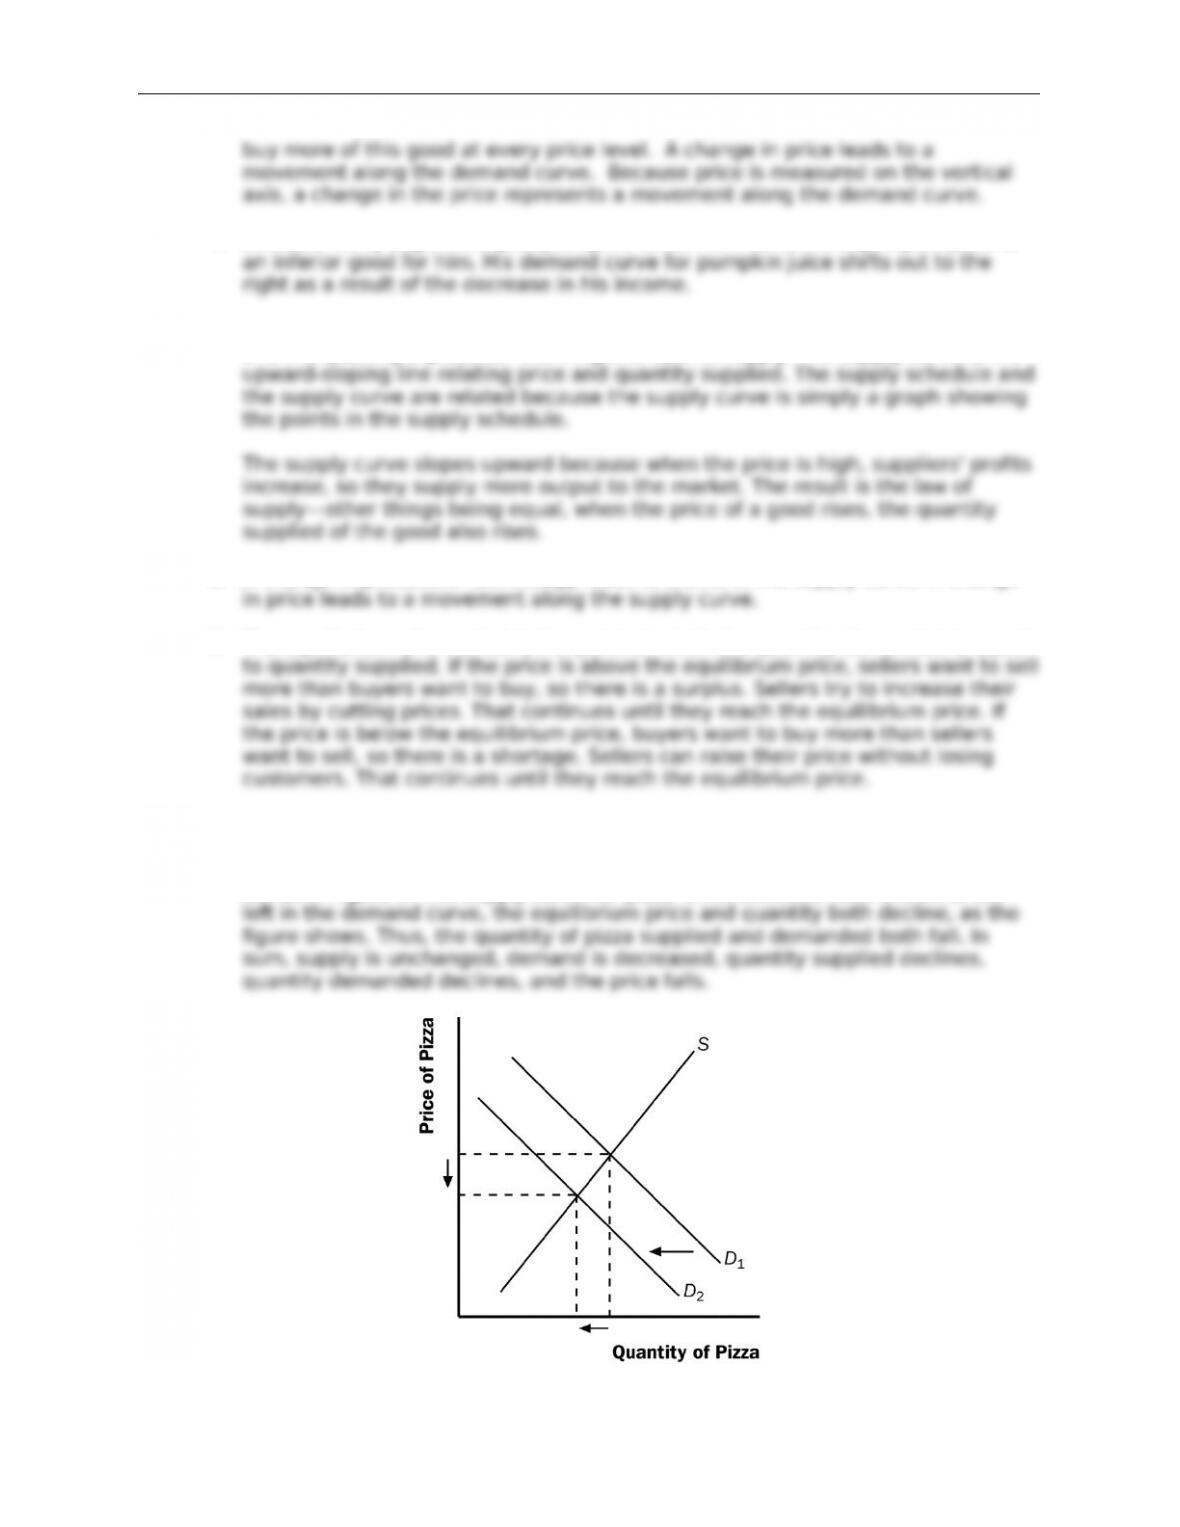
8. When the price of beer rises, the demand for pizza declines, because beer and
pizza are complements and people want to buy less beer. When we say the
demand for pizza declines, we mean that the demand curve for pizza shifts to the
left as in Figure 5. The supply curve for pizza is not a@ected. With a shift to the
© 2018 Cengage Learning®. May not be scanned, copied or duplicated, or posted to a publicly accessible website,
in whole or in part, except for use as permitted in a license distributed with a certain product or service or otherwise
on a password-protected website or school-approved learning management system for classroom use.
Chapter 4/The Market Forces of Supply and Demand ❖ 52
Figure 5
9. Prices play a vital role in market economies because they bring markets into
equilibrium. If the price is di@erent from its equilibrium level, quantity supplied
Problems and Applications
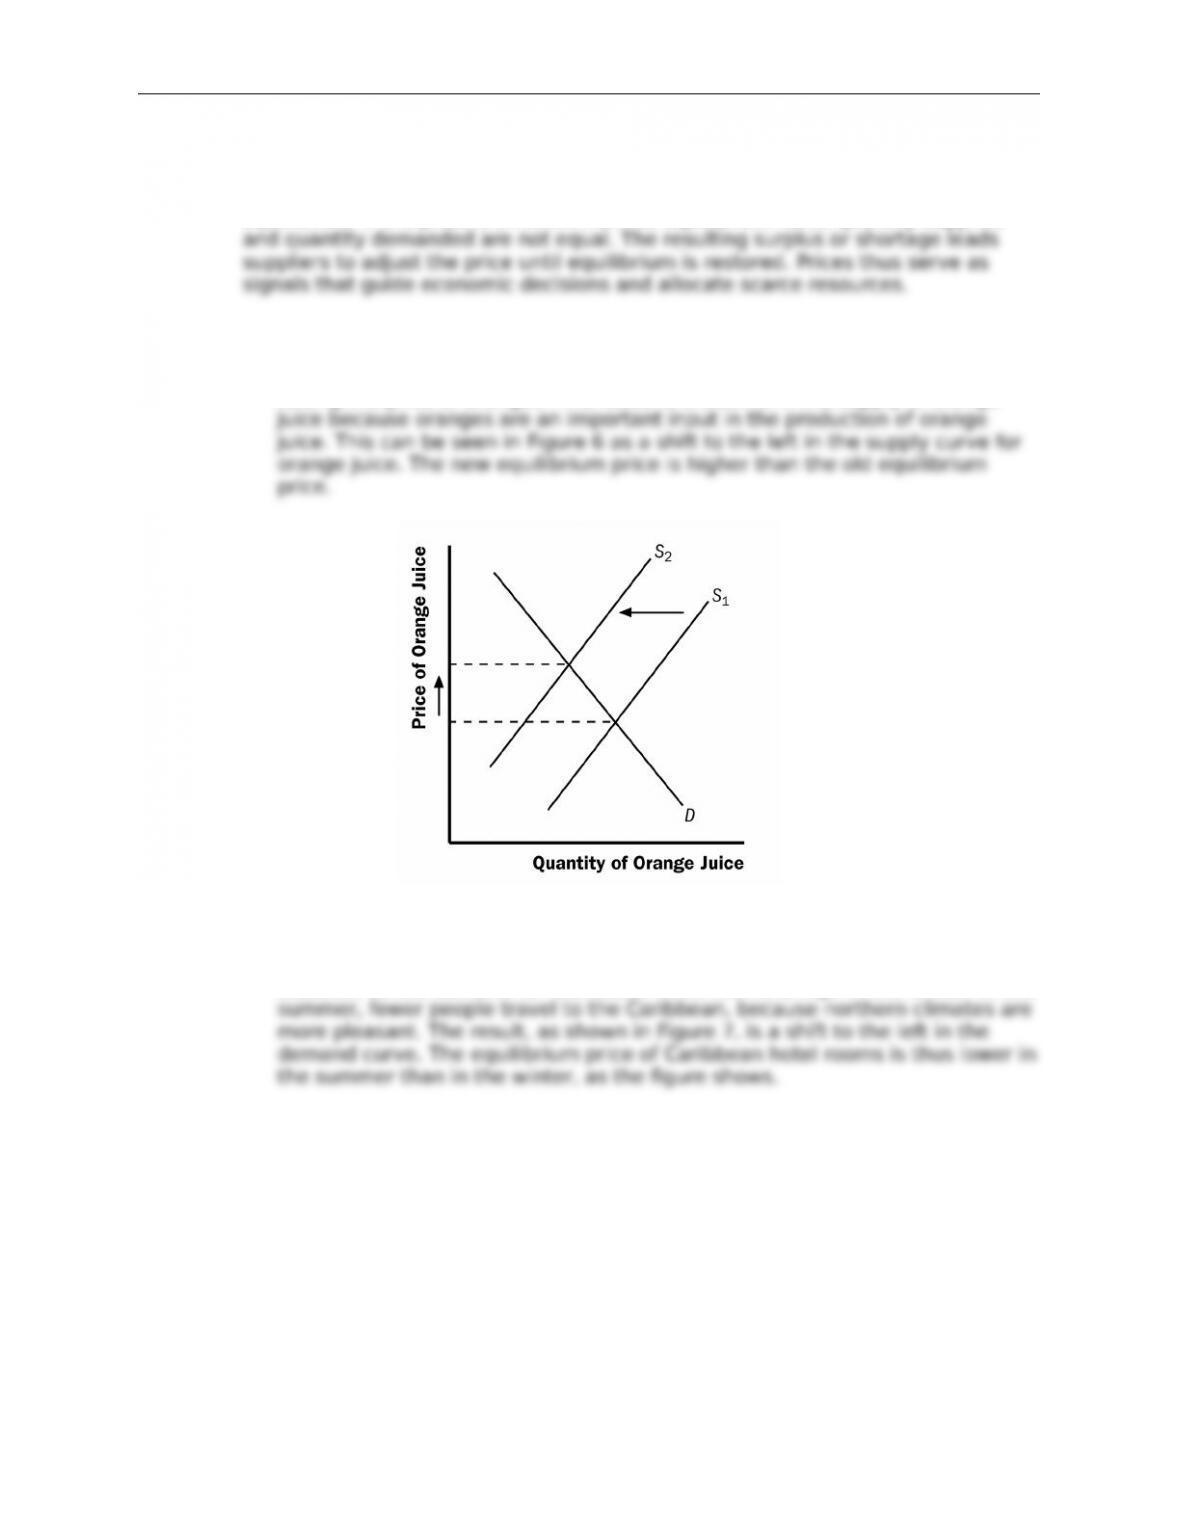
1. a. Cold weather damages the orange crop, reducing the supply of oranges and
raising the price of oranges. This leads to a decline in the supply of orange
Figure 6
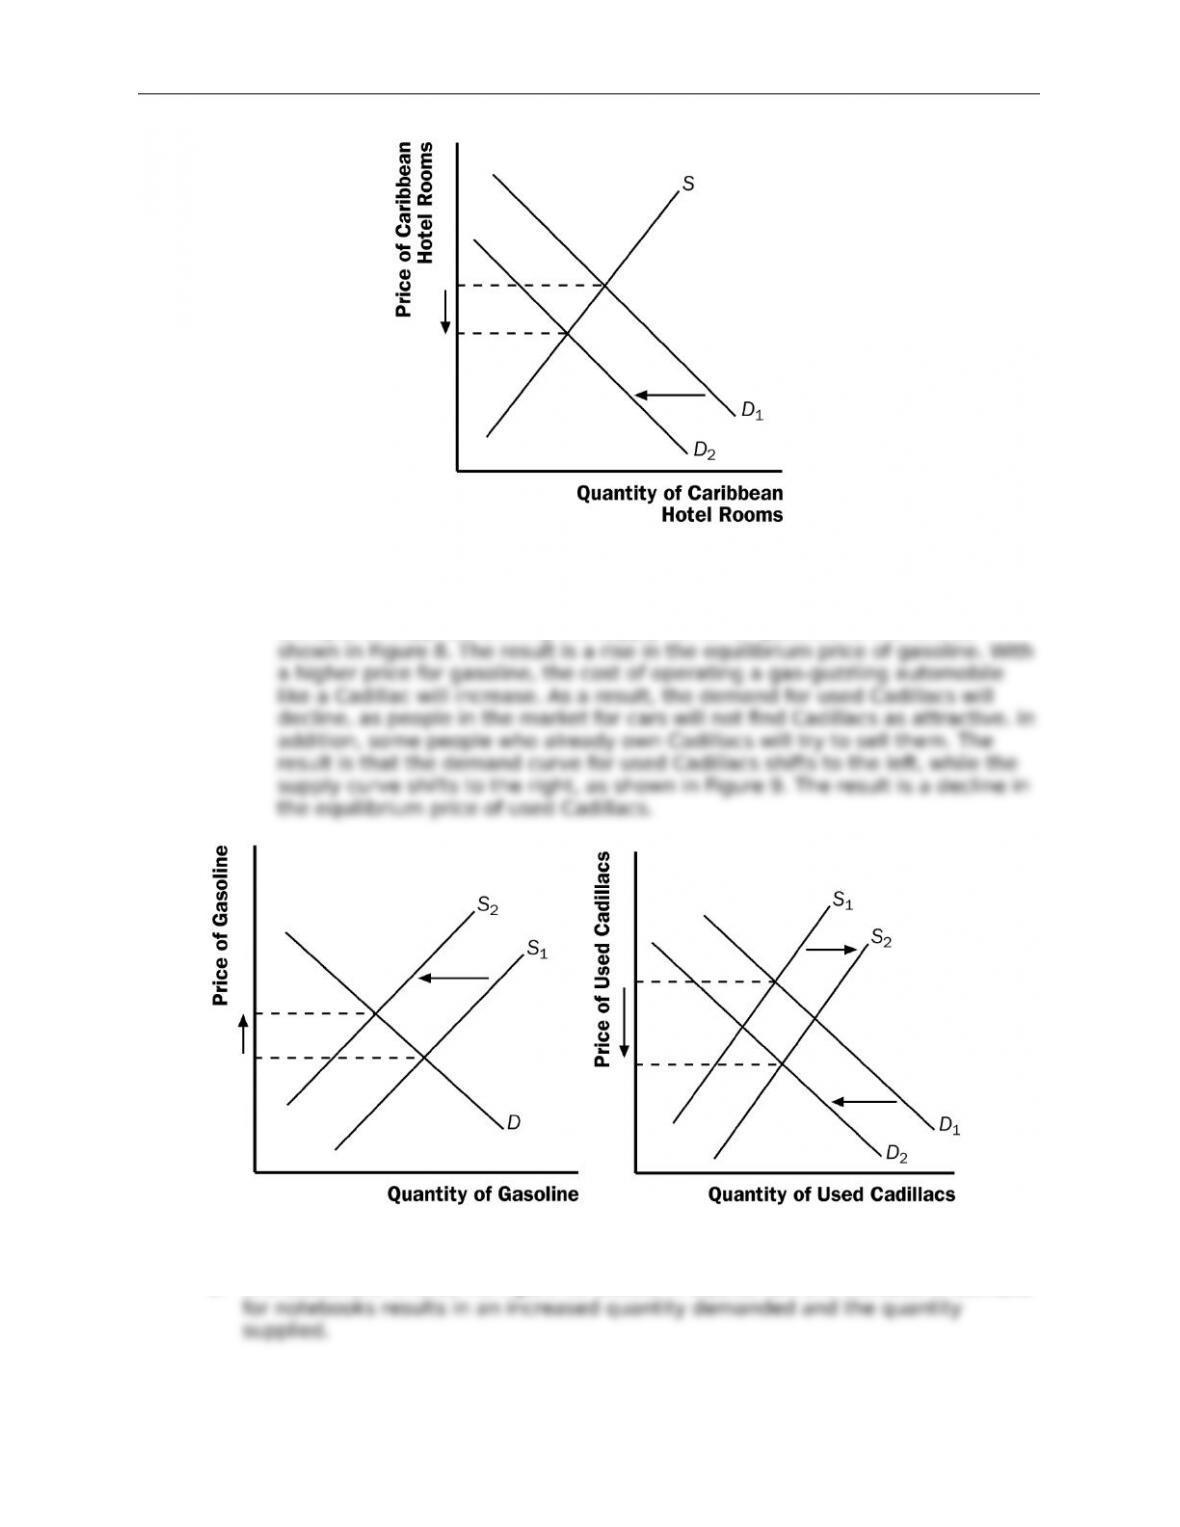
b. People often travel to the Caribbean from New England to escape cold
weather, so the demand for Caribbean hotel rooms is high in the winter. In the
© 2018 Cengage Learning®. May not be scanned, copied or duplicated, or posted to a publicly accessible website,
in whole or in part, except for use as permitted in a license distributed with a certain product or service or otherwise
on a password-protected website or school-approved learning management system for classroom use.
Chapter 4/The Market Forces of Supply and Demand ❖ 53
Figure 7
c. When a war breaks out in the Middle East, many markets are a@ected.
Because a large proportion of oil production takes place there, the war
disrupts oil supplies, shifting the supply curve for gasoline to the left, as
Figure 8 Figure 9
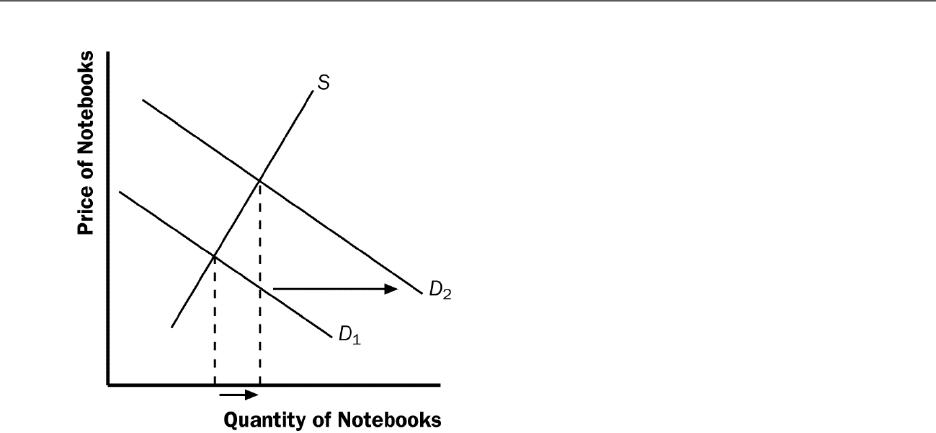
2. The statement is false. As Figure 10 shows, in equilibrium the increase in demand
© 2018 Cengage Learning®. May not be scanned, copied or duplicated, or posted to a publicly accessible website,
in whole or in part, except for use as permitted in a license distributed with a certain product or service or otherwise
on a password-protected website or school-approved learning management system for classroom use.
Chapter 4/The Market Forces of Supply and Demand ❖ 54
Figure 10 Figure 11
© 2018 Cengage Learning®. May not be scanned, copied or duplicated, or posted to a publicly accessible website,
in whole or in part, except for use as permitted in a license distributed with a certain product or service or otherwise
on a password-protected website or school-approved learning management system for classroom use.
Chapter 4/The Market Forces of Supply and Demand ❖ 55
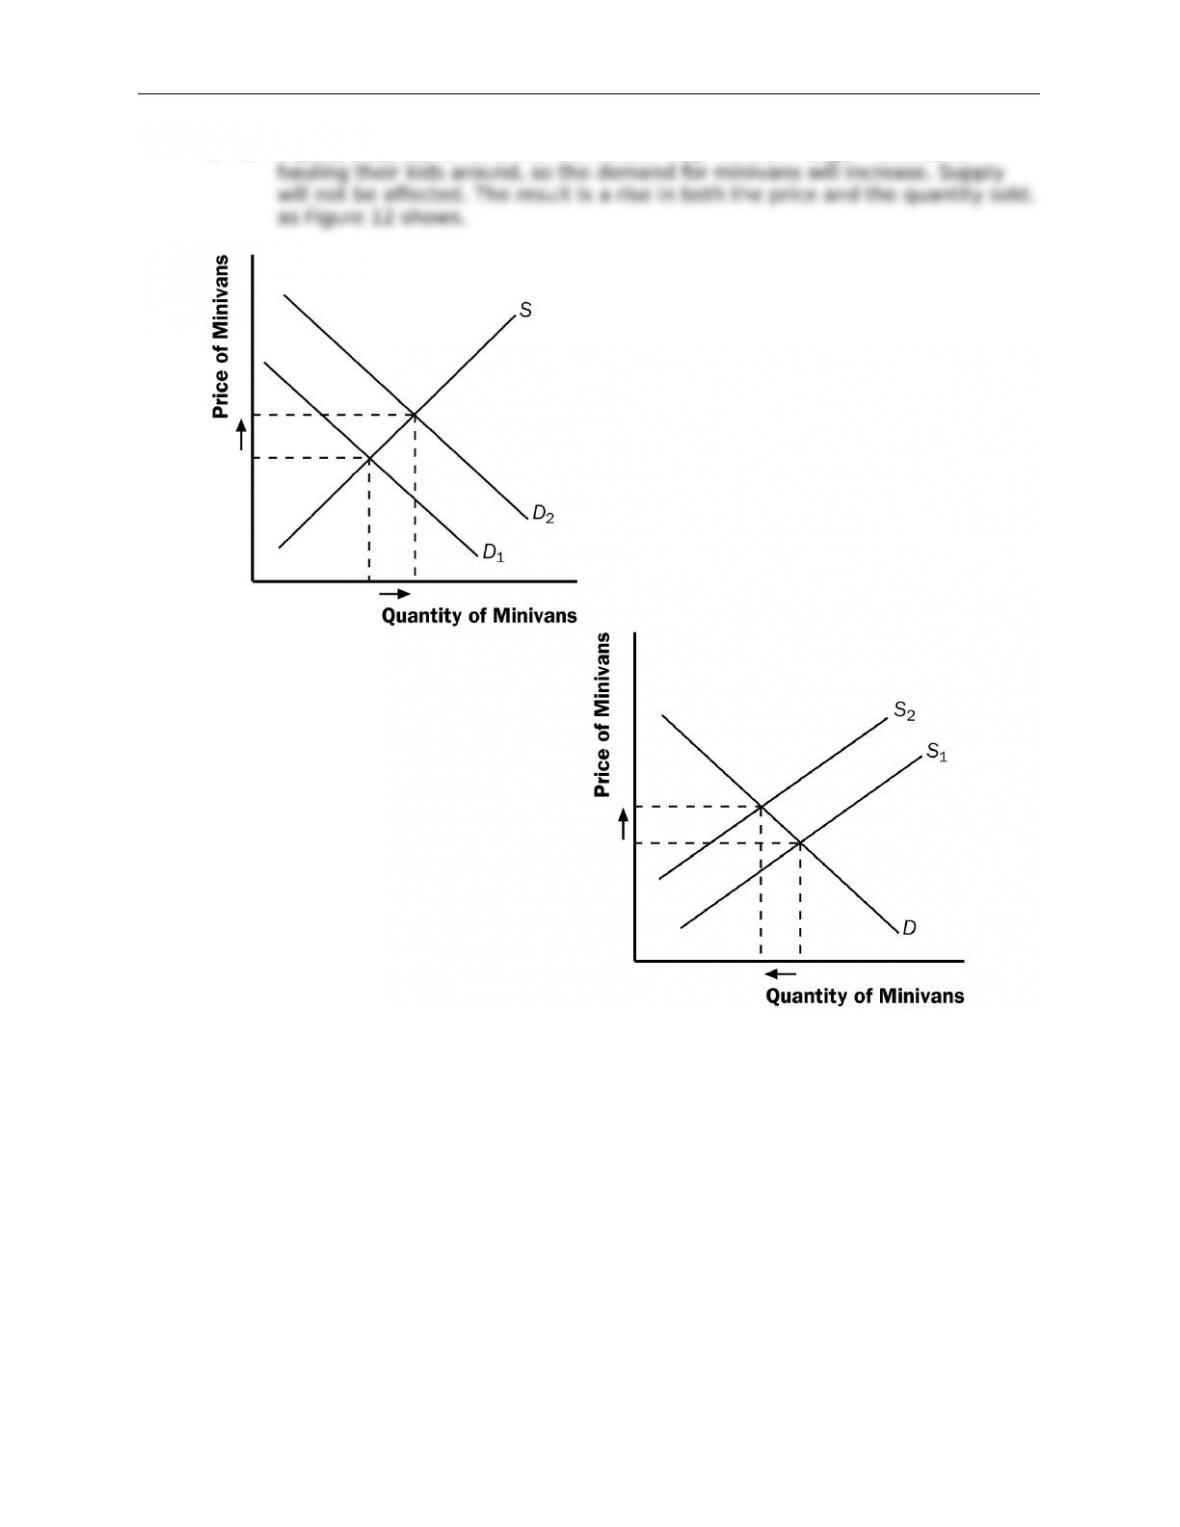
3. a. If people decide to have more children, they will want larger vehicles for
Figure 12 Figure 13
© 2018 Cengage Learning®. May not be scanned, copied or duplicated, or posted to a publicly accessible website,
in whole or in part, except for use as permitted in a license distributed with a certain product or service or otherwise
on a password-protected website or school-approved learning management system for classroom use.
Chapter 4/The Market Forces of Supply and Demand ❖ 56
b. If a strike by steelworkers raises steel prices, the cost of producing a minivan
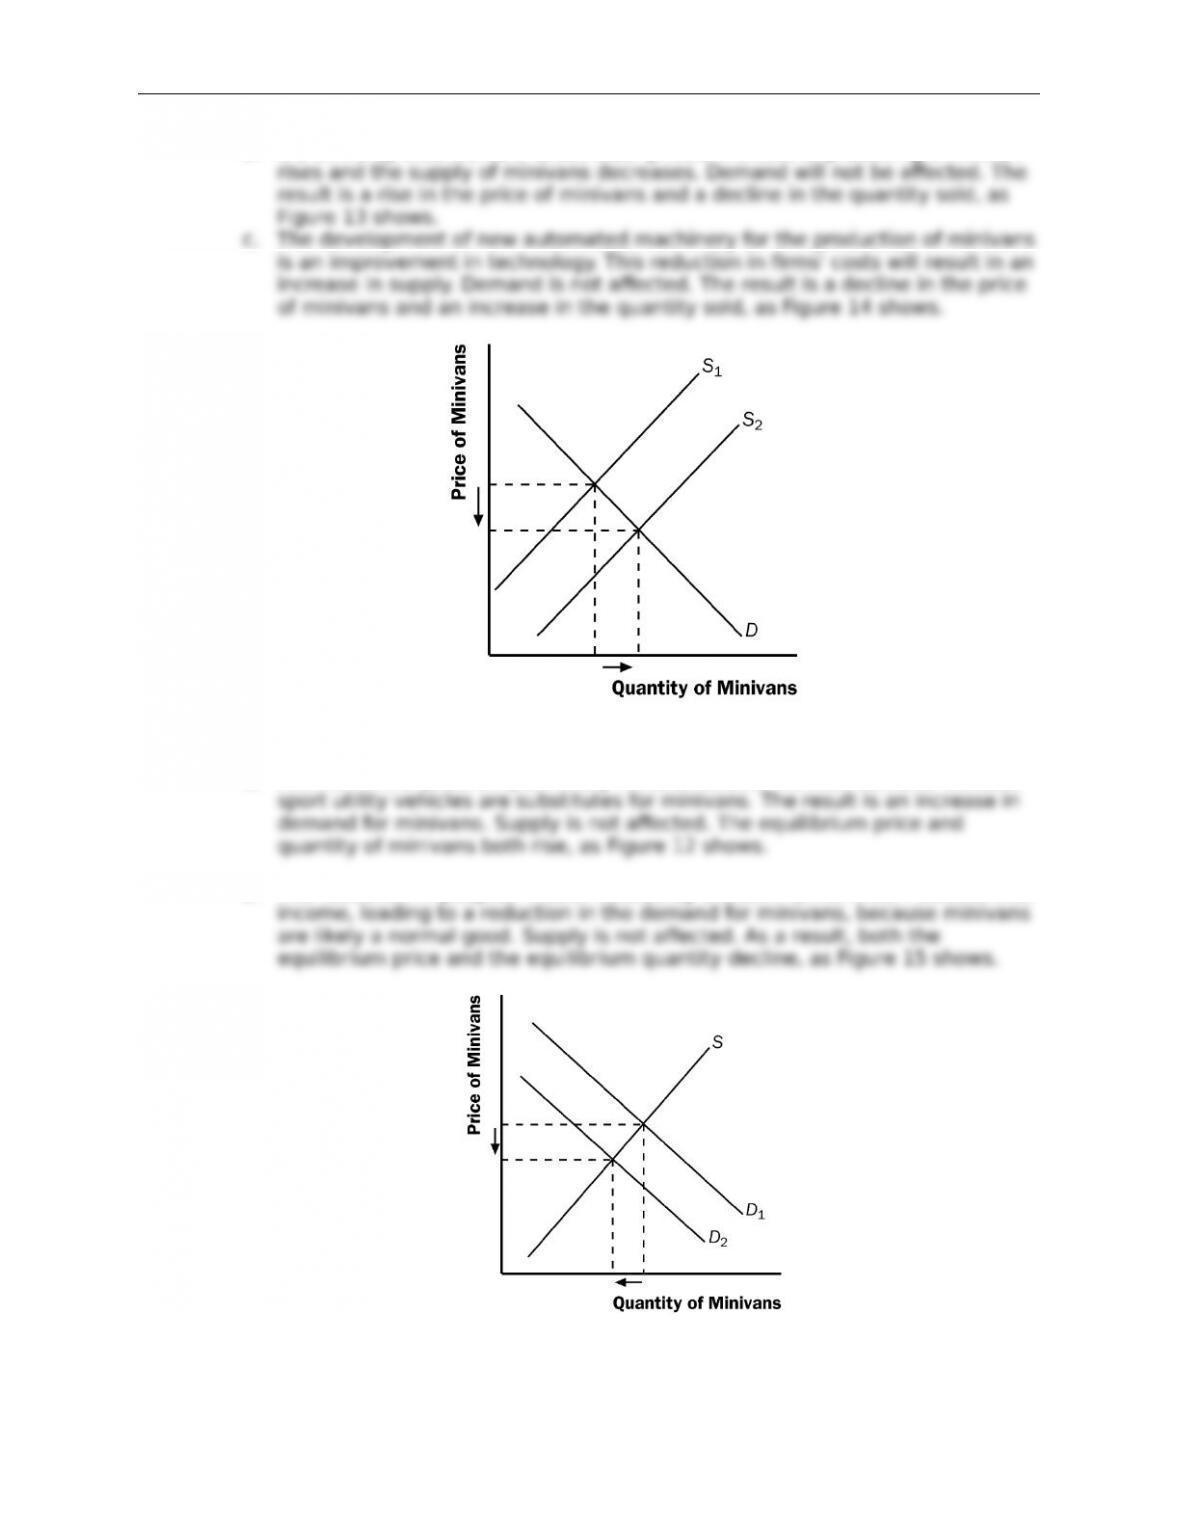
c. The development of new automated machinery for the production of minivans
Figure 14
d. The rise in the price of sport utility vehicles a@ects minivan demand because
e. The reduction in peoples’ wealth caused by a stock-market crash reduces their
Figure 15
© 2018 Cengage Learning®. May not be scanned, copied or duplicated, or posted to a publicly accessible website,
in whole or in part, except for use as permitted in a license distributed with a certain product or service or otherwise
on a password-protected website or school-approved learning management system for classroom use.

Chapter 4/The Market Forces of Supply and Demand ❖ 57
© 2018 Cengage Learning®. May not be scanned, copied or duplicated, or posted to a publicly accessible website,
in whole or in part, except for use as permitted in a license distributed with a certain product or service or otherwise
on a password-protected website or school-approved learning management system for classroom use.