WHAT’S NEW IN THE EIGHTH EDITION:
There is a new Ask the Experts feature on “Price Gouging.”
LEARNING OBJECTIVES:
By the end of this chapter, students should understand:
what a competitive market is.
what determines the demand for a good in a competitive market.
what determines the supply of a good in a competitive market.
how supply and demand together set the price of a good and the quantity sold.
48
© 2018 Cengage Learning®. May not be scanned, copied or duplicated, or posted to a publicly accessible website,
in whole or in part, except for use as permitted in a license distributed with a certain product or service or otherwise
on a password-protected website or school-approved learning management system for classroom use.
4THE MARKET FORCES OF
SUPPLY AND DEMAND

49 ❖ Chapter 4/The Market Forces of Supply and Demand
the key role of prices in allocating scarce resources in market economies.
CONTEXT AND PURPOSE:
Chapter 4 is the =rst chapter in a three-chapter sequence that deals with supply and
demand and how markets work. Chapter 4 shows how supply and demand for a good
determines both the quantity produced and the price at which the good sells. Chapter 5 will
add precision to the discussion of supply and demand by addressing the concept of elasticity
—the sensitivity of the quantity supplied and quantity demanded to changes in economic
variables. Chapter 6 will address the impact of government policies on prices and quantities
in markets.
The purpose of Chapter 4 is to establish the model of supply and demand. The model of
supply and demand is the foundation for the discussion for the remainder of this text. For
this reason, time spent studying the concepts in this chapter will return bene=ts to your
students throughout their study of economics. Many instructors would argue that this
chapter is the most important chapter in the text.
KEY POINTS:
Economists use the model of supply and demand to analyze competitive markets. In a
competitive market, there are many buyers and sellers, each of whom has little or no
inCuence on the market price.
The demand curve shows how the quantity of a good demanded depends on the price.
According to the law of demand, as the price of a good falls, the quantity demanded
rises. Therefore, the demand curve slopes downward.
In addition to price, other determinants of how much consumers want to buy include
income, the prices of substitutes and complements, tastes, expectations, and the
number of buyers. If one of these factors changes, the demand curve shifts.
© 2018 Cengage Learning®. May not be scanned, copied or duplicated, or posted to a publicly accessible website,
in whole or in part, except for use as permitted in a license distributed with a certain product or service or otherwise
on a password-protected website or school-approved learning management system for classroom use.

Chapter 4/The Market Forces of Supply and Demand ❖ 50
The supply curve shows how the quantity of a good supplied depends on the price.
According to the law of supply, as the price of a good rises, the quantity supplied rises.
Therefore, the supply curve slopes upward.
In addition to price, other determinants of how much producers want to sell include input
prices, technology, expectations, and the number of sellers. If one of these factors
changes, the supply curve shifts.
The intersection of the supply and demand curves determines the market equilibrium. At
the equilibrium price, the quantity demanded equals the quantity supplied.
The behavior of buyers and sellers naturally drives markets toward their equilibrium.
When the market price is above the equilibrium price, there is a surplus of the good,
which causes the market price to fall. When the market price is below the equilibrium
price, there is a shortage, which causes the market price to rise.
To analyze how any event inCuences a market, we use the supply-and-demand diagram
to examine how the event aEects equilibrium price and quantity. To do this we follow
three steps. First, we decide whether the event shifts the supply curve or the demand
curve (or both). Second, we decide which direction the curve shifts. Third, we compare
the new equilibrium with the initial equilibrium.
In market economies, prices are the signals that guide economic decisions and thereby
allocate scarce resources. For every good in the economy, the price ensures that supply
and demand are in balance. The equilibrium price then determines how much of the
good buyers choose to consume and how much sellers choose to produce.
© 2018 Cengage Learning®. May not be scanned, copied or duplicated, or posted to a publicly accessible website,
in whole or in part, except for use as permitted in a license distributed with a certain product or service or otherwise
on a password-protected website or school-approved learning management system for classroom use.
51 ❖ Chapter 4/The Market Forces of Supply and Demand
CHAPTER OUTLINE:
I. Markets and Competition
You may want to provide students with examples of markets other than
the traditional retail store or the stock market. These include the online
advertising sites such as eBay and Craigslist, the college “career services”
department through which they can look for employment upon
graduation, or the market for illegal drugs on a college campus. Be sure to
list the good or service being sold, the buyers, and the sellers in each
A. What Is a Market?
1. De=nition of market: a group of buyers and sellers of a particular good or
service.
2. Markets can take many forms and may be organized (agricultural commodities) or
less organized (ice cream).
B. What Is Competition?
1. De=nition of competitive market: a market in which there are so many
buyers and so many sellers that each has a negligible impact on the
market price.
2. Each buyer knows that there are several sellers from which to choose. Sellers
know that each buyer purchases only a small amount of the total amount sold.
Students may =nd the name for this type of market misleading. You will
have to point out that =rms in a competitive market do not face
head-to-head rivalry as in sports competitions.
© 2018 Cengage Learning®. May not be scanned, copied or duplicated, or posted to a publicly accessible website,
in whole or in part, except for use as permitted in a license distributed with a certain product or service or otherwise
on a password-protected website or school-approved learning management system for classroom use.

Chapter 4/The Market Forces of Supply and Demand ❖ 52
C. In this chapter, we will assume that markets are perfectly competitive.
1. Characteristics of a perfectly competitive market:
a. The goods being oEered for sale are exactly the same.
b. The buyers and sellers are so numerous that no single buyer or seller has any
inCuence over the market price.
2. Because buyers and sellers must accept the market price as given, they are often
called “price takers.”
3. Not all goods are sold in a perfectly competitive market.
a. A market with only one seller is called a monopoly market.
b. Other markets fall between perfect competition and monopoly.
D. We will start by studying perfect competition.
1. Perfectly competitive markets are the easiest to analyze because buyers and
sellers take the price as a given.
2. Because some degree of competition is present in most markets, many of the
lessons that we learn by studying supply and demand under perfect competition
apply in more complicated markets.
II. Demand
A. The Demand Curve: The Relationship between Price and Quantity Demanded
© 2018 Cengage Learning®. May not be scanned, copied or duplicated, or posted to a publicly accessible website,
in whole or in part, except for use as permitted in a license distributed with a certain product or service or otherwise
on a password-protected website or school-approved learning management system for classroom use.
53 ❖ Chapter 4/The Market Forces of Supply and Demand
1. De=nition of quantity demanded: the amount of a good that buyers are
willing and able to purchase.
2. One important determinant of quantity demanded is the price of the product.
a. Quantity demanded is negatively related to price. This implies that the
demand curve is downward sloping.
Make sure that you explain that, when we discuss the relationship
between quantity demanded and price, we hold all other variables
constant. You will need to emphasize this more than once to ensure that
students understand why a change in price leads to a movement along
b. De=nition of law of demand: the claim that, other things being equal,
the quantity demanded of a good falls when the price of the good
rises.
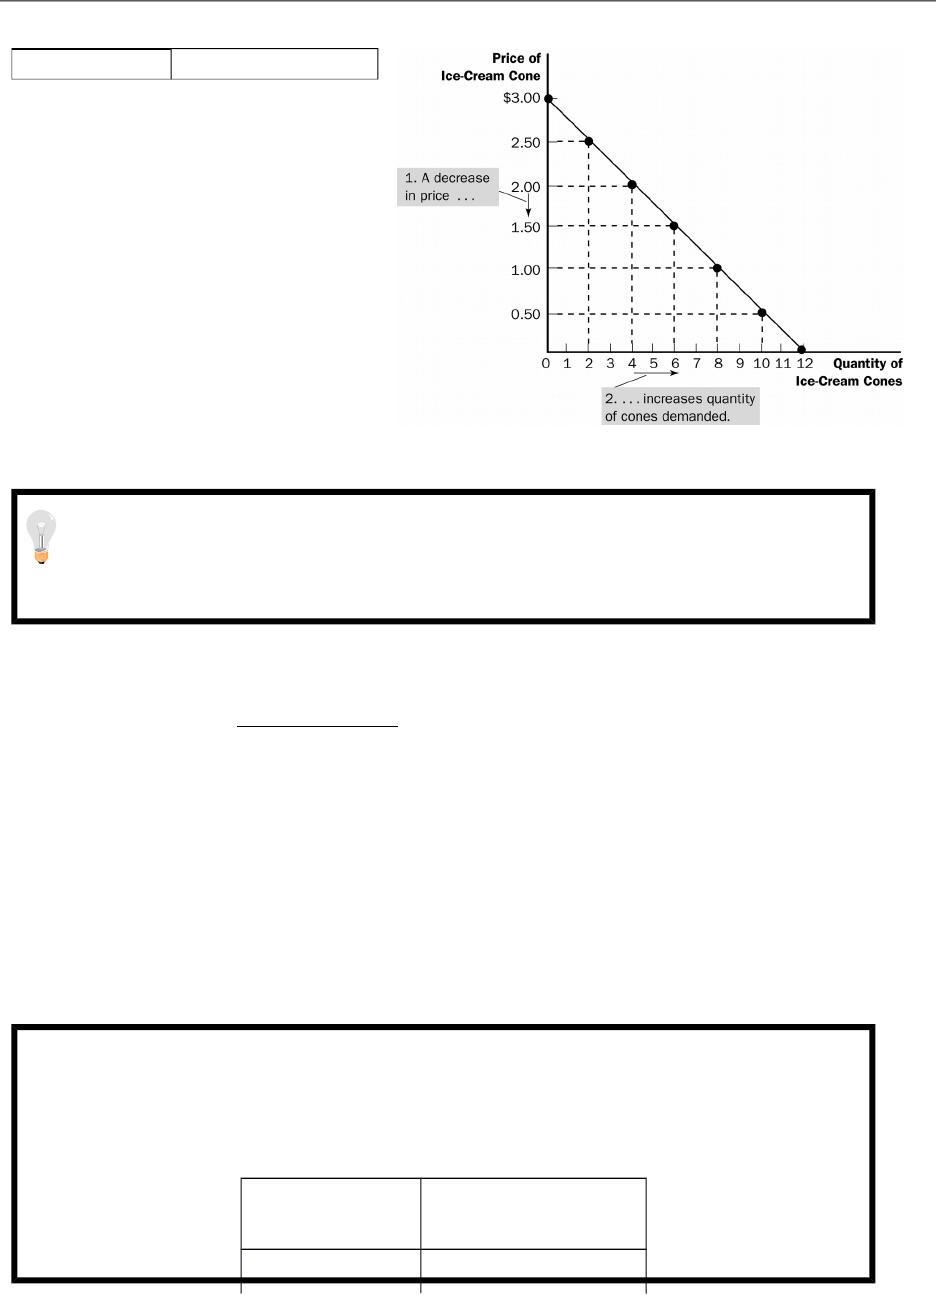
3. De=nition of demand schedule: a table that shows the relationship
between the price of a good and the quantity demanded.
Figure 1
Price of
Ice-Cream
Cone
Quantity of
Cones
Demanded
$0.00 12
$0.50 10
$1.00 8
$1.50 6
$2.00 4
$2.50 2
© 2018 Cengage Learning®. May not be scanned, copied or duplicated, or posted to a publicly accessible website,
in whole or in part, except for use as permitted in a license distributed with a certain product or service or otherwise
on a password-protected website or school-approved learning management system for classroom use.
Chapter 4/The Market Forces of Supply and Demand ❖ 54
$3.00 0
When you draw the demand curve for the =rst time, take the time to plot
each of the points from the demand schedule. This way, students who
have diOculty with graphs can see the relationship between the demand
schedule and the demand curve. This is a good opportunity to see if
students understand the (x, y) coordinate system.
4. De=nition of demand curve: a graph of the relationship between the price
of a good and the quantity demanded.
a. Price is generally drawn on the vertical axis.
b. Quantity demanded is represented on the horizontal axis.
ALTERNATIVE CLASSROOM EXAMPLE:
Here is a demand schedule for ink pens:
Price ($) Quantity
Demanded
.05 1000
© 2018 Cengage Learning®. May not be scanned, copied or duplicated, or posted to a publicly accessible website,
in whole or in part, except for use as permitted in a license distributed with a certain product or service or otherwise
on a password-protected website or school-approved learning management system for classroom use.
55 ❖ Chapter 4/The Market Forces of Supply and Demand
B. Market Demand versus Individual Demand
1. The market demand is the sum of all of the individual demands for a particular
good or service.
2. The demand curves are summed horizontally—meaning that the quantities
demanded are added up for each level of price.
Figure 2
3. The market demand curve shows how the total quantity demanded of a good
varies with the price of the good, holding constant all other factors that aEect
how much consumers want to buy.
C. Shifts in the Demand Curve
Students have a diOcult time understanding the diEerence between a
change in price (which causes a movement along the demand curve) and
a change in another determinant (which shifts the demand curve). You will
have to emphasize what is meant by “change in quantity demanded” and
“change in demand” several times using diEerent examples. The Case
Study on smoking will help to explain this diEerence as well.
1. Because the market demand curve holds other things constant, it need not be
stable over time.
Figure 3
2. If any of these other factors change, the demand curve will shift.
© 2018 Cengage Learning®. May not be scanned, copied or duplicated, or posted to a publicly accessible website,
in whole or in part, except for use as permitted in a license distributed with a certain product or service or otherwise
on a password-protected website or school-approved learning management system for classroom use.
Chapter 4/The Market Forces of Supply and Demand ❖ 56
a. An increase in demand is represented by a shift of the demand curve to the
right.
b. A decrease in demand is represented by a shift of the demand curve to the
left.
3. Income
a. The relationship between income and quantity demanded depends on what
type of good the product is.
b. De=nition of normal good: a good for which, other things equal, an
increase in income leads to an increase in demand.
c. De=nition of inferior good: a good for which, other things equal, an
increase in income leads to a decrease in demand.
Be careful! Students often confuse inferior goods with what economists
call “bads.” One way to diEerentiate them is to ask students whether they
would ever be willing to pay for such things as pollution or garbage.
4. Prices of Related Goods
a. De=nition of substitutes: two goods for which an increase in the price
of one good leads to an increase in the demand for the other.
b. De=nition of complements: two goods for which an increase in the
price of one good leads to a decrease in the demand for the other.
5. Tastes
© 2018 Cengage Learning®. May not be scanned, copied or duplicated, or posted to a publicly accessible website,
in whole or in part, except for use as permitted in a license distributed with a certain product or service or otherwise
on a password-protected website or school-approved learning management system for classroom use.
57 ❖ Chapter 4/The Market Forces of Supply and Demand
6. Expectations
a. Future income
b. Future prices
7. Number of Buyers
Table 1
It would be a good idea to work through an example changing each of
these variables individually. Students will bene=t from the discussion and
the practice drawing graphs.
D. Case Study: Two Ways to Reduce the Quantity of Smoking Demanded
Figure 4
1. Public service announcements, mandatory health warnings on cigarette
packages, and the prohibition of cigarette advertising on television are policies
designed to reduce the demand for cigarettes (and shift the demand curve to the
left).
2. Raising the price of cigarettes (through tobacco taxes) lowers the quantity of
cigarettes demanded.
a. The demand curve does not shift in this case, however.
© 2018 Cengage Learning®. May not be scanned, copied or duplicated, or posted to a publicly accessible website,
in whole or in part, except for use as permitted in a license distributed with a certain product or service or otherwise
on a password-protected website or school-approved learning management system for classroom use.
Chapter 4/The Market Forces of Supply and Demand ❖ 58
b. An increase in the price of cigarettes can be shown by a movement along the
original demand curve.
3. Studies have shown that a 10% increase in the price of cigarettes causes a 4%
reduction in the quantity of cigarettes demanded. For teens, a 10% increase in
price leads to a 12% drop in quantity demanded.
4. Studies have also shown that a decrease in the price of cigarettes is associated
with greater use of marijuana. Thus, it appears that tobacco and marijuana are
complements.
III. Supply
If you have taken enough time teaching demand, students will catch on to
supply more quickly. However, remember that as consumers, students can
understand demand decisions more easily than supply decisions. You may
want to point out to them that they are suppliers (of their time and eEort)
in the labor market.
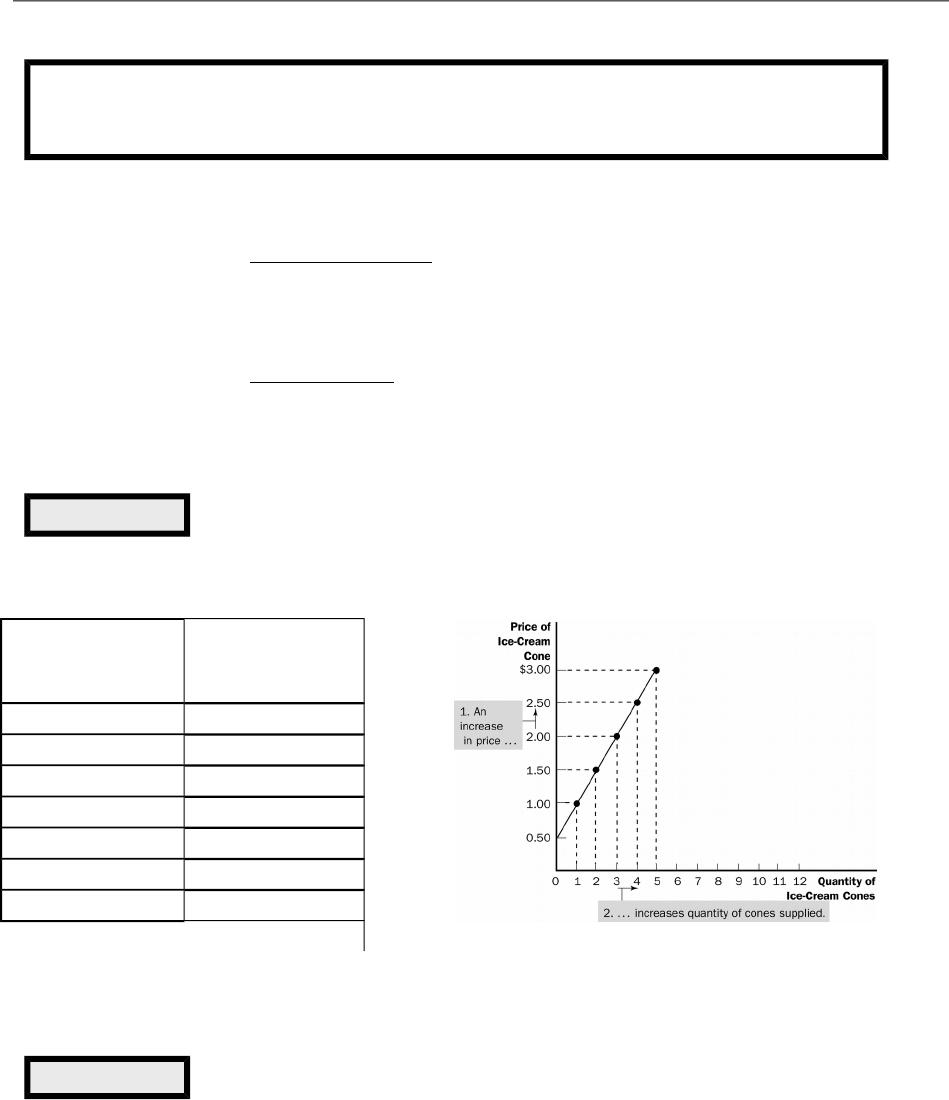
A. The Supply Curve: The Relationship between Price and Quantity Supplied
1. De=nition of quantity supplied: the amount of a good that sellers are
willing and able to sell.
a. Quantity supplied is positively related to price. This implies that the supply
curve will be upward sloping.
b. De=nition of law of supply: the claim that, other things equal, the
quantity supplied of a good rises when the price of the good rises.
© 2018 Cengage Learning®. May not be scanned, copied or duplicated, or posted to a publicly accessible website,
in whole or in part, except for use as permitted in a license distributed with a certain product or service or otherwise
on a password-protected website or school-approved learning management system for classroom use.
59 ❖ Chapter 4/The Market Forces of Supply and Demand
Again, you will want to point out that everything else is held constant
when we discuss the relationship between price and quantity supplied.
Students should understand that a change in price causes a movement
2. De=nition of supply schedule: a table that shows the relationship between
the price of a good and the quantity supplied.
3. De=nition of supply curve: a graph of the relationship between the price
of a good and the quantity supplied.
Figure 5
Price of
Ice-Cream
Cone
Quantity of
Cones
Supplied
$0.00 0
$0.50 0
$1.00 1
$1.50 2
$2.00 3
$2.50 4
$3.00 5
B. Market Supply versus Individual Supply
Figure 6
1. The market supply curve can be found by summing individual supply curves.
2. Individual supply curves are summed horizontally at every price.
© 2018 Cengage Learning®. May not be scanned, copied or duplicated, or posted to a publicly accessible website,
in whole or in part, except for use as permitted in a license distributed with a certain product or service or otherwise
on a password-protected website or school-approved learning management system for classroom use.
Chapter 4/The Market Forces of Supply and Demand ❖ 60
3. The market supply curve shows how the total quantity supplied varies as the
price of the good varies.
C. Shifts in the Supply Curve
Figure 7
1. Because the market supply curve holds other things constant, the supply curve
will shift if any of these factors changes.
a. An increase in supply is represented by a shift of the supply curve to the right.
b. A decrease in supply is represented by a shift of the supply curve to the left.
You will want to take time to emphasize the diEerence between a “change
in supply” and a “change in quantity supplied.”
2. Input Prices
3. Technology
4. Expectations
5. Number of Sellers
© 2018 Cengage Learning®. May not be scanned, copied or duplicated, or posted to a publicly accessible website,
in whole or in part, except for use as permitted in a license distributed with a certain product or service or otherwise
on a password-protected website or school-approved learning management system for classroom use.
61 ❖ Chapter 4/The Market Forces of Supply and Demand
Table 2
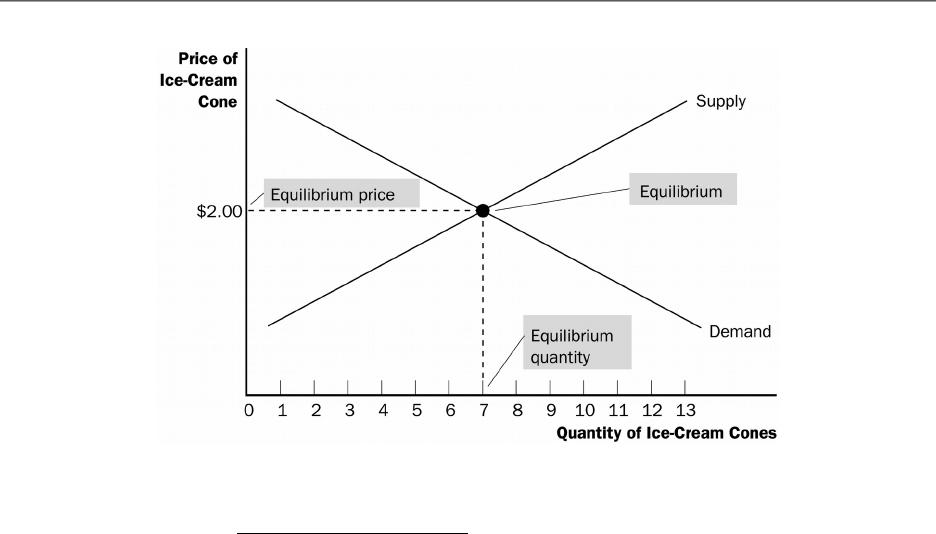
IV. Supply and Demand Together
A. Equilibrium
1. The point where the supply and demand curves intersect is called the market’s
equilibrium.
2. De=nition of equilibrium: a situation in which the market price has
reached the level at which quantity supplied equals quantity demanded.
3. De=nition of equilibrium price: the price that balances quantity supplied
and quantity demanded.
Students will bene=t from seeing equilibrium using both a graph and a
supply-and-demand schedule. The schedule will also make it easier for
students to understand concepts such as shortages and surpluses.
4. The equilibrium price is often called the “market-clearing” price because both
buyers and sellers are satis=ed at this price.
Figure 8
© 2018 Cengage Learning®. May not be scanned, copied or duplicated, or posted to a publicly accessible website,
in whole or in part, except for use as permitted in a license distributed with a certain product or service or otherwise
on a password-protected website or school-approved learning management system for classroom use.
Chapter 4/The Market Forces of Supply and Demand ❖ 62
5. De=nition of equilibrium quantity: the quantity supplied and the quantity
demanded at the equilibrium price.
© 2018 Cengage Learning®. May not be scanned, copied or duplicated, or posted to a publicly accessible website,
in whole or in part, except for use as permitted in a license distributed with a certain product or service or otherwise
on a password-protected website or school-approved learning management system for classroom use.

63 ❖ Chapter 4/The Market Forces of Supply and Demand
Activity 1—A Market Example
Type: In-class demonstration
Topics: Individual demand, market demand, equilibrium price,
allocation
Materials needed: A bag of Pepperidge Farm cookies (15 cookies), 5 volunteers
Time: 35 minutes
Class limitations: Works in large lectures or small classes with over 15
students
Purpose
This is an example of a real-world market, where real goods are exchanged for
real money. It is a free market, so there will be no coercion, but participants
should think carefully about their answers because actual trades will take place.
Instructions
Ask =ve volunteers to participate in a market for Pepperidge Farm cookies. Read
some of the package copy describing these “distinctively delicious” cookies. Write
each volunteer’s name on the board.
Ask the volunteers how many cookies they would be willing to buy at various
prices. Record these prices and quantities. Give the volunteers the opportunity to
revise their numbers if the =gures do not accurately reCect their willingness to
pay. Remind them this isn’t a hypothetical exercise and they will have to pay real
money.
At this point, there will be =ve individual demand curves, which can be graphed if
desired.
Add the individual quantities at each price to =nd the market demand at that
price. This overall demand is used to =nd the market equilibrium. Sketch a graph
of the market demand.
Supply, in this case, is =xed at the number of cookies in the bag. There are 15
cookies. No more can be produced, and any leftovers will spoil. This gives a
vertical supply curve in the very short run at Q = 15. (Sketch the supply curve.)
© 2018 Cengage Learning®. May not be scanned, copied or duplicated, or posted to a publicly accessible website,
in whole or in part, except for use as permitted in a license distributed with a certain product or service or otherwise
on a password-protected website or school-approved learning management system for classroom use.
Chapter 4/The Market Forces of Supply and Demand ❖ 64
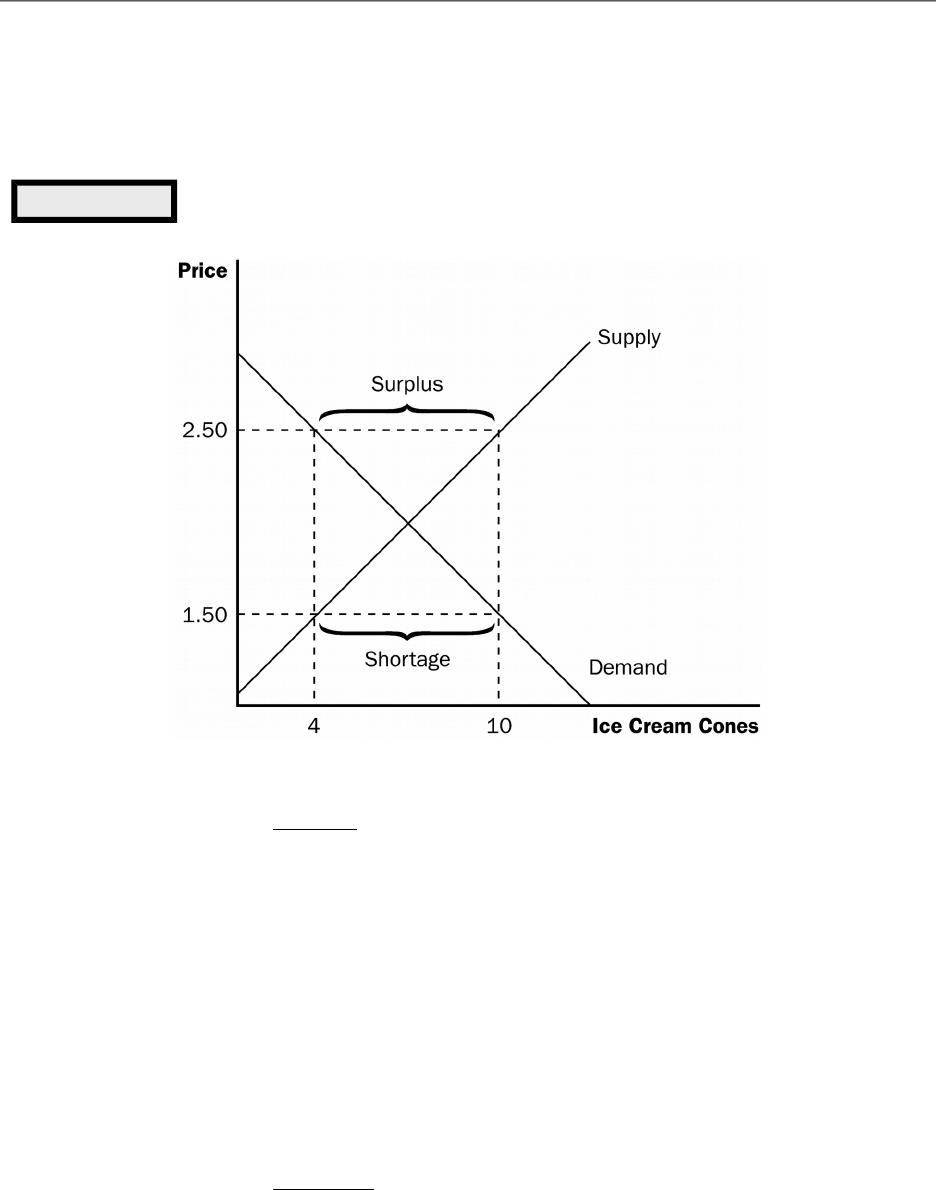
6. If the actual market price is higher than the equilibrium price, there will be a
surplus of the good.
Figure 9
a. De=nition of surplus: a situation in which quantity supplied is greater
than quantity demanded.
b. To eliminate the surplus, producers will lower the price until the market
reaches equilibrium.
7. If the actual price is lower than the equilibrium price, there will be a shortage of
the good.
a. De=nition of shortage: a situation in which quantity demanded is
greater than quantity supplied.
b. Sellers will respond to the shortage by raising the price of the good until the
market reaches equilibrium.
© 2018 Cengage Learning®. May not be scanned, copied or duplicated, or posted to a publicly accessible website,
in whole or in part, except for use as permitted in a license distributed with a certain product or service or otherwise
on a password-protected website or school-approved learning management system for classroom use.

65 ❖ Chapter 4/The Market Forces of Supply and Demand
8. De=nition of the law of supply and demand: the claim that the price of any
good adjusts to bring the supply and demand for that good into balance.
© 2018 Cengage Learning®. May not be scanned, copied or duplicated, or posted to a publicly accessible website,
in whole or in part, except for use as permitted in a license distributed with a certain product or service or otherwise
on a password-protected website or school-approved learning management system for classroom use.

Chapter 4/The Market Forces of Supply and Demand ❖ 66
Activity 2—Campus Parking
Type: In-class assignment
Topics: Demand, supply, disequilibrium, shortage, rationing
Materials needed: A shortage of student parking on campus
Time: 35 minutes
Class limitations: Works in large lectures or small classes, if there is a campus
parking problem.
Purpose
Nothing seems to generate more heated discussion than campus parking. If your
school has a parking shortage this assignment brings the ideas of price rationing
and resource allocation to an issue close to the students’ hearts.
A. K. Sen’s parable of the bamboo Cute is a good introduction to this assignment:
An artist makes a beautiful instrument that becomes famous throughout the
country. A number of claimants arise, each of whom argues that they deserve the
Cute: the artist who created it, the most talented musician, the poorest musician,
the neediest citizen, the hardest working musician, etc. Who deserves the Cute?
Students will have diEerent opinions on who is most deserving but many will
accept a market solution—the person who is willing to pay the most (who has the
highest marginal bene=t, given the existing distribution of wealth and income).
The allocation of campus parking spots makes a nice parallel.
Instruction
Ask the class to answer the following questions. Give them time to write an
answer to a question, then discuss their answers before moving to the next
question.
Common Answers and Points for Discussion
1. Write down three things that are true about the parking situation on campus.
2. What two problems do you think are most important?
The parking problem has two components in the eyes of most students. Parking
permits are too expensive and there are too few spaces.
3. What policies could the administration make to resolve these problems?
Students have many policies to alleviate the situation. The most common
© 2018 Cengage Learning®. May not be scanned, copied or duplicated, or posted to a publicly accessible website,
in whole or in part, except for use as permitted in a license distributed with a certain product or service or otherwise
on a password-protected website or school-approved learning management system for classroom use.
67 ❖ Chapter 4/The Market Forces of Supply and Demand
B. Three Steps to Analyzing Changes in Equilibrium
Table 3
1. Decide whether the event shifts the supply or demand curve (or perhaps both).
2. Determine the direction in which the curve shifts.
3. Use the supply-and-demand diagram to see how the shift changes the equilibrium
price and quantity.
This three-step process is very important. Students often want to jump to
the end without thinking the change through. They should be provided
with numerous examples so that they can see the bene=t of analyzing a
change in equilibrium one step at a time.
C. Example: A change in market equilibrium due to a shift in demand—the eEect of hot
weather on the market for ice cream.
© 2018 Cengage Learning®. May not be scanned, copied or duplicated, or posted to a publicly accessible website,
in whole or in part, except for use as permitted in a license distributed with a certain product or service or otherwise
on a password-protected website or school-approved learning management system for classroom use.
Many students initially have diOculty graphing this problem. They want to
illustrate that permit prices are too high, but then their graph will not show the
shortage. Eventually they can be convinced that parking, while expensive, is
actually priced too low.
7. How would your policy proposals aEect the market for parking?
Analysis of the various proposals in a supply-and-demand framework shows some
popular policies, like free permits, would aggravate the parking shortage. Policies
to restrict demand can reduce the shortage, although there will be ineOciencies in
Chapter 4/The Market Forces of Supply and Demand ❖ 68
Figure 10
Go through changes in supply and demand carefully. Show students why
the equilibrium price must change after one of the curves shifts. For
example, point out that if demand rises, a shortage will occur at the
original equilibrium price. This leads to an increase in price, which causes
quantity supplied to rise and quantity demanded to fall until equilibrium is
achieved. The end result is an increase in both the equilibrium price and
equilibrium quantity. Also point out that an increase in demand leads to an
ALTERNATIVE CLASSROOM EXAMPLE:
Go through these examples of events that would shift either the demand or
supply of #2 pencils:
an increase in the income of consumers
an increase in the use of standardized exams (using opscan forms)
a decrease in the price of graphite (used in the production of pencils)
D. Shifts in Curves versus Movements along Curves
1. A shift in the demand curve is called a “change in demand.” A shift in the supply
curve is called a “change in supply.”
Emphasize that students should not think about the curves shifting “up”
and “down” but rather think about the curves shifting “right” and “left” (or
“out” and “in”). Point out that an increase in demand (or supply) is an
increase in the quantity demanded (supplied) at every price. Thus, it is
quantity that is getting larger. Review the same principle with a decrease
2. A movement along a =xed demand curve is called a “change in quantity
demanded.” A movement along a =xed supply curve is called a “change in
quantity supplied.”
© 2018 Cengage Learning®. May not be scanned, copied or duplicated, or posted to a publicly accessible website,
in whole or in part, except for use as permitted in a license distributed with a certain product or service or otherwise
on a password-protected website or school-approved learning management system for classroom use.
69 ❖ Chapter 4/The Market Forces of Supply and Demand
It would helpful to students if you draw all four graphs (increase in
demand, decrease in demand, increase in supply, and decrease in supply)
on the board at the same time. Students will be able to see that the end
result of each of these four shifts is unique. Point out to students that they
can use these graphs to explain events going on in markets around them.
For example, point out changes in gasoline prices seen during the past
several years. Then ask students what could have led to these changes in
price. Make sure that they realize that they would need to know the eEect
E. Example: A change in market equilibrium due to a shift in supply—the eEect of a
hurricane that destroys part of the sugar-cane crop and drives up the price of sugar.
Figure 11
F. Example: Shifts in both supply and demand—the eEect of hot weather and a
hurricane that destroys part of the sugar cane crop.
Figure 12
Make sure that you explain to students that two possible outcomes might
result, depending on the relative sizes of the shifts in the demand and
supply curves. Thus, if they do not know the relative sizes of these shifts,
the end eEect on either equilibrium price or equilibrium quantity will be
ambiguous. Teach students to shift each curve using the three-step
G. Summary
1. When an event shifts the supply or demand curve, we can examine the eEects on
the equilibrium price and quantity.
© 2018 Cengage Learning®. May not be scanned, copied or duplicated, or posted to a publicly accessible website,
in whole or in part, except for use as permitted in a license distributed with a certain product or service or otherwise
on a password-protected website or school-approved learning management system for classroom use.

Chapter 4/The Market Forces of Supply and Demand ❖ 70
2. Table 4 reports the end results of these shifts in supply and demand.
Table 4
H. In the News: Price Increases after Disasters
1. When a disaster strikes a region, many goods experience an increase in demand
or a decrease in supply resulting in upward pressure on prices.
2. This article from CNBC.com defends price increases following natural disasters as
a natural result of market interactions.
I. Ask the Experts: Price Gouging
1. Economic experts were asked if Connecticut should pass its proposed Bill
prohibiting charging prices that are “unconscionably excessive” for consumer
goods and services following a severe weather event emergency.
2. 77 percent disagreed that this Bill should be passed.
V. Conclusion: How Prices Allocate Resources
A. The model of supply and demand is a powerful tool for analyzing markets.
B. Supply and demand together determine the prices of the economy’s goods and
services.
1. These prices serve as signals that guide the allocation of scarce resources in the
economy.
© 2018 Cengage Learning®. May not be scanned, copied or duplicated, or posted to a publicly accessible website,
in whole or in part, except for use as permitted in a license distributed with a certain product or service or otherwise
on a password-protected website or school-approved learning management system for classroom use.
71 ❖ Chapter 4/The Market Forces of Supply and Demand
2. Prices determine who produces each good and how much of each good is
produced.
Make a big deal about how well prices serve to allocate resources to their
highest valued uses. For example, suppose that consumers develop an
increased taste for corn and corn products. This leads to an increase in
the demand for corn, pushing the price up. This increased price provides
incentives to producers to produce more corn. Thus, price signals our
wants and desires. This is one reason why markets generally serve as the
© 2018 Cengage Learning®. May not be scanned, copied or duplicated, or posted to a publicly accessible website,
in whole or in part, except for use as permitted in a license distributed with a certain product or service or otherwise
on a password-protected website or school-approved learning management system for classroom use.

Chapter 4/The Market Forces of Supply and Demand ❖ 72
Activity 3—Supply and Demand Article
Type: Take-home assignment
Topics: Shifts in supply or demand, changing equilibrium
Class limitations: Works in any class
Purpose
This assignment is an excellent way to determine which students need extra help
in understanding supply and demand. Students who have diOculty with it often
need remedial help. Allowing students to correct errors and then resubmit the
assignment can be worthwhile because it is fundamental to their understanding of
how markets work.
Instructions
Give the students the following assignment:
Find an article in a recent newspaper or magazine illustrating a change in price or
quantity in some market. Analyze the situation using economic reasoning.
1. Has there been an increase or decrease in demand? Factors that could
shift the demand curve include changes in preferences, changes in
income, changes in the price of substitutes or complements, or
changes in the number of consumers in the market.
2. Has there been an increase or decrease in supply? Factors that could
shift the supply curve include changes in costs of materials, wages, or
other inputs; changes in technology; or changes in the number of =rms
in the market.
3. Draw a supply-and-demand graph to explain this change. Be sure to
label your graph and clearly indicate which curve shifts.
Ask students to turn in a copy of the article along with their explanation. Warn
students to avoid advertisements because they contain little information. They
© 2018 Cengage Learning®. May not be scanned, copied or duplicated, or posted to a publicly accessible website,
in whole or in part, except for use as permitted in a license distributed with a certain product or service or otherwise
on a password-protected website or school-approved learning management system for classroom use.