SOLUTIONS TO TEXT PROBLEMS:
Quick Quizzes
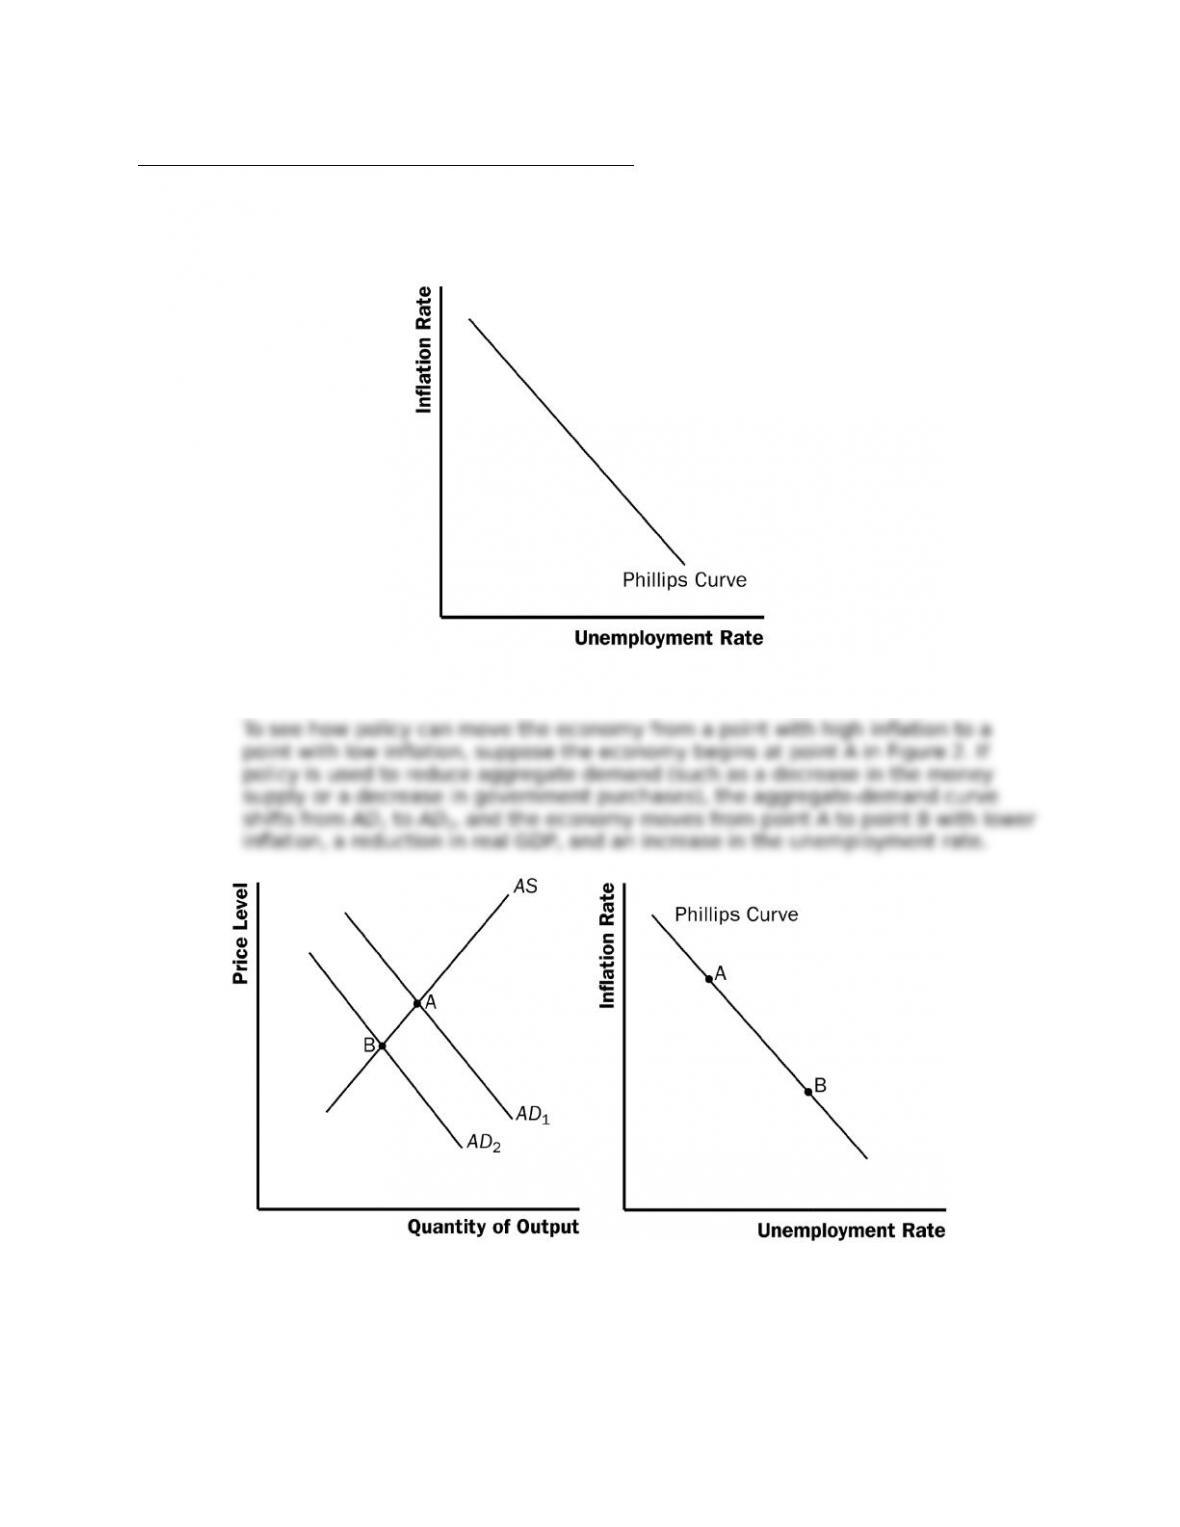
1. The Phillips curve is shown in Figure 1.
Figure 1
Figure 2
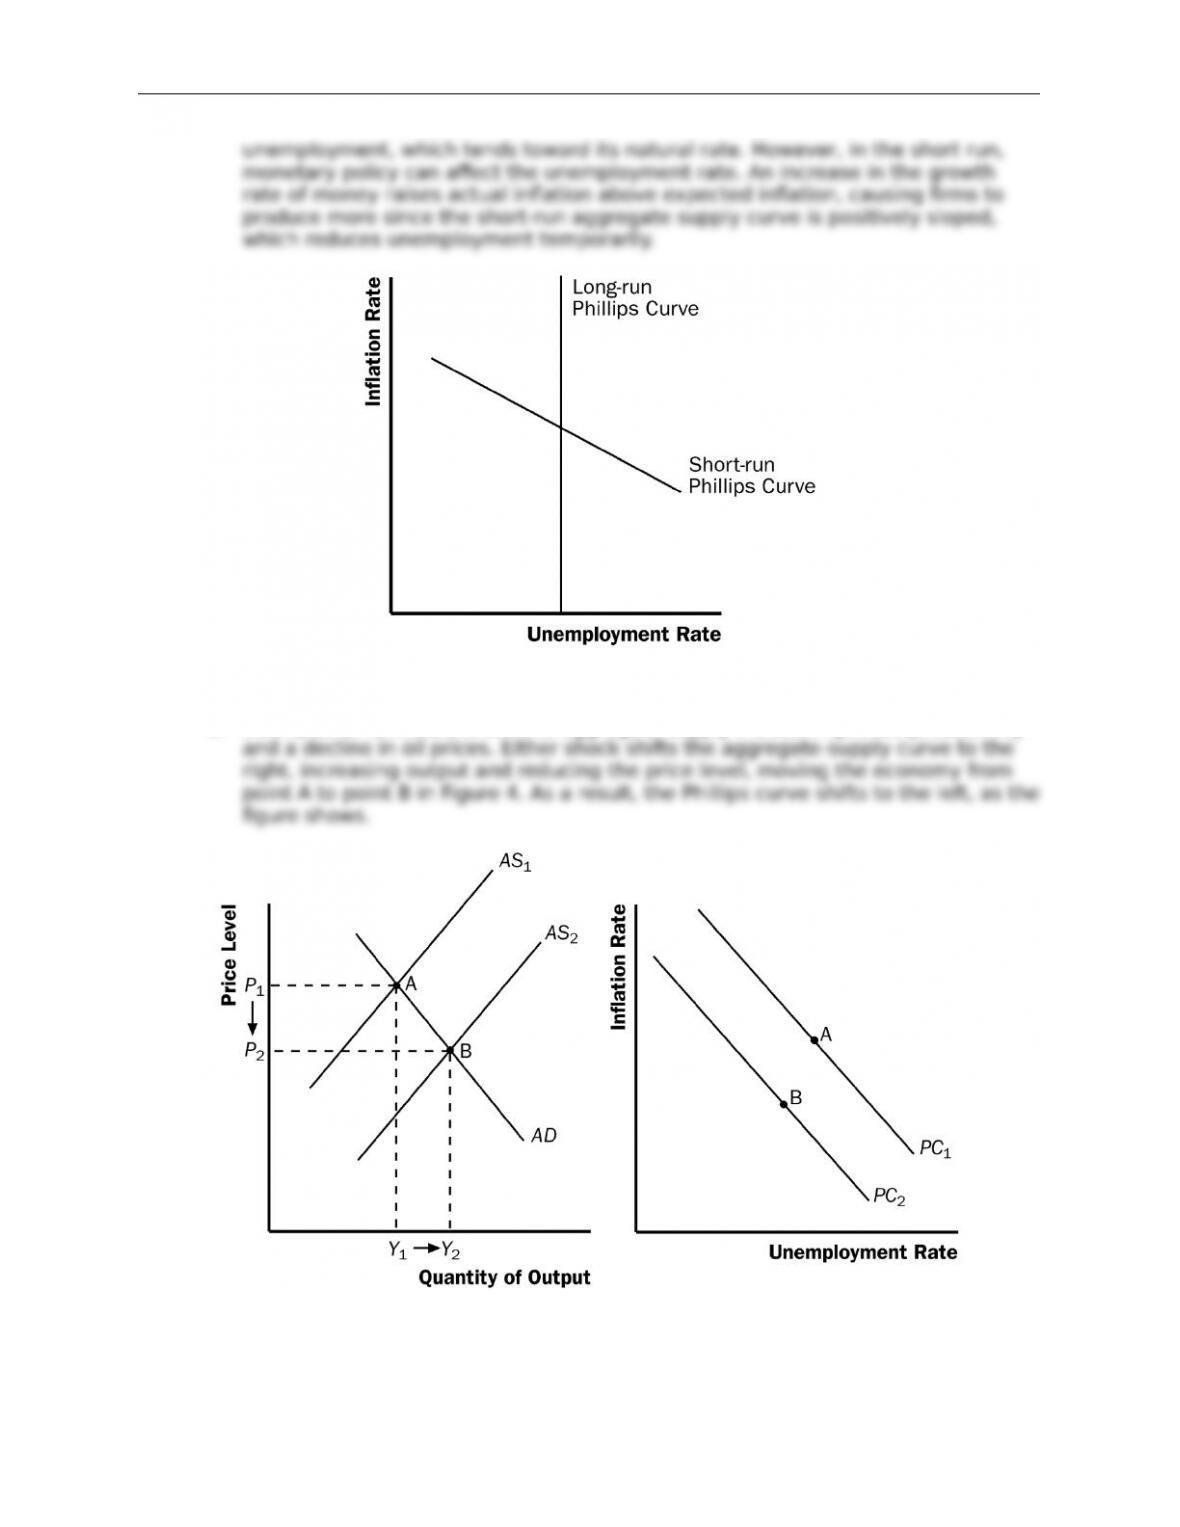
2. Figure 3 shows the short-run Phillips curve and the long-run Phillips curve. The
curves are di(erent because in the long run, monetary policy has no e(ect on
589
© 2018 Cengage Learning®. May not be scanned, copied or duplicated, or posted to a publicly accessible website,
in whole or in part, except for use as permitted in a license distributed with a certain product or service or otherwise
on a password-protected website or school-approved learning management system for classroom use.
Chapter 35/The Short-Run Trade-o( between Ination and Unemployment ❖ 590
Figure 3
3. Examples of favorable shocks to aggregate supply include improved productivity
Figure 4
© 2018 Cengage Learning®. May not be scanned, copied or duplicated, or posted to a publicly accessible website,
in whole or in part, except for use as permitted in a license distributed with a certain product or service or otherwise
on a password-protected website or school-approved learning management system for classroom use.
Chapter 35/The Short-Run Trade-o( between Ination and Unemployment ❖ 591
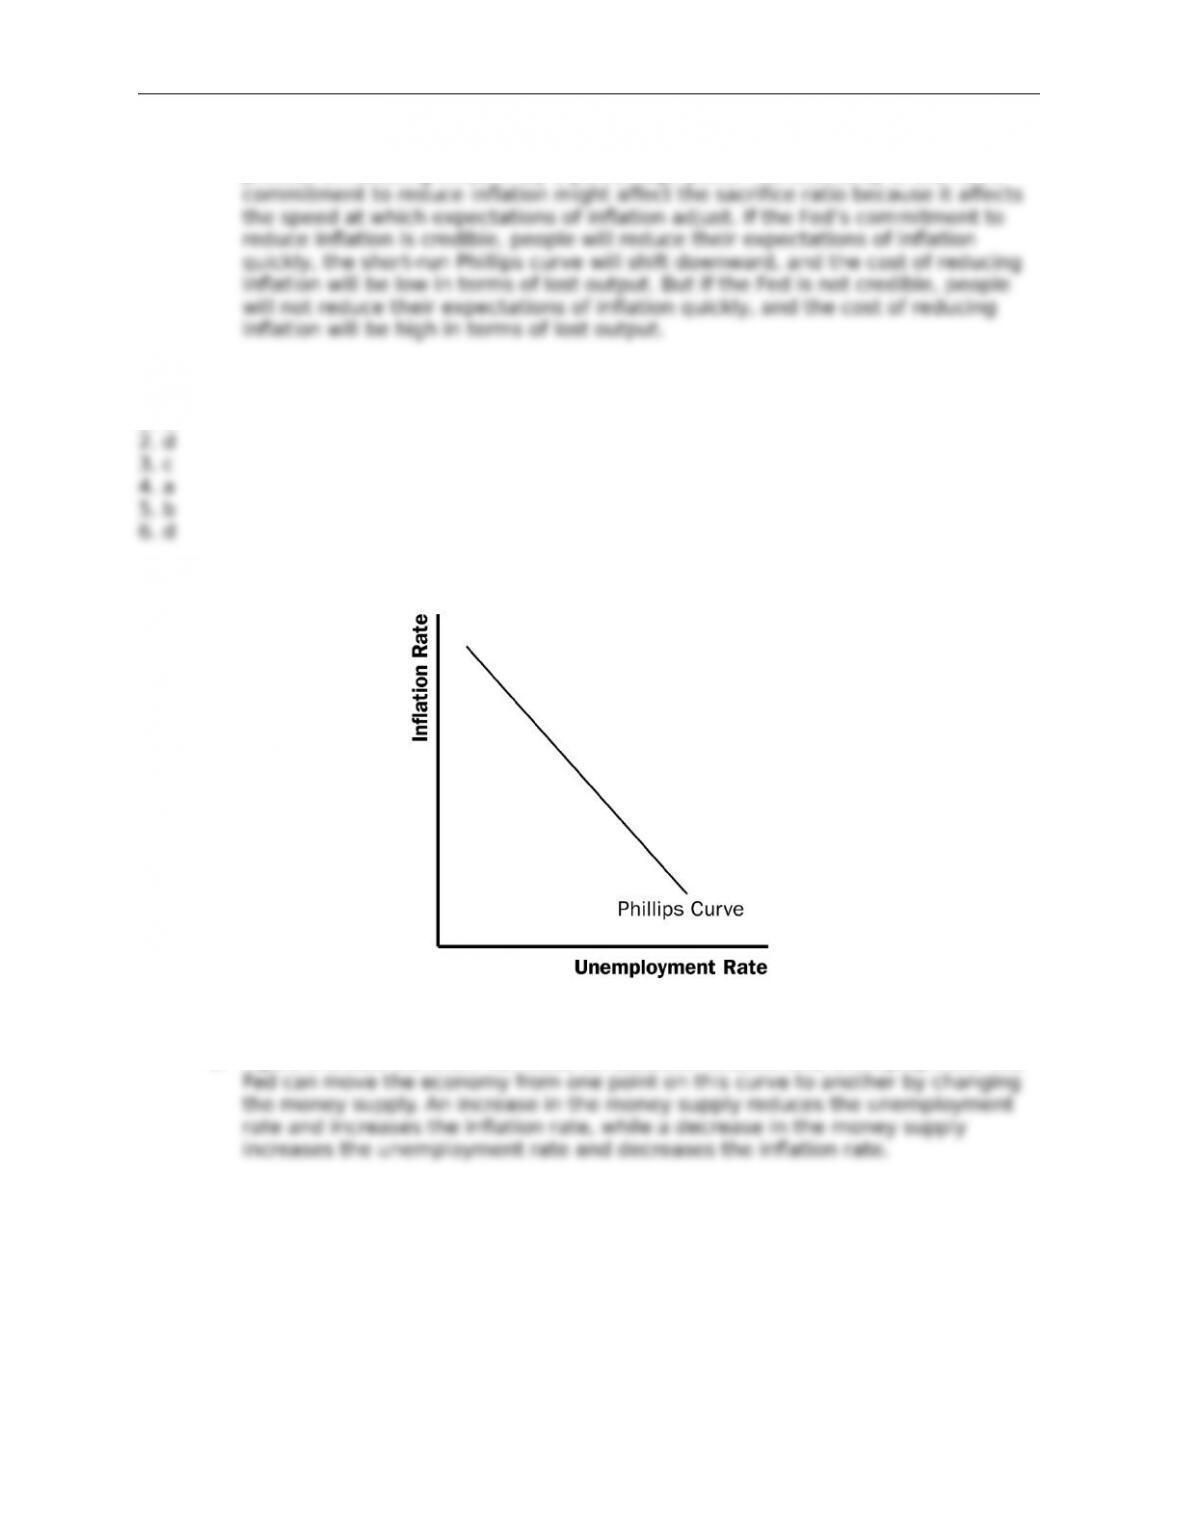
4. The sacri:ce ratio is the number of percentage points of annual output lost in the
process of reducing ination by 1 percentage point. The credibility of the Fed’s
Chapter Quick Quiz
1. b
Questions for Review
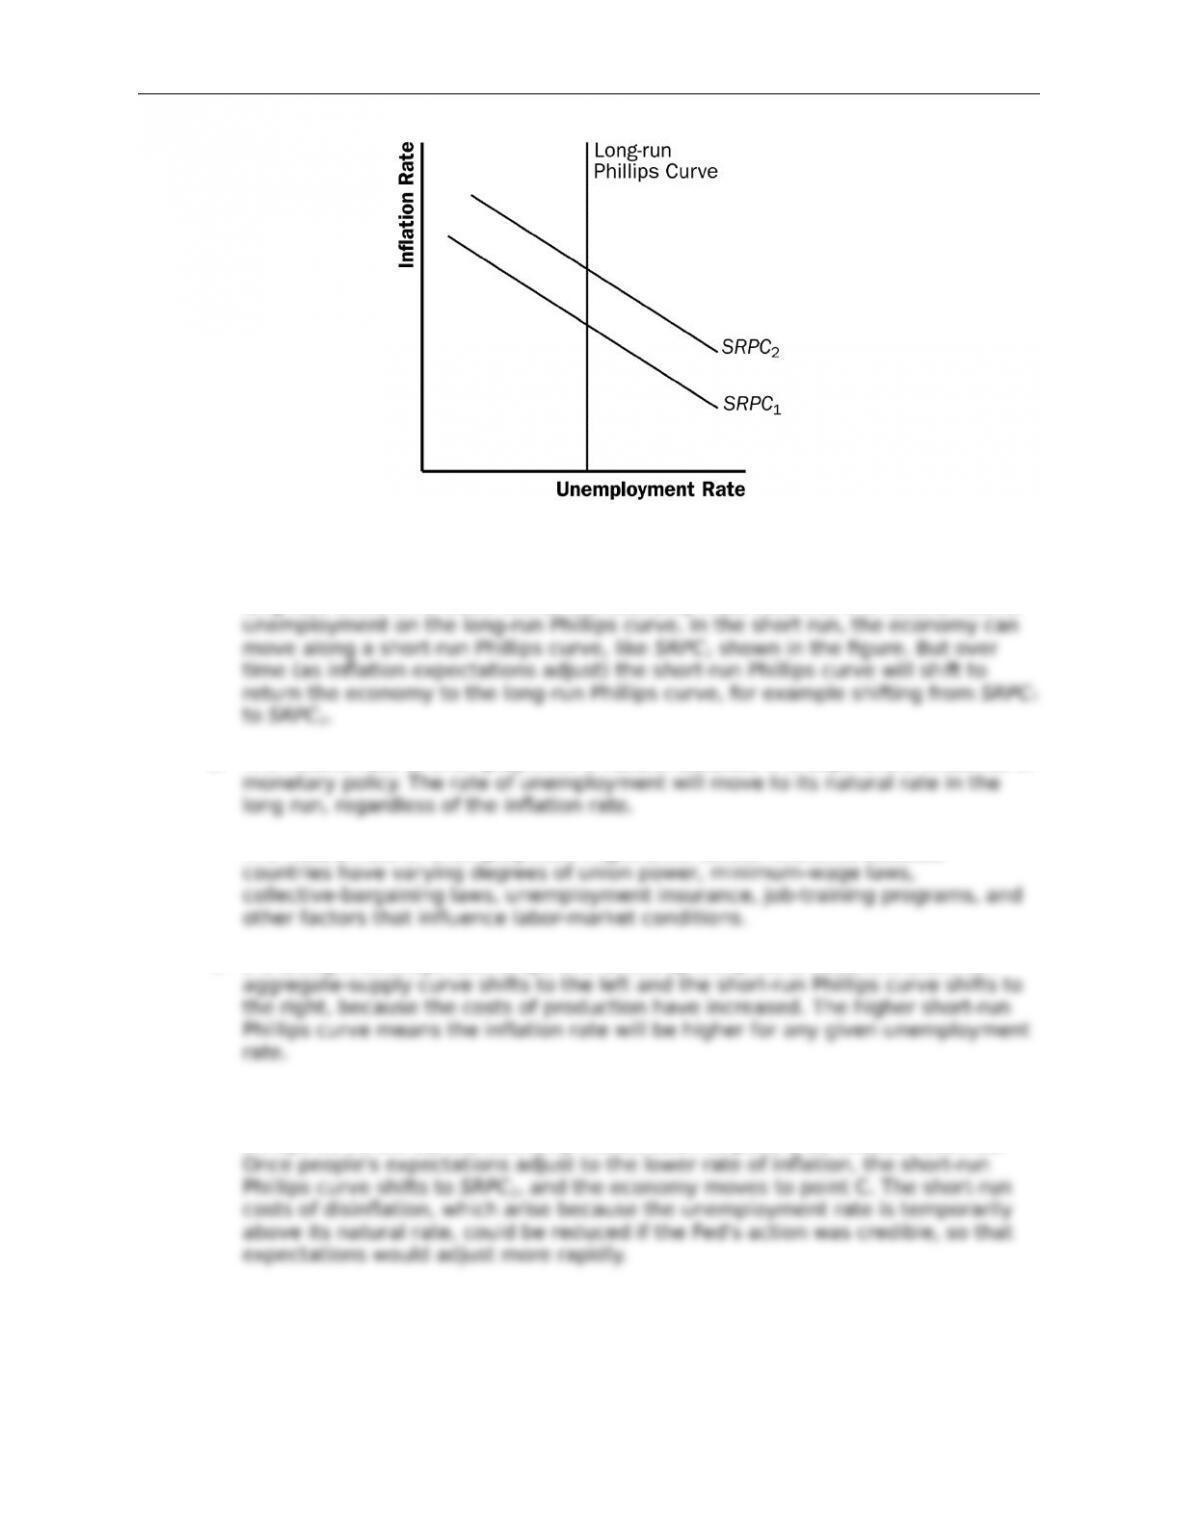
Figure 5
1. Figure 5 shows the short-run trade-o( between ination and unemployment. The
© 2018 Cengage Learning®. May not be scanned, copied or duplicated, or posted to a publicly accessible website,
in whole or in part, except for use as permitted in a license distributed with a certain product or service or otherwise
on a password-protected website or school-approved learning management system for classroom use.
Chapter 35/The Short-Run Trade-o( between Ination and Unemployment ❖ 592
Figure 6
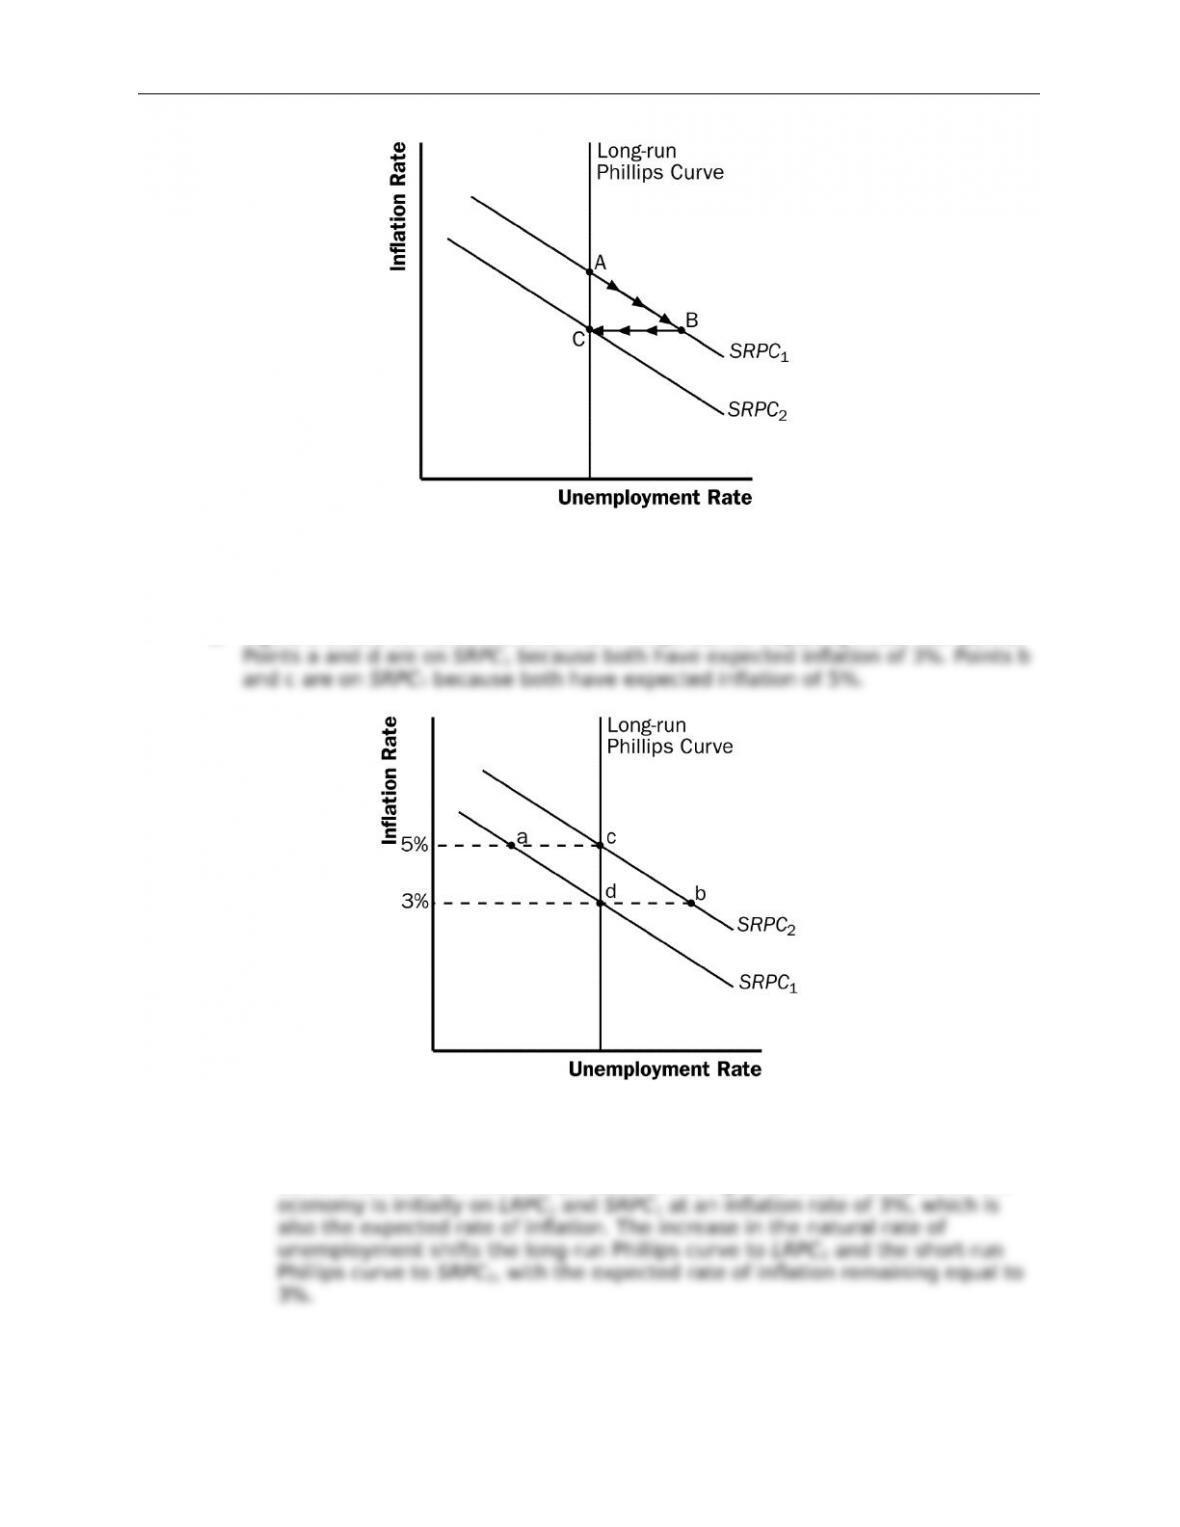
2. Figure 6 shows the long-run trade-o( between ination and unemployment. In the
long run, there is no trade-o(, as the economy must return to the natural rate of
3. The natural rate of unemployment is natural because it is beyond the inuence of
The natural rate of unemployment might di(er across countries because
4. If a drought destroys farm crops and drives up the price of food, the short-run
5. When the Fed decides to reduce ination, the economy moves down along the
short-run Phillips curve, as shown in Figure 7. Beginning at point A on short-run
Phillips curve SRPC1, the economy moves down to point B as ination declines.
© 2018 Cengage Learning®. May not be scanned, copied or duplicated, or posted to a publicly accessible website,
in whole or in part, except for use as permitted in a license distributed with a certain product or service or otherwise
on a password-protected website or school-approved learning management system for classroom use.
Chapter 35/The Short-Run Trade-o( between Ination and Unemployment ❖ 593
Figure 7
Problems and Applications
1. Figure 8 shows two di(erent short-run Phillips curves depicting these four points.
Figure 8
2. a. A rise in the natural rate of unemployment shifts both the long-run Phillips
curve and the short-run Phillips curve to the right, as shown in Figure 9. The
© 2018 Cengage Learning®. May not be scanned, copied or duplicated, or posted to a publicly accessible website,
in whole or in part, except for use as permitted in a license distributed with a certain product or service or otherwise
on a password-protected website or school-approved learning management system for classroom use.
Chapter 35/The Short-Run Trade-o( between Ination and Unemployment ❖ 594
Figure 9
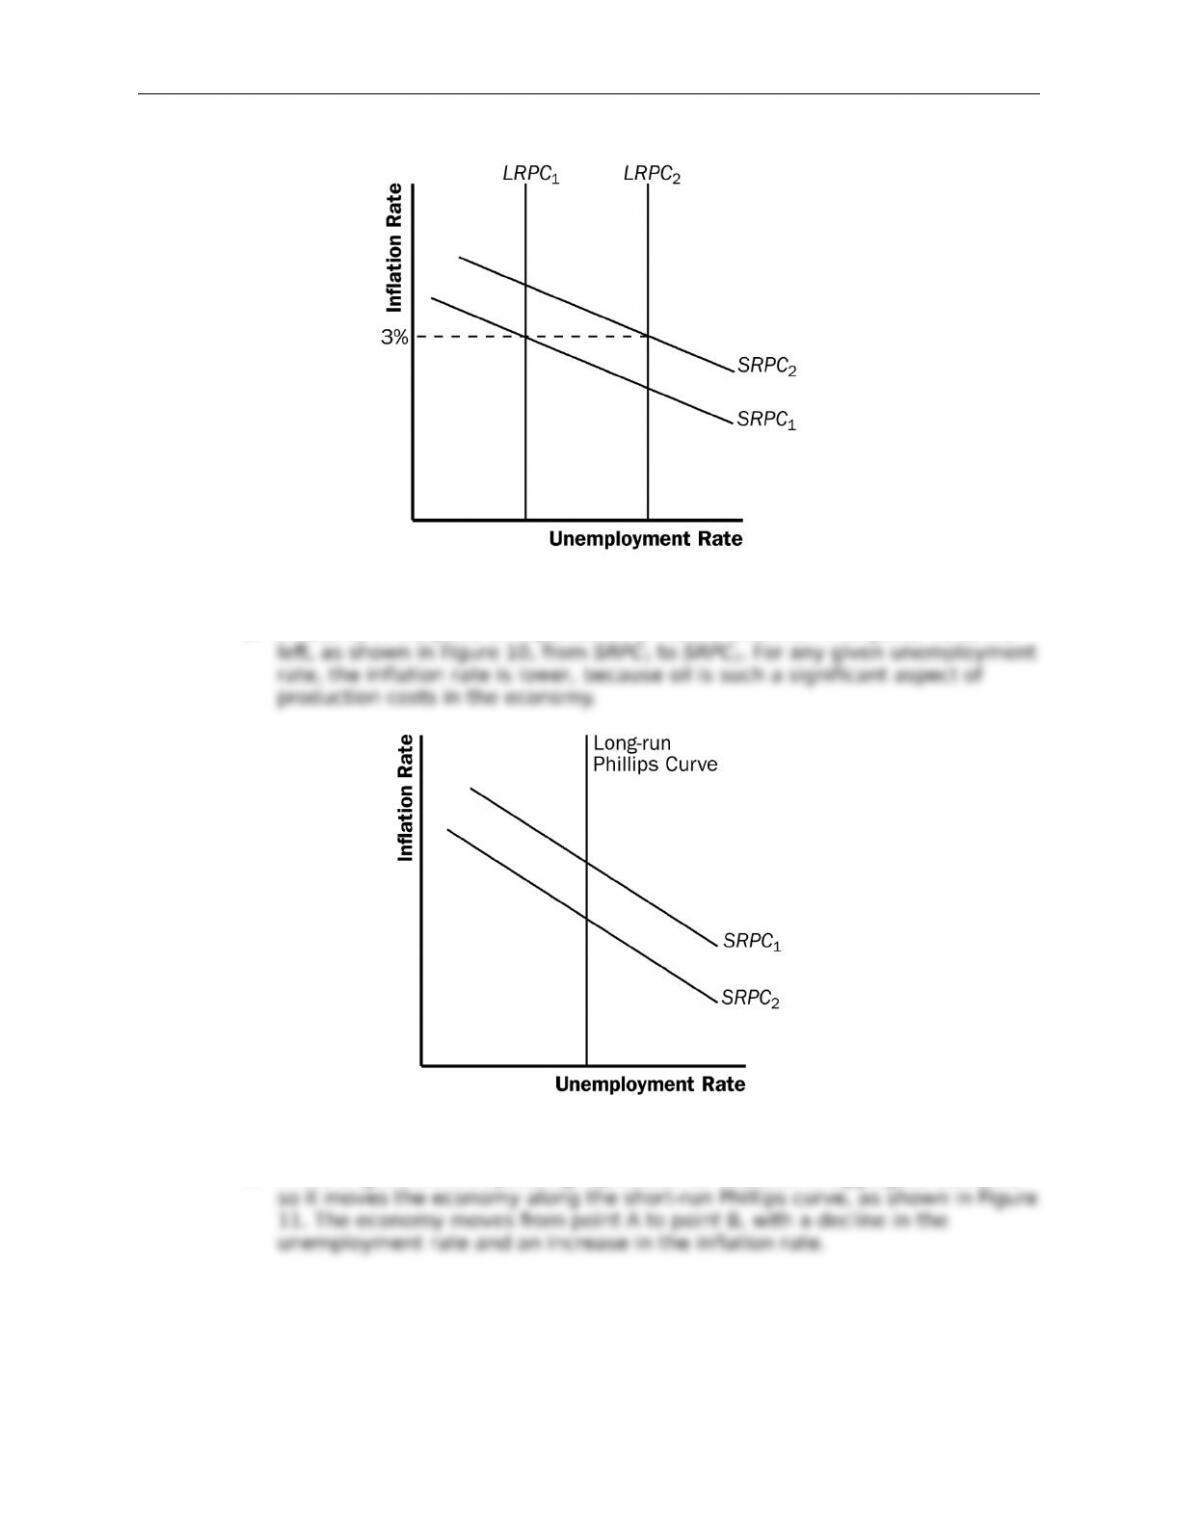
b. A decline in the price of imported oil shifts the short-run Phillips curve to the
Figure 10
c. A rise in government spending represents an increase in aggregate demand,
© 2018 Cengage Learning®. May not be scanned, copied or duplicated, or posted to a publicly accessible website,
in whole or in part, except for use as permitted in a license distributed with a certain product or service or otherwise
on a password-protected website or school-approved learning management system for classroom use.
Chapter 35/The Short-Run Trade-o( between Ination and Unemployment ❖ 595
Figure 11
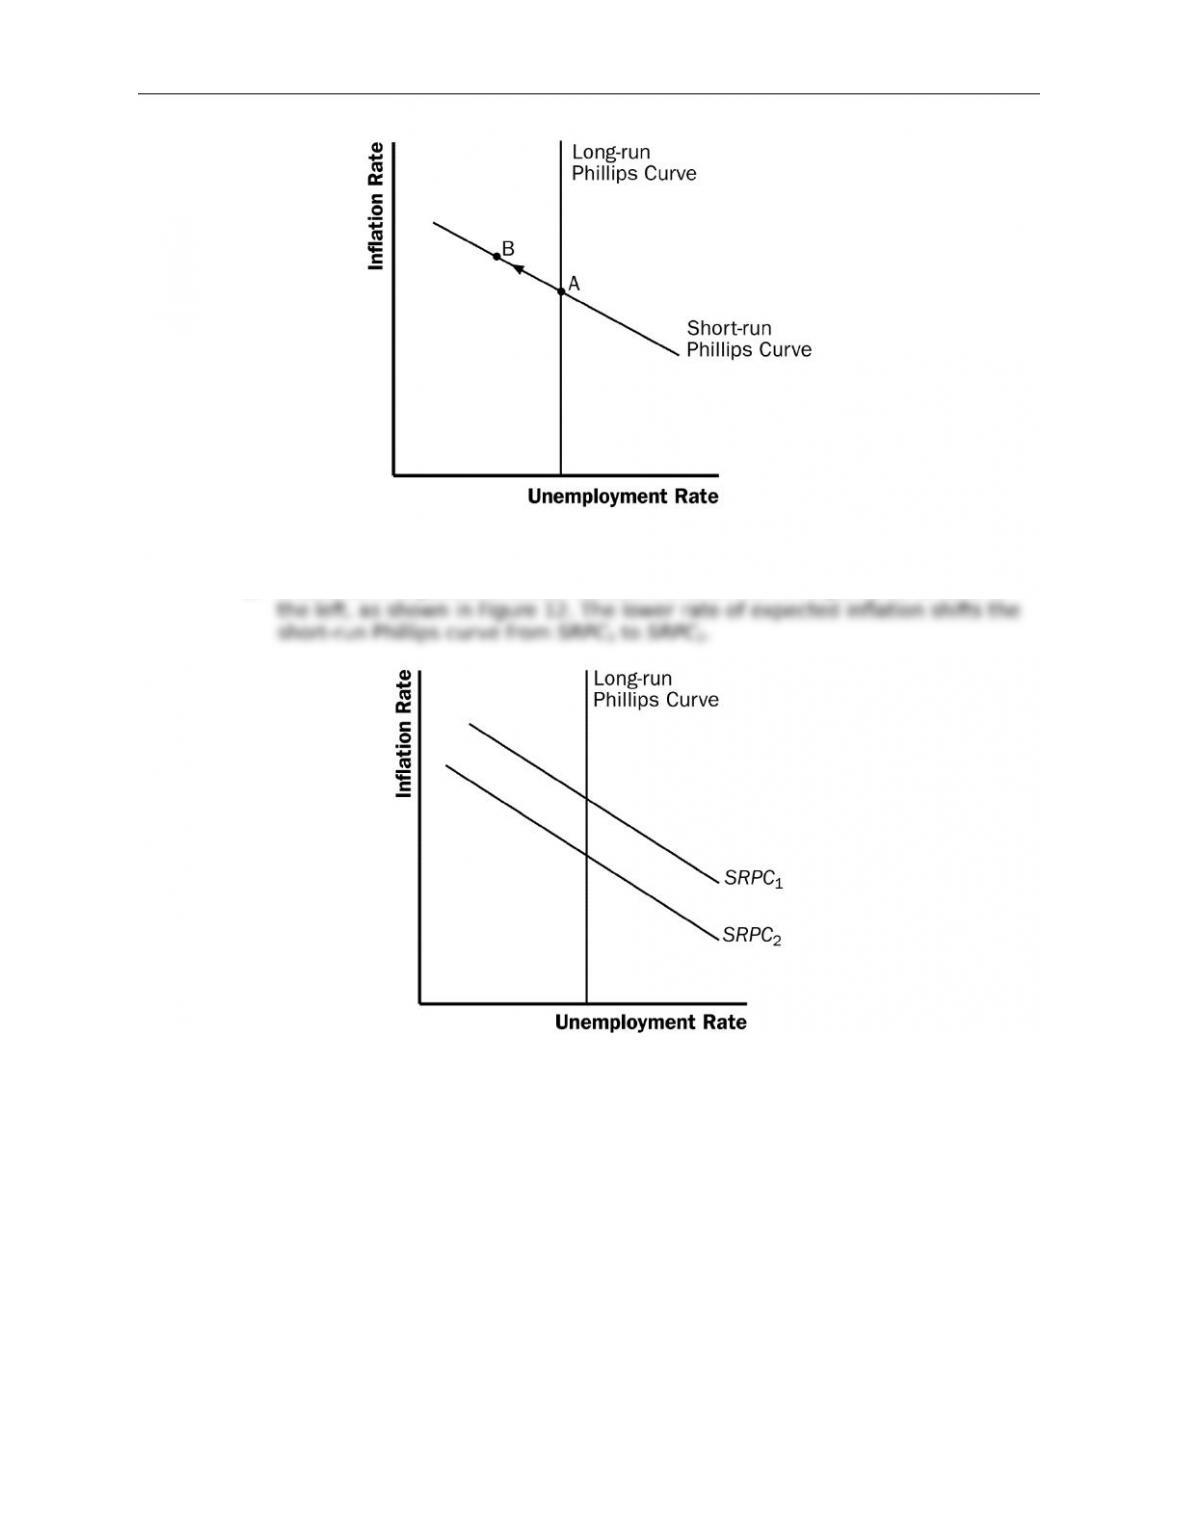
d. A decline in expected ination causes the short-run Phillips curve to shift to
Figure 12
© 2018 Cengage Learning®. May not be scanned, copied or duplicated, or posted to a publicly accessible website,
in whole or in part, except for use as permitted in a license distributed with a certain product or service or otherwise
on a password-protected website or school-approved learning management system for classroom use.
Chapter 35/The Short-Run Trade-o( between Ination and Unemployment ❖ 596
Figure 13
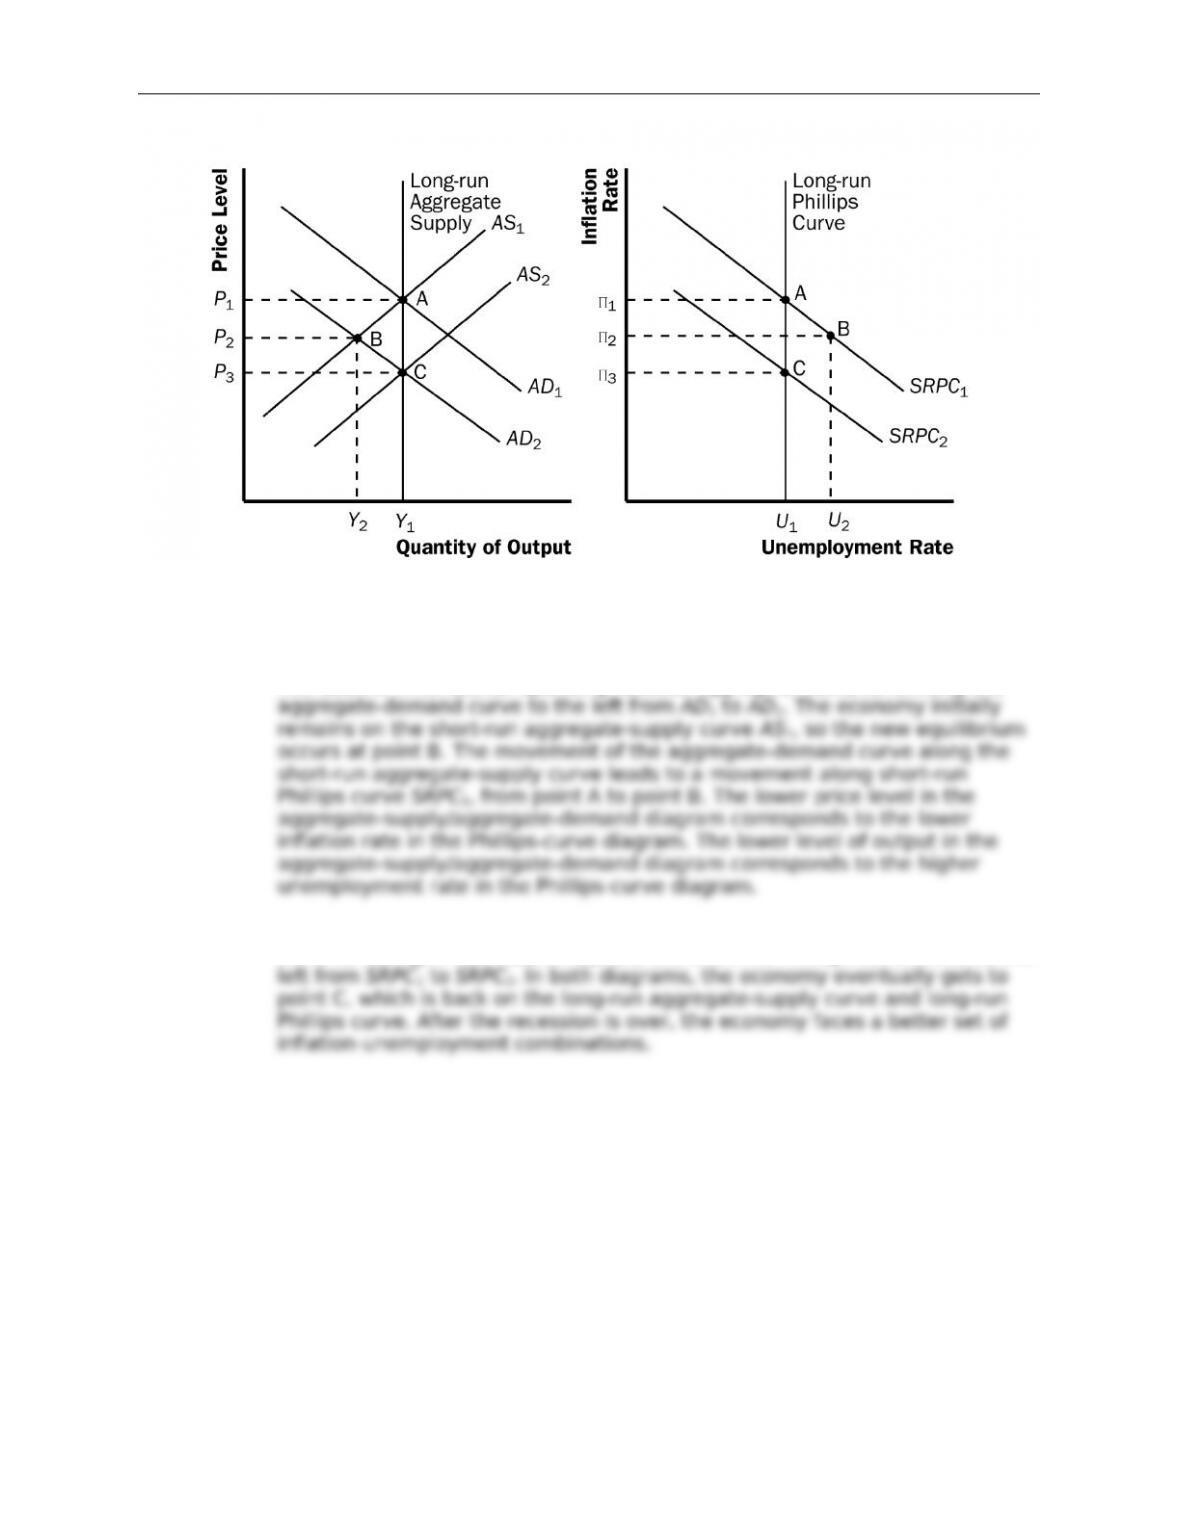
3. a. Figure 13 shows how a reduction in consumer spending causes a recession in
both an aggregate-supply/aggregate-demand diagram and a Phillips-curve
diagram. In both diagrams, the economy begins at full employment at point A.
The decline in consumer spending reduces aggregate demand, shifting the
b. As expected ination falls over time, the short-run aggregate-supply curve
shifts to the right from AS1 to AS2, and the short-run Phillips curve shifts to the
© 2018 Cengage Learning®. May not be scanned, copied or duplicated, or posted to a publicly accessible website,
in whole or in part, except for use as permitted in a license distributed with a certain product or service or otherwise
on a password-protected website or school-approved learning management system for classroom use.
Chapter 35/The Short-Run Trade-o( between Ination and Unemployment ❖ 597
Figure 14
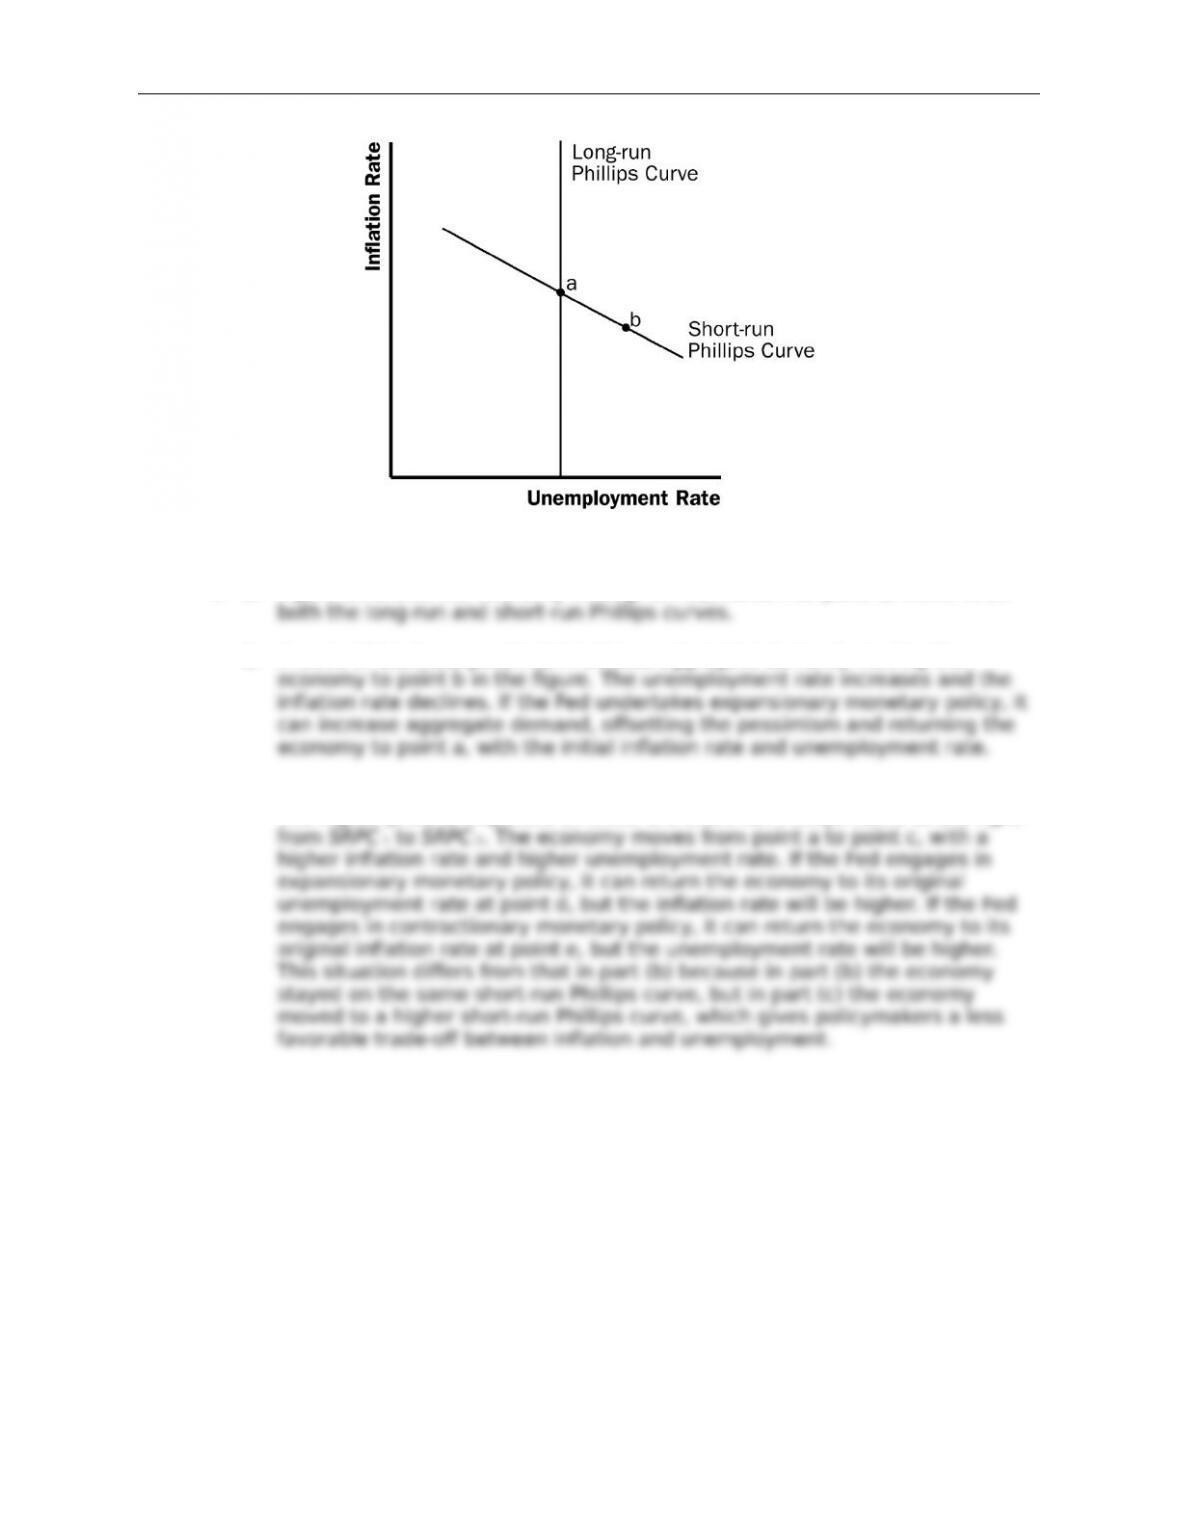
4. a. Figure 14 shows the economy in long-run equilibrium at point a, which is on
b. A wave of business pessimism reduces aggregate demand, moving the
c. Figure 15 shows the e(ects on the economy if the price of imported oil rises.
The higher price of imported oil shifts the short-run Phillips curve to the right
© 2018 Cengage Learning®. May not be scanned, copied or duplicated, or posted to a publicly accessible website,
in whole or in part, except for use as permitted in a license distributed with a certain product or service or otherwise
on a password-protected website or school-approved learning management system for classroom use.
Chapter 35/The Short-Run Trade-o( between Ination and Unemployment ❖ 598
Figure 15
5. Economists who believe that expectations adjust quickly in response to changes
Figure 16
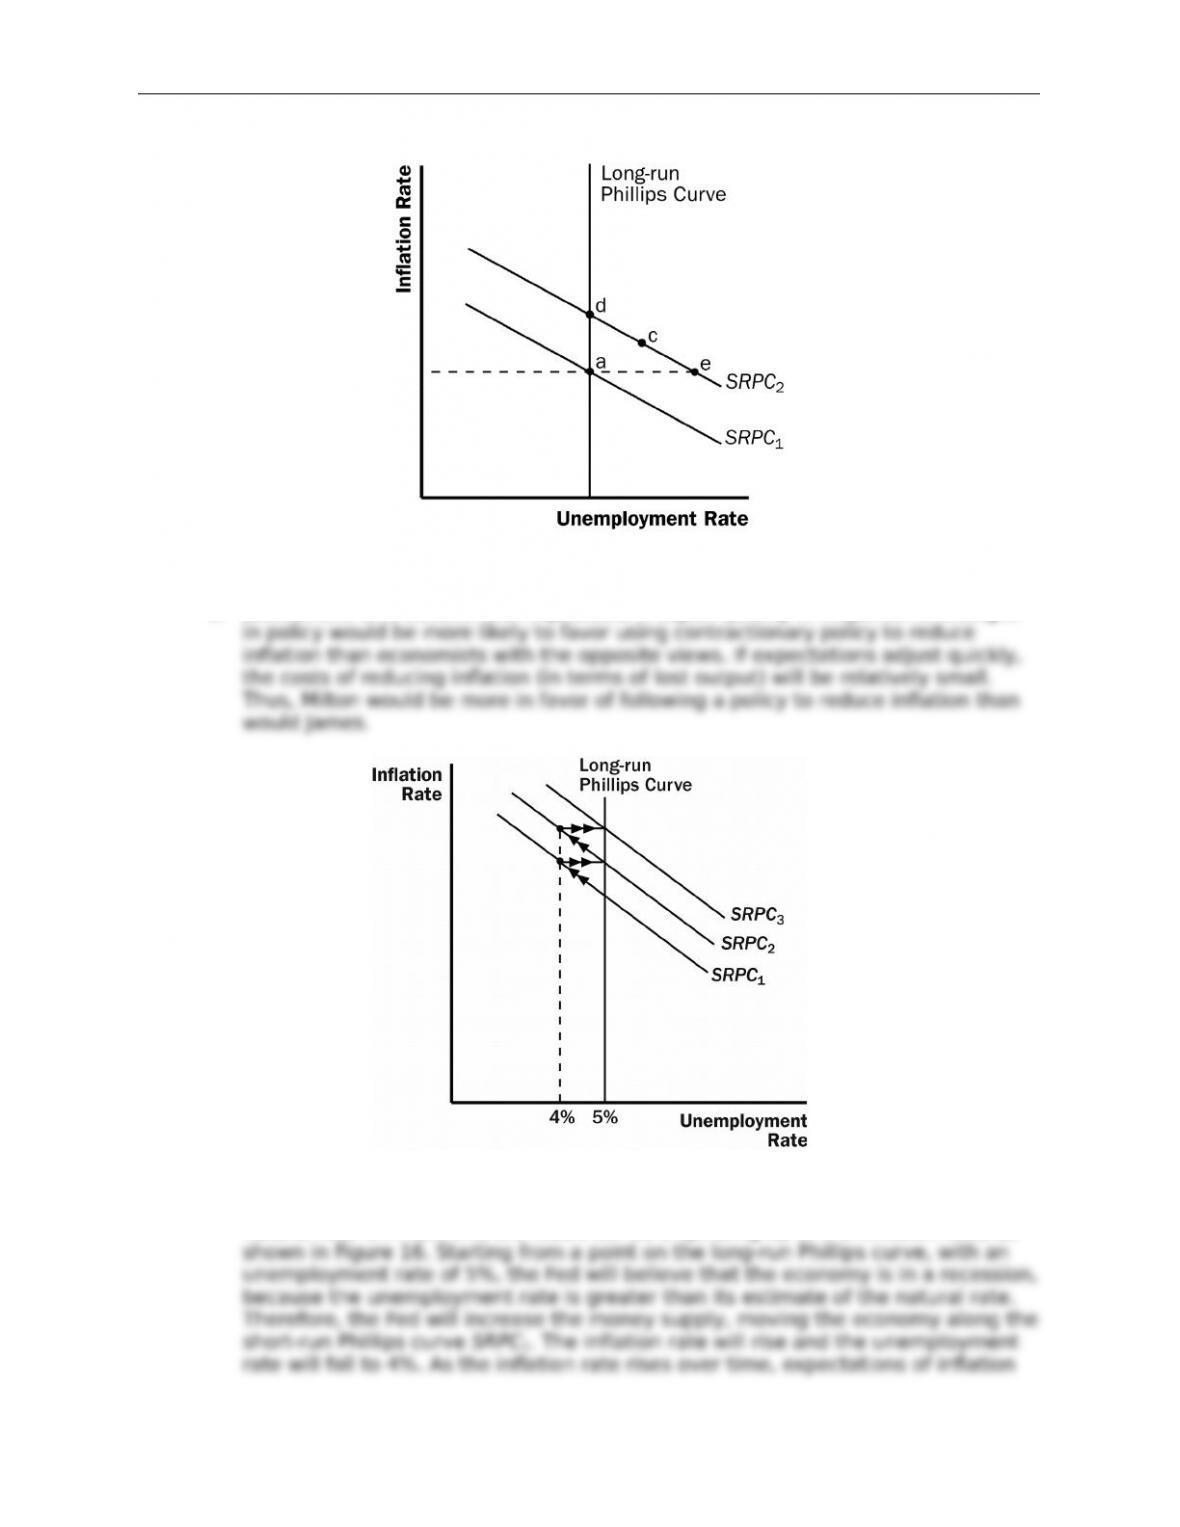
6. If the Fed acts on its belief that the natural rate of unemployment is 4%, when the
natural rate is in fact 5%, the result will be a spiraling up of the ination rate, as
© 2018 Cengage Learning®. May not be scanned, copied or duplicated, or posted to a publicly accessible website,
in whole or in part, except for use as permitted in a license distributed with a certain product or service or otherwise
on a password-protected website or school-approved learning management system for classroom use.

Chapter 35/The Short-Run Trade-o( between Ination and Unemployment ❖ 599
7. a. If wage contracts have short durations, a recession induced by contractionary
monetary policy will be less severe, because wage contracts can be adjusted
b. If there is little con:dence in the Fed’s determination to reduce ination, a
c. If expectations of ination adjust quickly to actual ination, a recession
Figure 17
8. a. As shown in the left diagram of Figure 17, equilibrium output and employment
b. The Fed would have to use expansionary monetary policy to keep output and
c. The Fed may not want to pursue this action because it will lead to a rise in the
© 2018 Cengage Learning®. May not be scanned, copied or duplicated, or posted to a publicly accessible website,
in whole or in part, except for use as permitted in a license distributed with a certain product or service or otherwise
on a password-protected website or school-approved learning management system for classroom use.
AS2
AS1
AD3
AD2
AD1
SRPC
1
SRPC
2
•A
•B
•C
• C
• B
• A
Long-Run
Phillips Curve
Long-Run
Aggregate
Supply
Price
Level
Ination
Rate
Unemployment
Rate
Quantity of Output