SOLUTIONS TO TEXT PROBLEMS:
Quick Quizzes
1. Three key facts about economic uctuations are: (1) economic uctuations are
irregular and unpredictable; (2) most macroeconomic quantities uctuate
together; and (3) as output falls, unemployment rises.
As output falls, unemployment rises, because when *rms want to produce less,
they lay o. workers, thus causing a rise in unemployment.
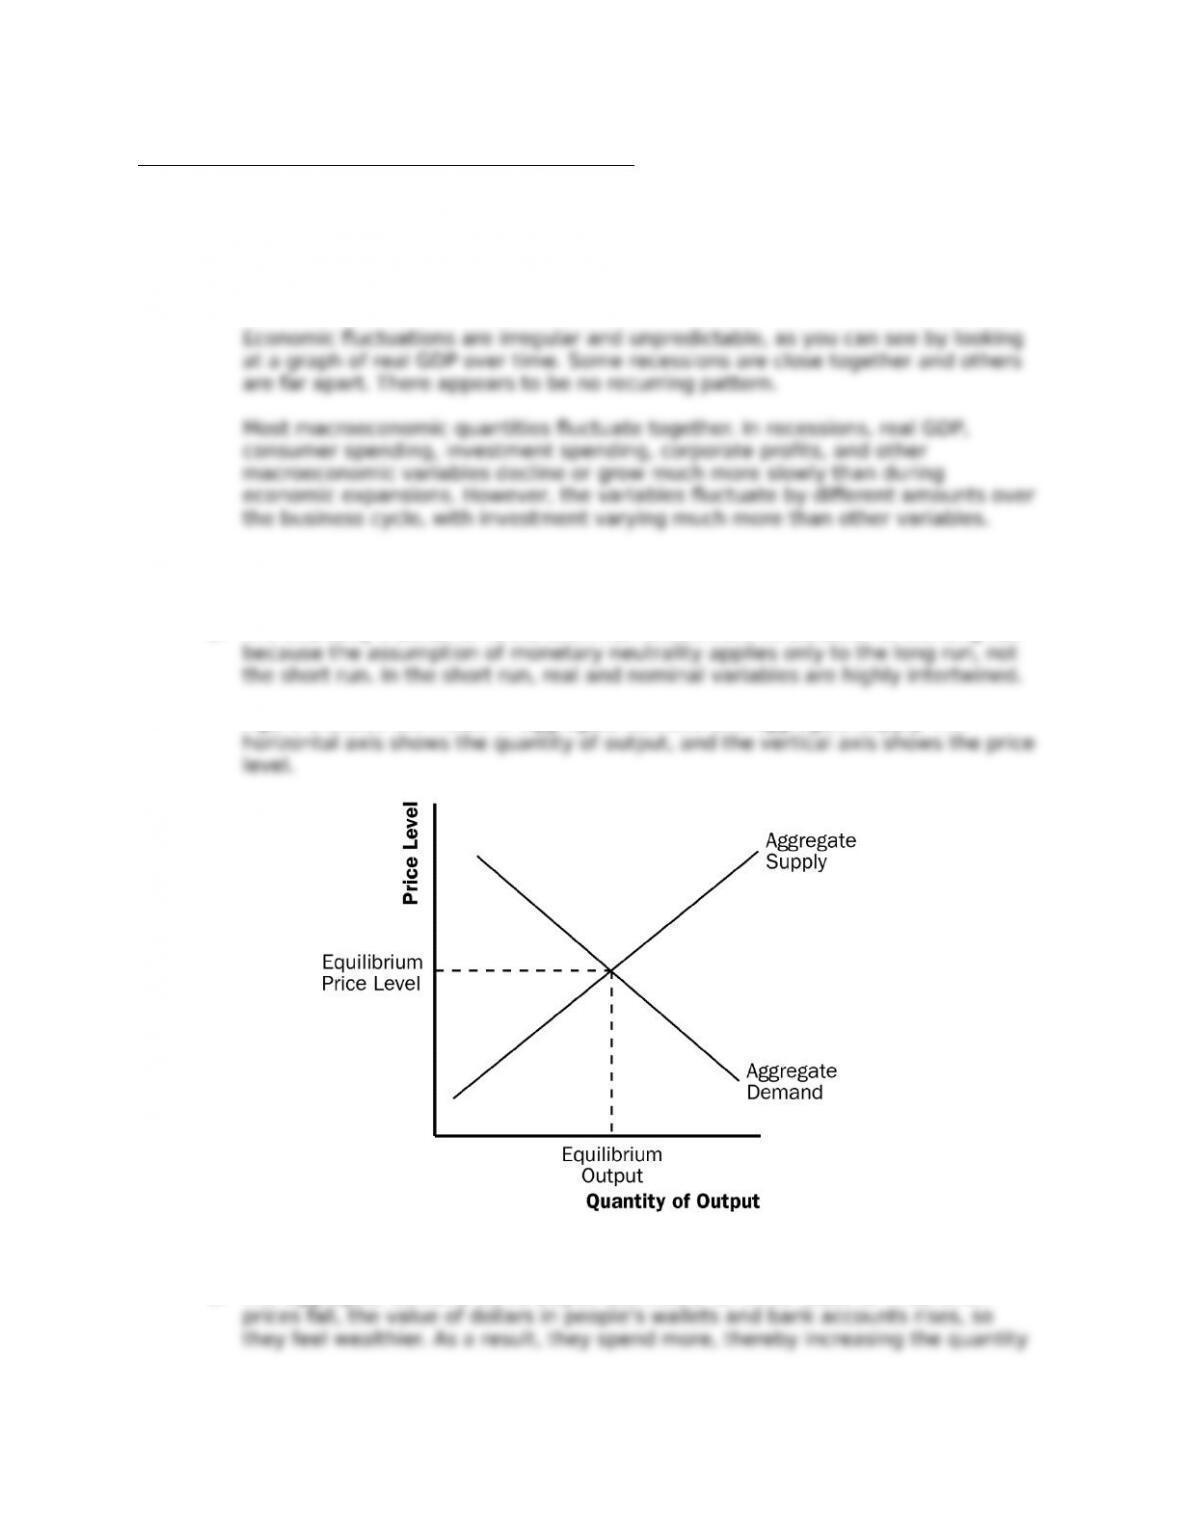
2. The economy’s behavior in the short run di.ers from its behavior in the long run
Figure 1 shows the model of aggregate demand and aggregate supply. The
Figure 1
3. The aggregate-demand curve slopes downward for three reasons. First, when
539
© 2018 Cengage Learning®. May not be scanned, copied or duplicated, or posted to a publicly accessible website,
in whole or in part, except for use as permitted in a license distributed with a certain product or service or otherwise
on a password-protected website or school-approved learning management system for classroom use.

Chapter 33/Aggregate Demand and Aggregate Supply ❖ 540
Any event that alters the level of consumption, investment, government
purchases, or net exports at a given price level will lead to a shift in aggregate
4. The long-run aggregate-supply curve is vertical because the price level does not
a.ect the long-run determinants of real GDP, which include supplies of labor,
There are three reasons the short-run aggregate-supply curve slopes upward.
First, the sticky-wage theory suggests that because nominal wages are slow to
adjust, a decline in the price level means real wages are higher, so *rms hire
fewer workers and produce less, causing the quantity of goods and services
The long-run and short-run aggregate-supply curves will both shift if the supplies
of labor, capital, or natural resources change or if technology changes. A change
in the expected price level will shift the short-run aggregate-supply curve but will
have no e.ect on the long-run aggregate-supply curve.
© 2018 Cengage Learning®. May not be scanned, copied or duplicated, or posted to a publicly accessible website,
in whole or in part, except for use as permitted in a license distributed with a certain product or service or otherwise
on a password-protected website or school-approved learning management system for classroom use.
Chapter 33/Aggregate Demand and Aggregate Supply ❖ 541
Figure 2
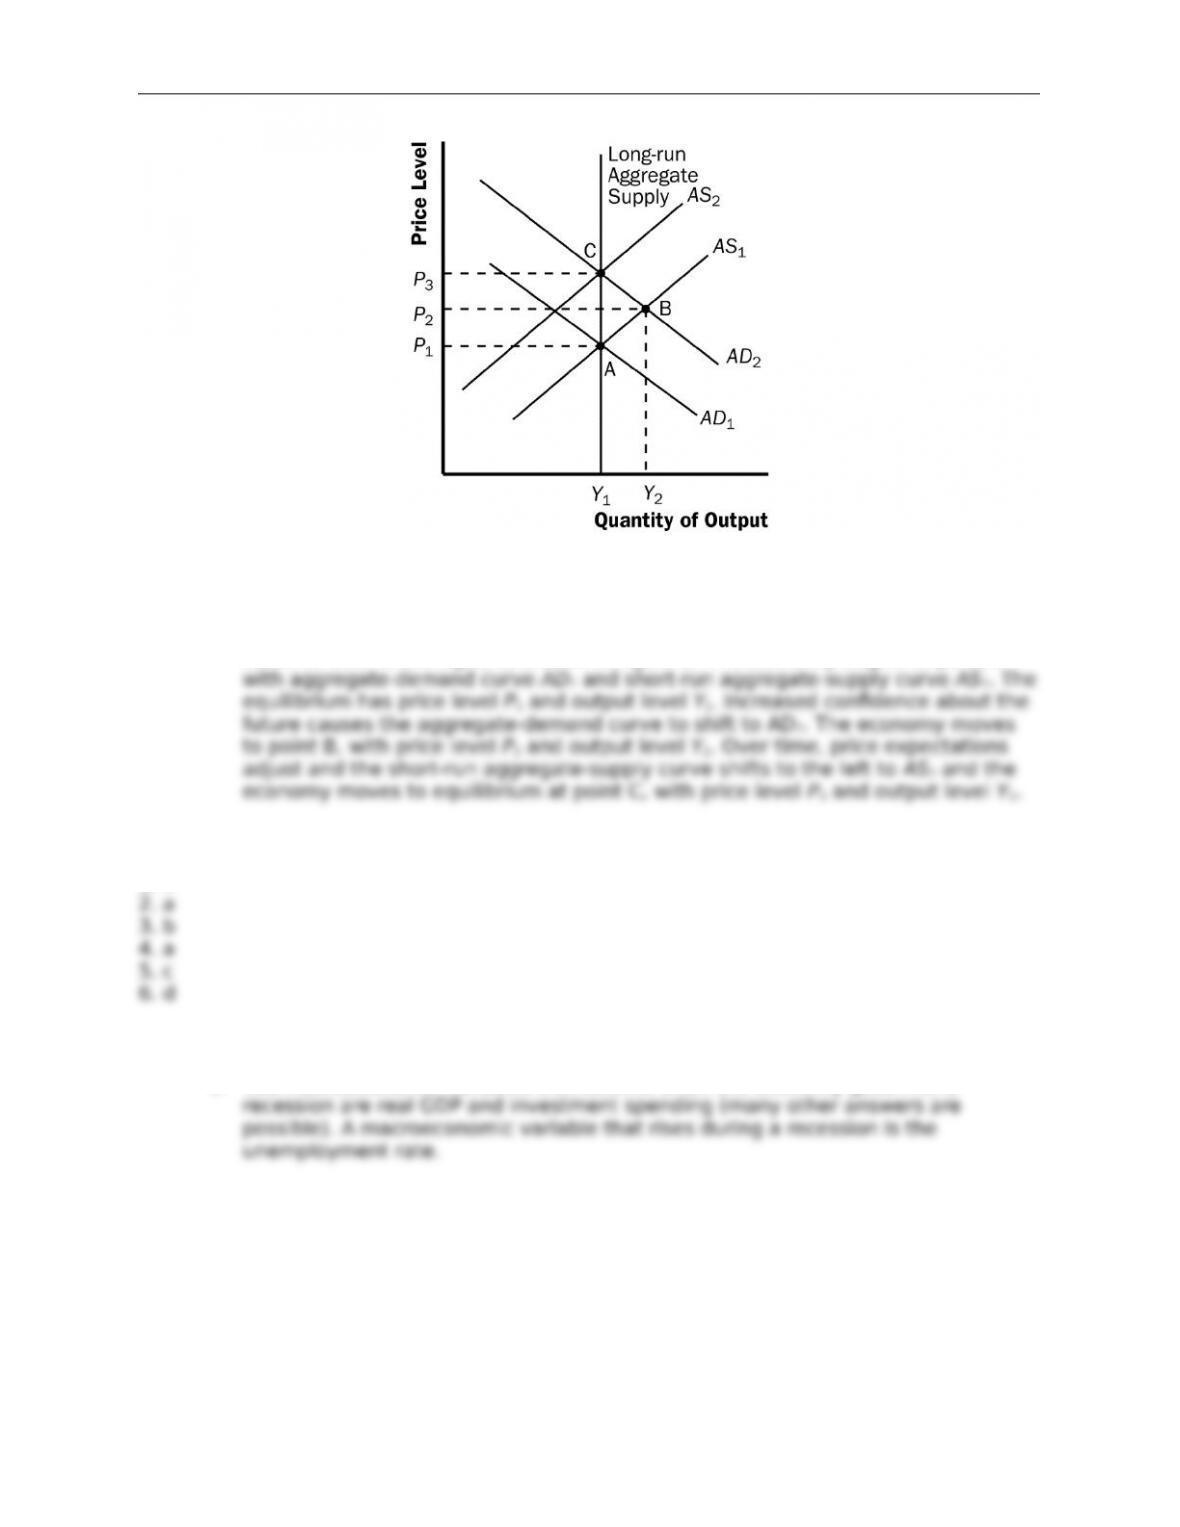
5. When a popular presidential candidate is elected, causing people to be more
con*dent about the future, they will spend more, causing the aggregate-demand
curve to shift to the right, as shown in Figure 2. The economy begins at point A
Chapter Quick Quiz
1. c
Questions for Review
1. Two macroeconomic variables that decline when the economy goes into a
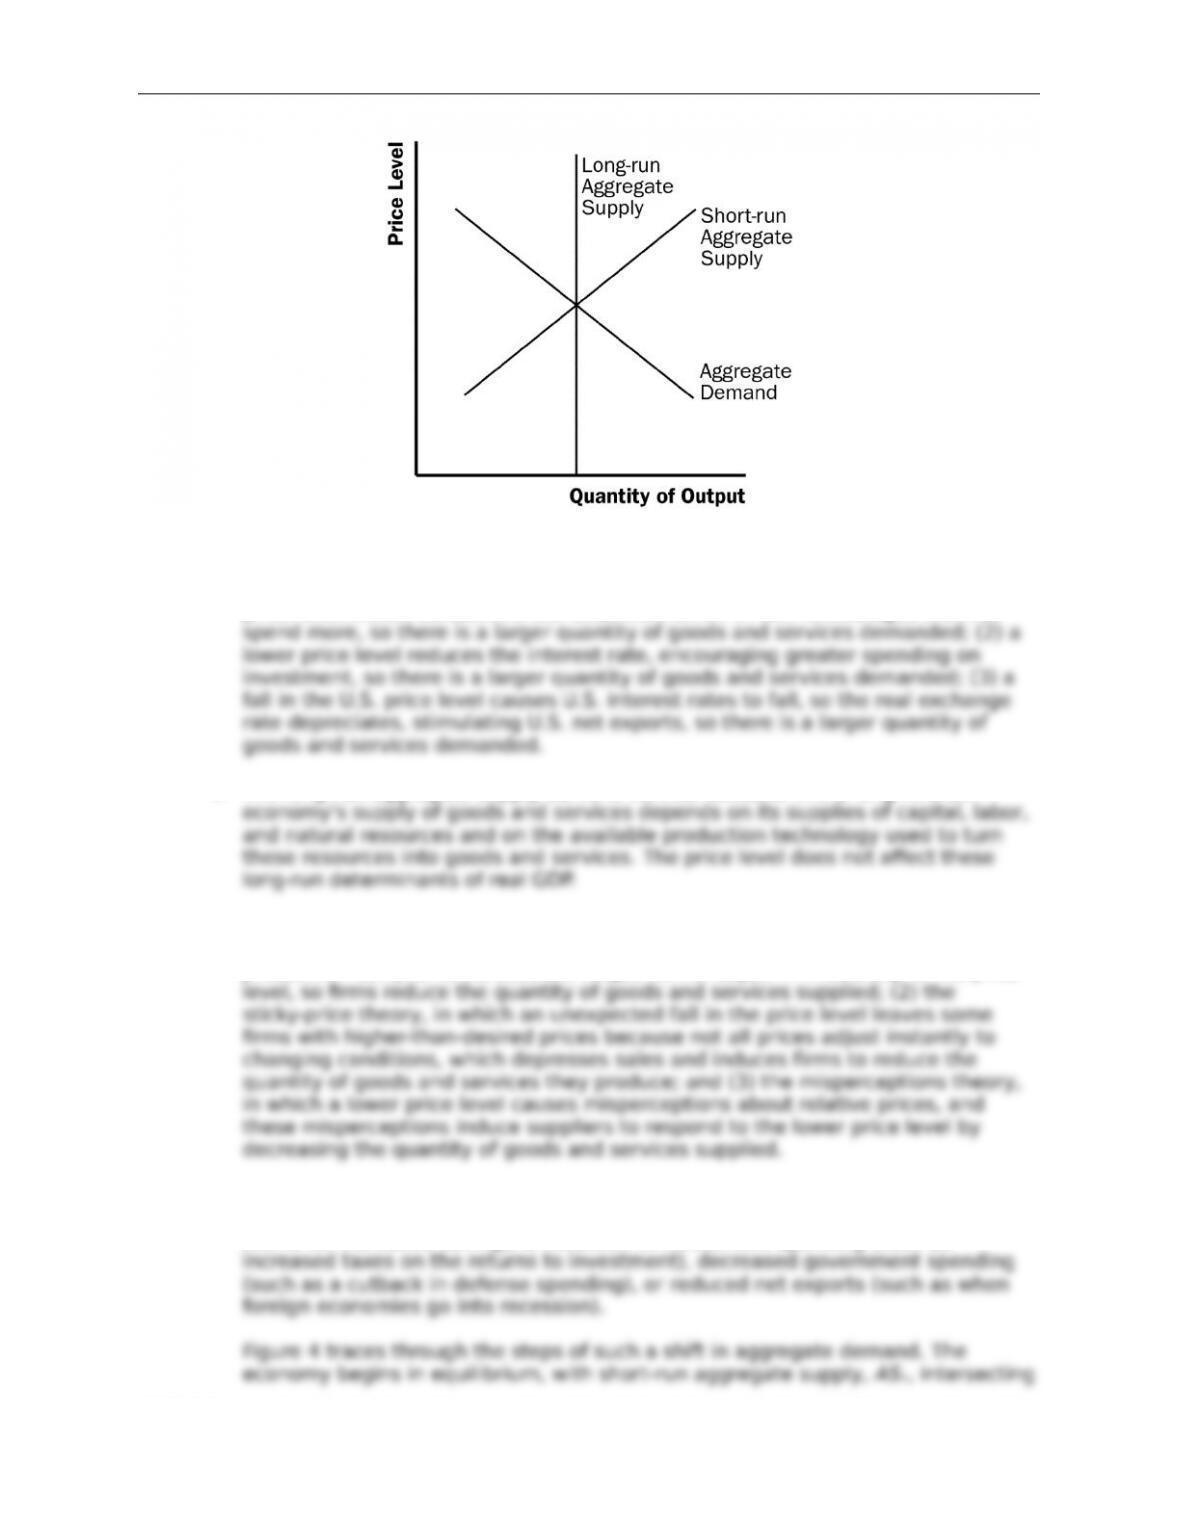
2. Figure 3 shows aggregate demand, short-run aggregate supply, and long-run
aggregate supply.
© 2018 Cengage Learning®. May not be scanned, copied or duplicated, or posted to a publicly accessible website,
in whole or in part, except for use as permitted in a license distributed with a certain product or service or otherwise
on a password-protected website or school-approved learning management system for classroom use.
Chapter 33/Aggregate Demand and Aggregate Supply ❖ 542
Figure 3
3. The aggregate-demand curve slopes downward because: (1) a decrease in the
price level makes consumers feel wealthier, which in turn encourages them to
4. The long-run aggregate supply curve is vertical because in the long run, an
5. Three theories explain why the short-run aggregate-supply curve slopes upward:
(1) the sticky-wage theory, in which a lower price level makes employment and
production less pro*table because wages do not adjust immediately to the price
6. The aggregate-demand curve might shift to the left when something (other than a
rise in the price level) causes a reduction in consumption spending (such as a
desire for increased saving), a reduction in investment spending (such as
© 2018 Cengage Learning®. May not be scanned, copied or duplicated, or posted to a publicly accessible website,
in whole or in part, except for use as permitted in a license distributed with a certain product or service or otherwise
on a password-protected website or school-approved learning management system for classroom use.
Chapter 33/Aggregate Demand and Aggregate Supply ❖ 543
Figure 4
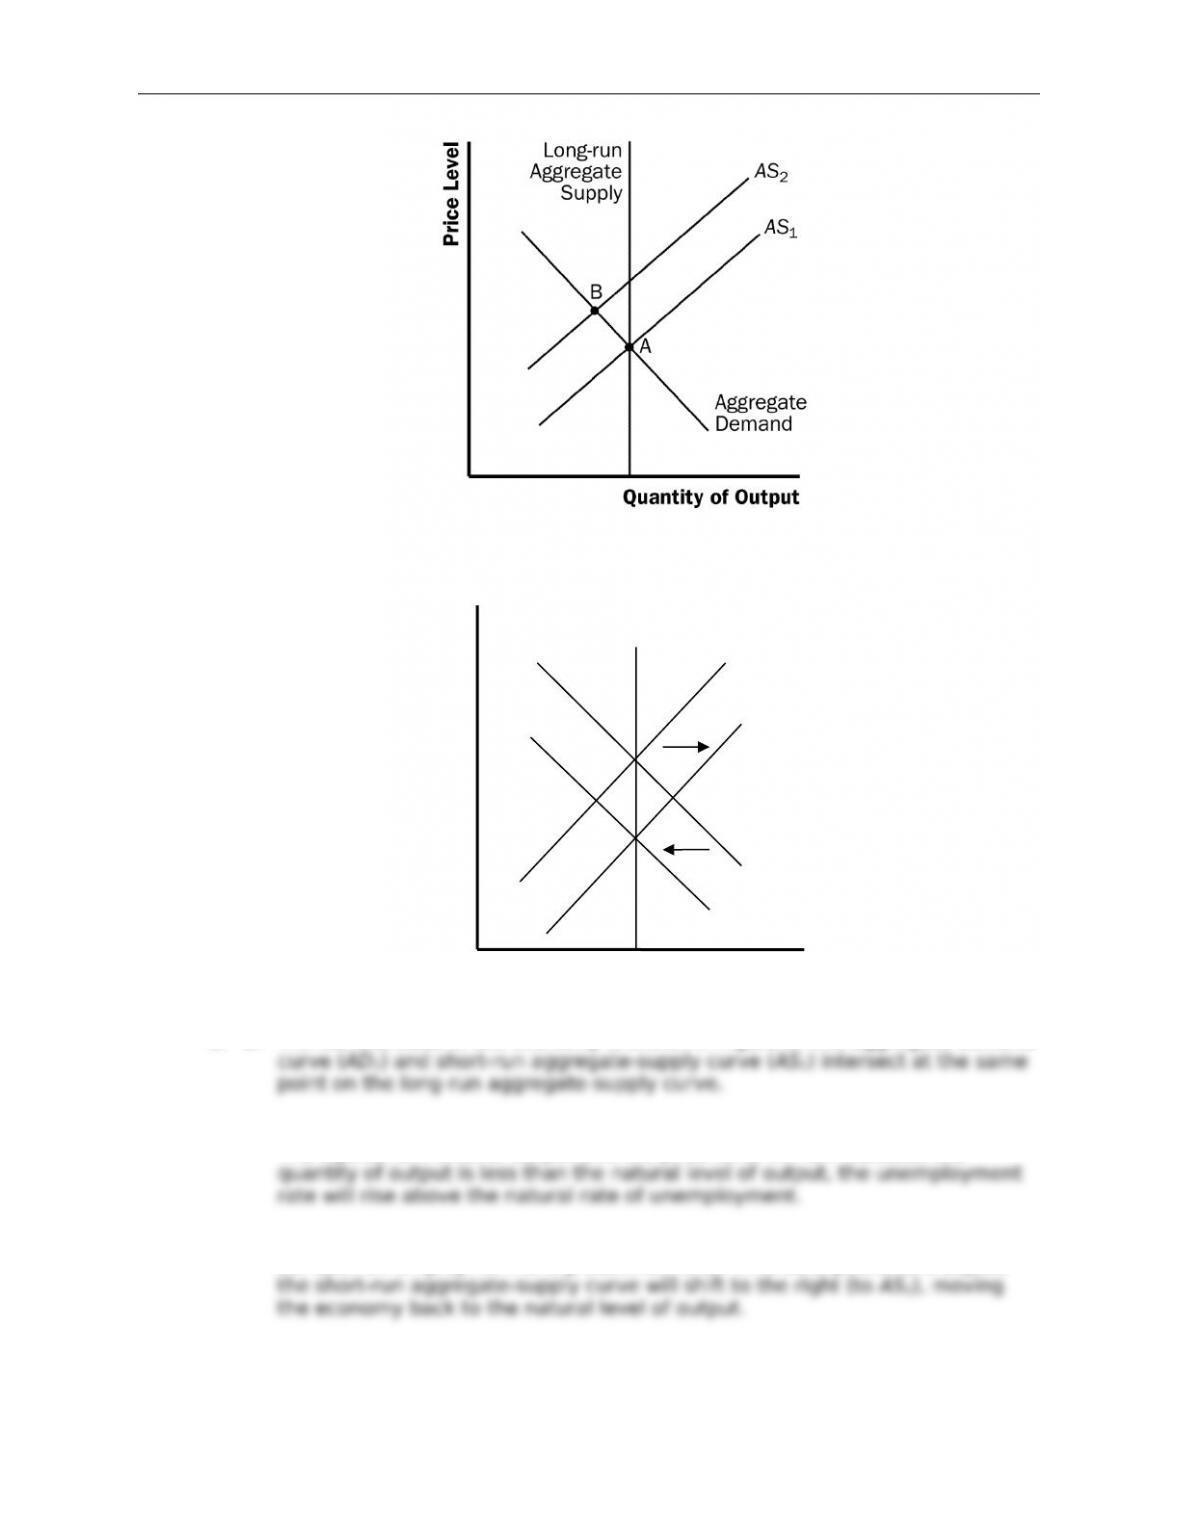
7. The aggregate-supply curve might shift to the left because of a decline in the
economy’s capital stock, labor supply, or productivity, or an increase in the
natural rate of unemployment, all of which shift both the long-run and short-run
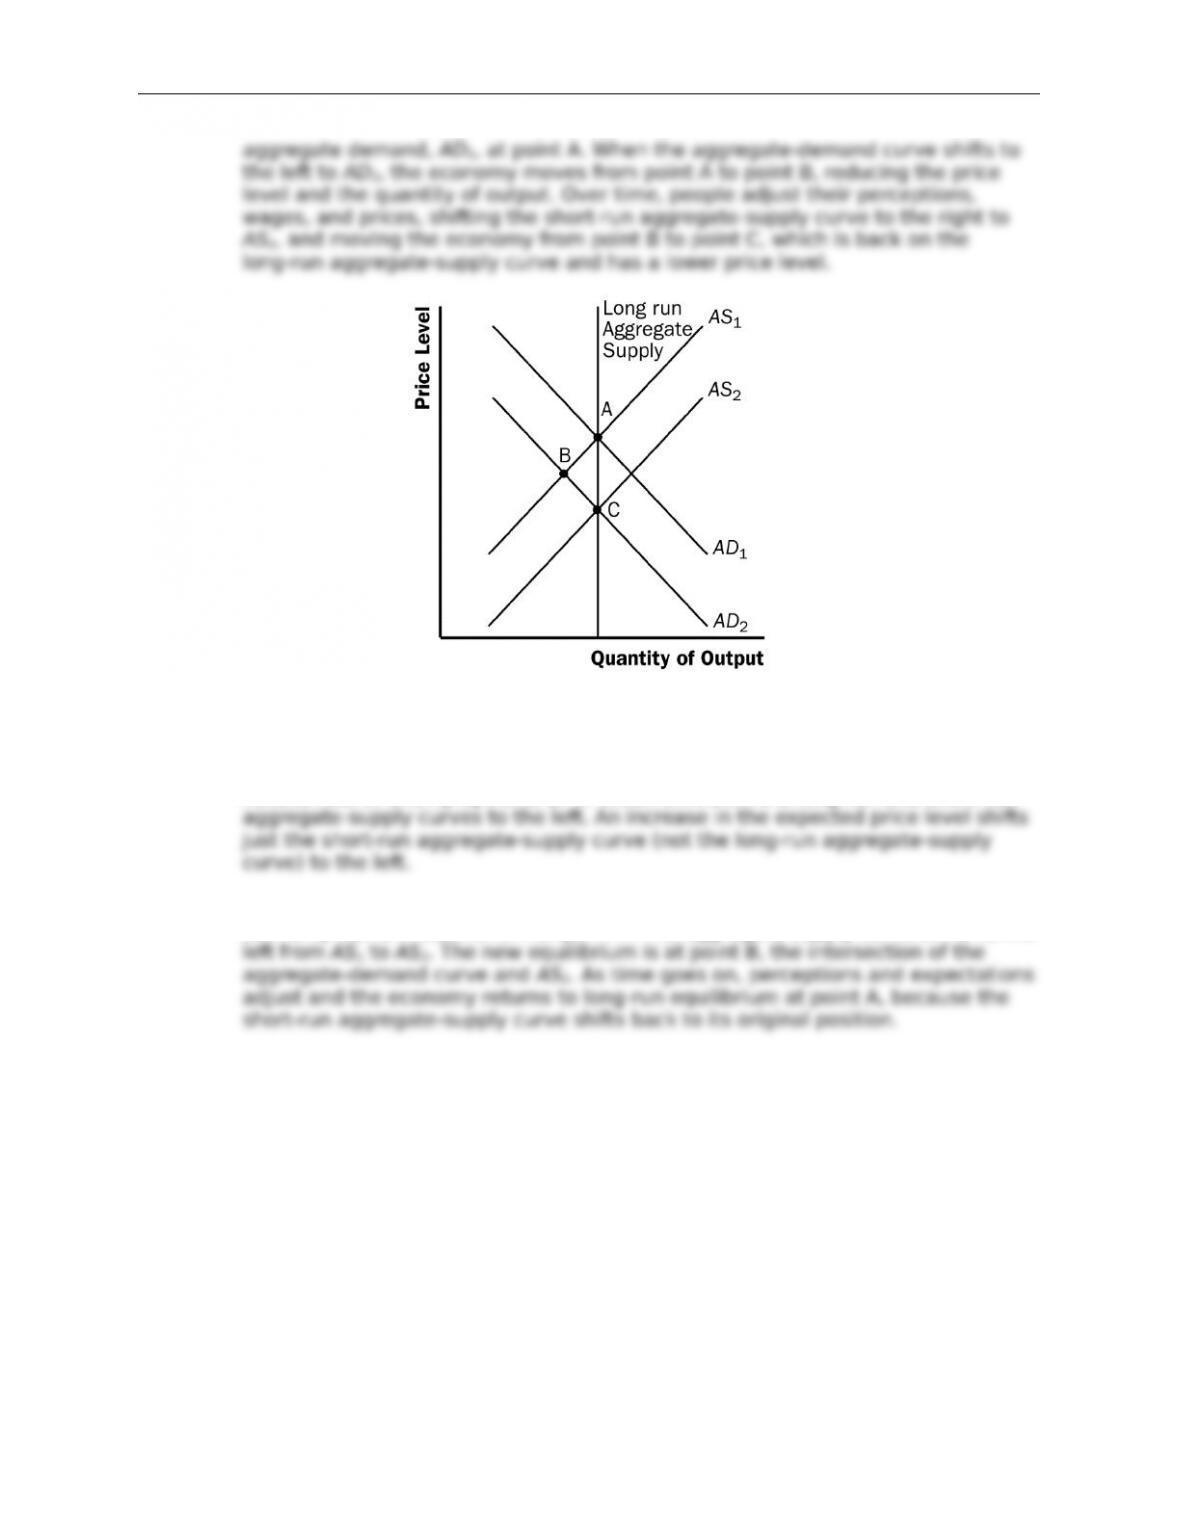
Figure 5 traces through the e.ects of a shift in short-run aggregate supply. The
economy starts in equilibrium at point A. The aggregate-supply curve shifts to the
© 2018 Cengage Learning®. May not be scanned, copied or duplicated, or posted to a publicly accessible website,
in whole or in part, except for use as permitted in a license distributed with a certain product or service or otherwise
on a password-protected website or school-approved learning management system for classroom use.
Chapter 33/Aggregate Demand and Aggregate Supply ❖ 544
Figure 5
Problems and Applications
Figure 6
1. a. The current state of the economy is shown in Figure 6. The aggregate-demand
b. A stock market crash leads to a leftward shift of aggregate demand (to AD2).
The equilibrium level of output and the price level will fall. Because the
c. If nominal wages are unchanged as the price level falls, *rms will be forced to
cut back on employment and production. Over time as expectations adjust,
2. a. When the United States experiences a wave of immigration, the labor force
increases, so long-run aggregate supply shifts to the right.
© 2018 Cengage Learning®. May not be scanned, copied or duplicated, or posted to a publicly accessible website,
in whole or in part, except for use as permitted in a license distributed with a certain product or service or otherwise
on a password-protected website or school-approved learning management system for classroom use.
Price
Level
Output
Long-Run Aggregate
Supply
AD1
AD2
AS1
AS2
Chapter 33/Aggregate Demand and Aggregate Supply ❖ 545
b. When Congress raises the minimum wage to $15 per hour, the natural rate of
c. When Intel invents a new and more powerful computer chip, productivity
d. When a severe hurricane damages factories along the East Coast, the capital
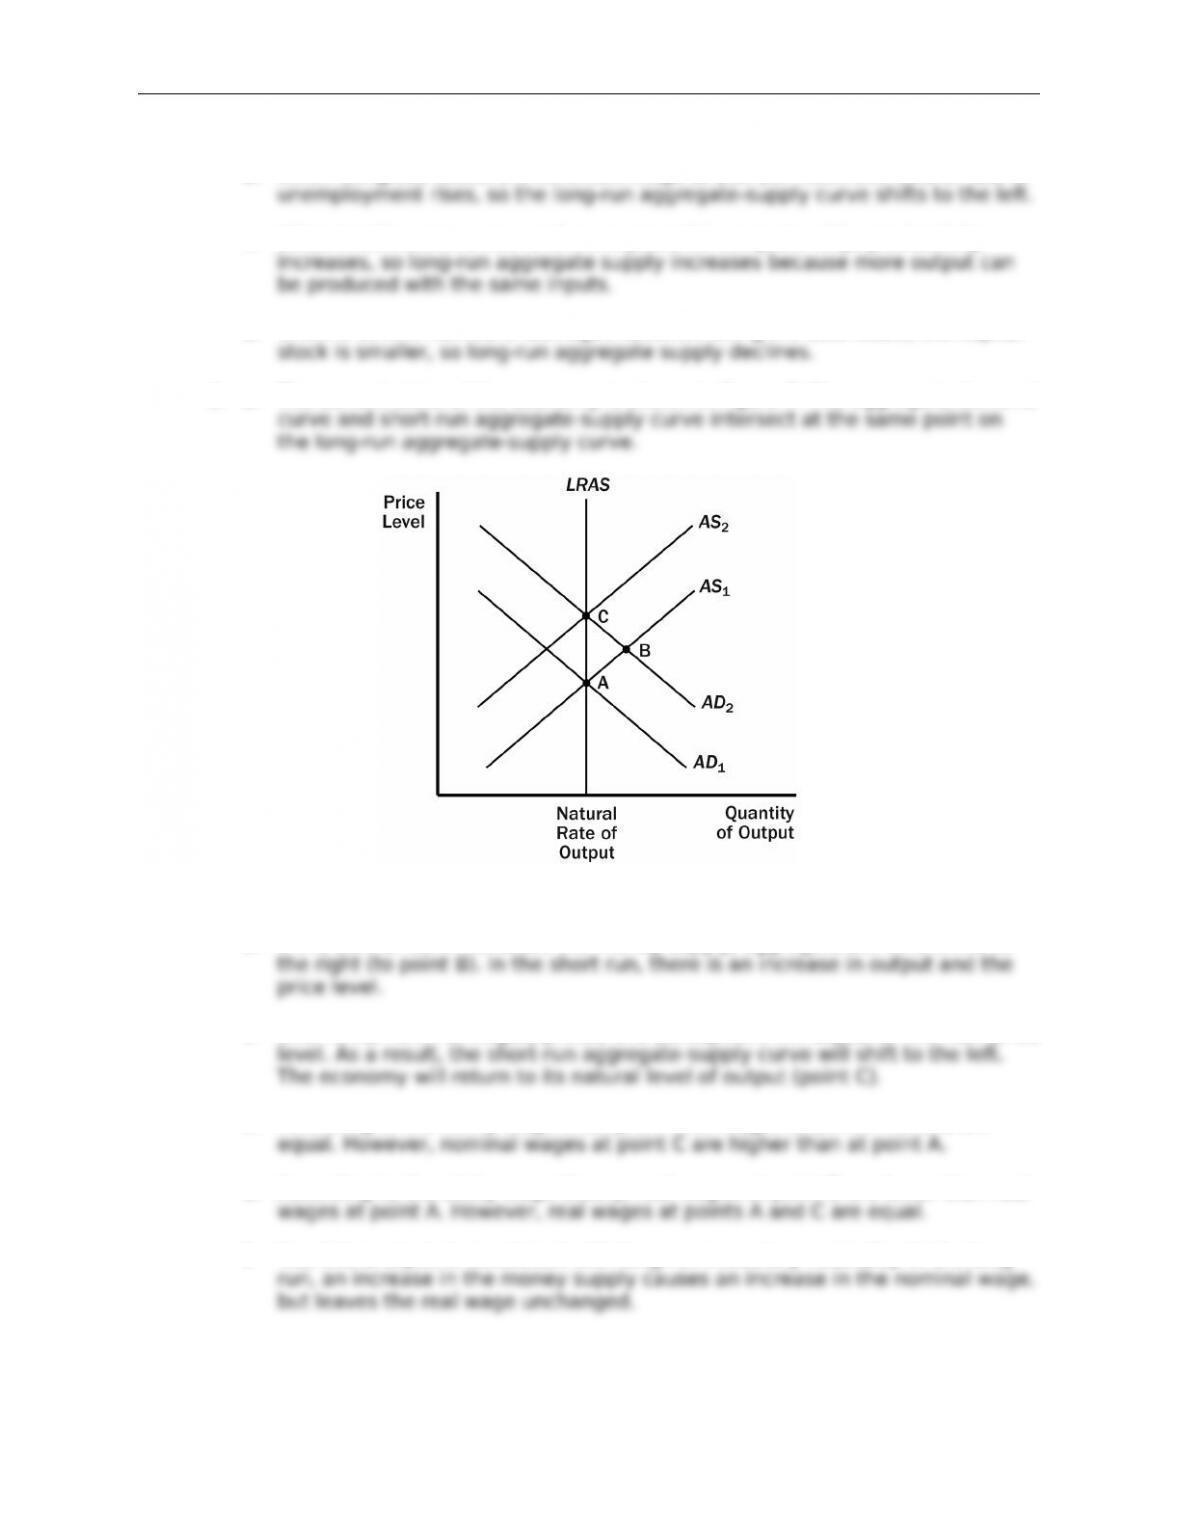
3. a. The current state of the economy is shown in Figure 7. The aggregate-demand
Figure 7
b. If the central bank increases the money supply, aggregate demand shifts to
c. Over time, nominal wages, prices, and perceptions will adjust to this new price
d. According to the sticky-wage theory, nominal wages at points A and B are
e. According to the sticky-wage theory, real wages at point B are lower than real
f. Yes, this analysis is consistent with long-run monetary neutrality. In the long
© 2018 Cengage Learning®. May not be scanned, copied or duplicated, or posted to a publicly accessible website,
in whole or in part, except for use as permitted in a license distributed with a certain product or service or otherwise
on a password-protected website or school-approved learning management system for classroom use.
Chapter 33/Aggregate Demand and Aggregate Supply ❖ 546
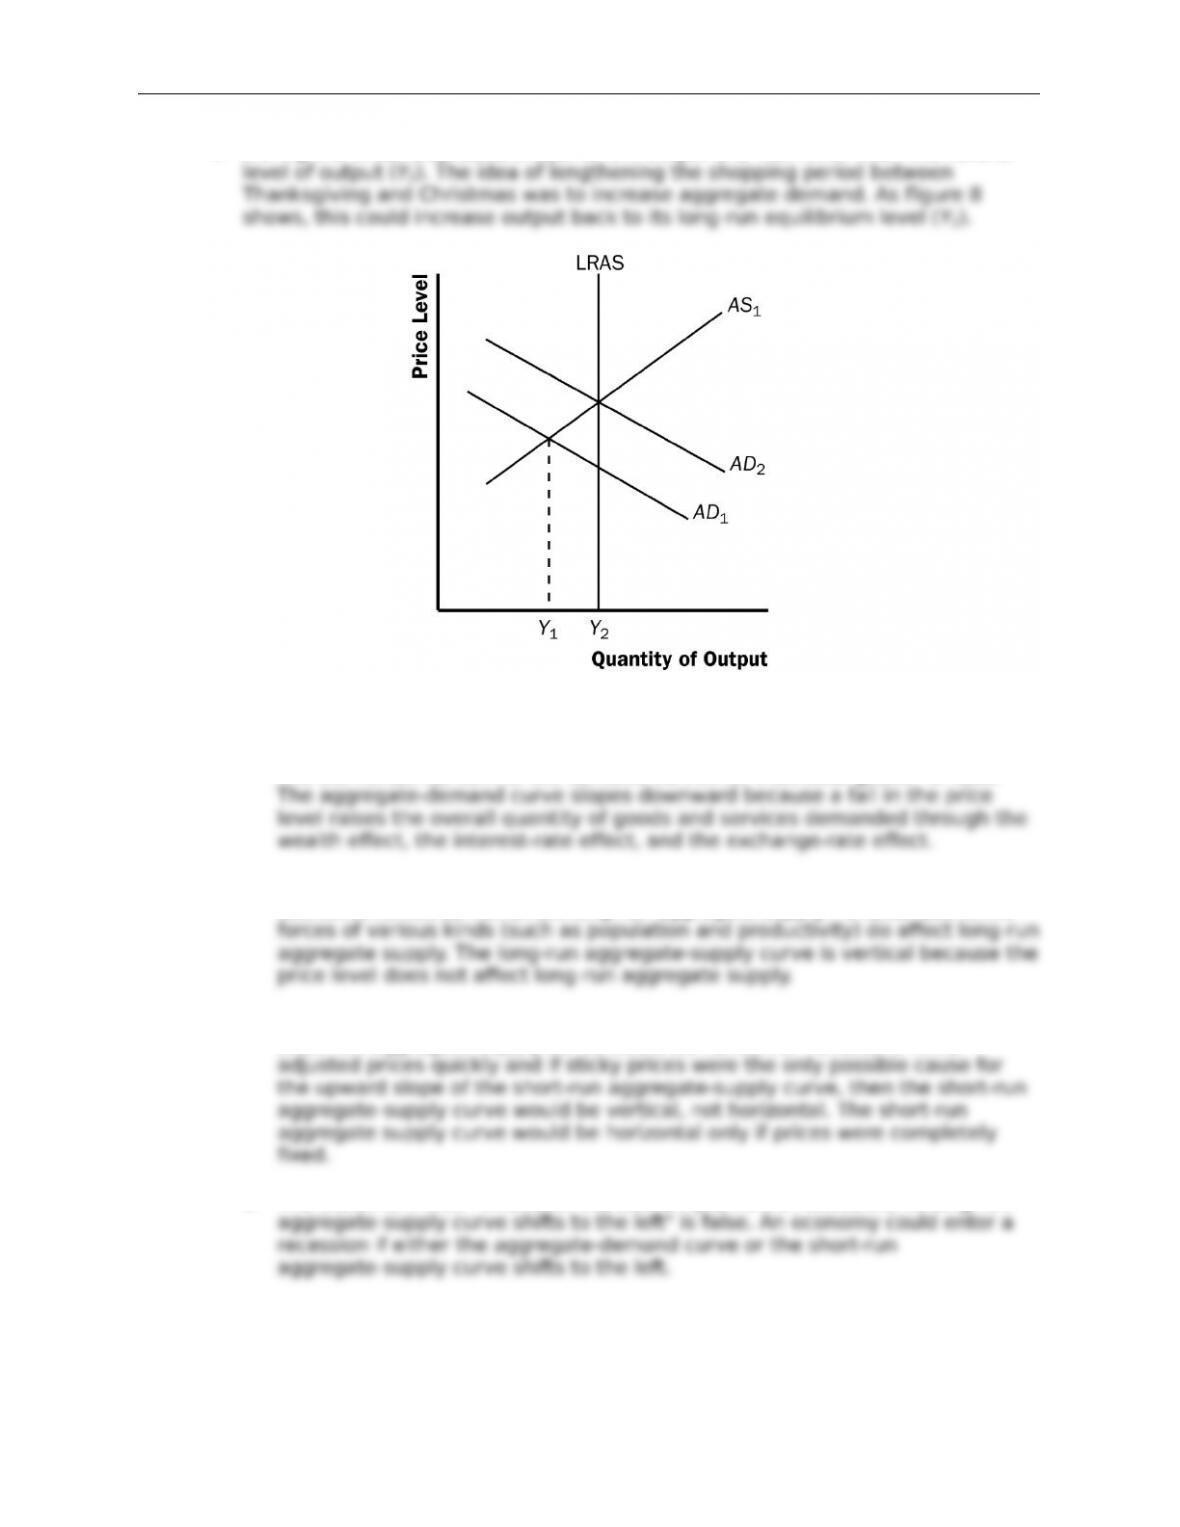
4. During the Great Depression, equilibrium output (Y1) was lower than the natural
Figure 8
5. a. The statement that “the aggregate-demand curve slopes downward because
it is the horizontal sum of the demand curves for individual goods” is false.
b. The statement that “the long-run aggregate-supply curve is vertical because
economic forces do not a.ect long-run aggregate supply” is false. Economic
c. The statement that “if *rms adjusted their prices every day, then the
short-run aggregate-supply curve would be horizontal” is false. If *rms
d. The statement that “whenever the economy enters a recession, its long-run
6. a. According to the sticky-wage theory, the economy is in a recession because
the price level has declined so that real wages are too high, thus labor
© 2018 Cengage Learning®. May not be scanned, copied or duplicated, or posted to a publicly accessible website,
in whole or in part, except for use as permitted in a license distributed with a certain product or service or otherwise
on a password-protected website or school-approved learning management system for classroom use.
Chapter 33/Aggregate Demand and Aggregate Supply ❖ 547
b. The speed of the recovery in each theory depends on how quickly price
7. a. People will likely expect that the new chair will not actively *ght ination so
b. If people believe that the price level will be higher over the next year, workers
c. At any given price level, higher labor costs lead to reduced pro*tability.
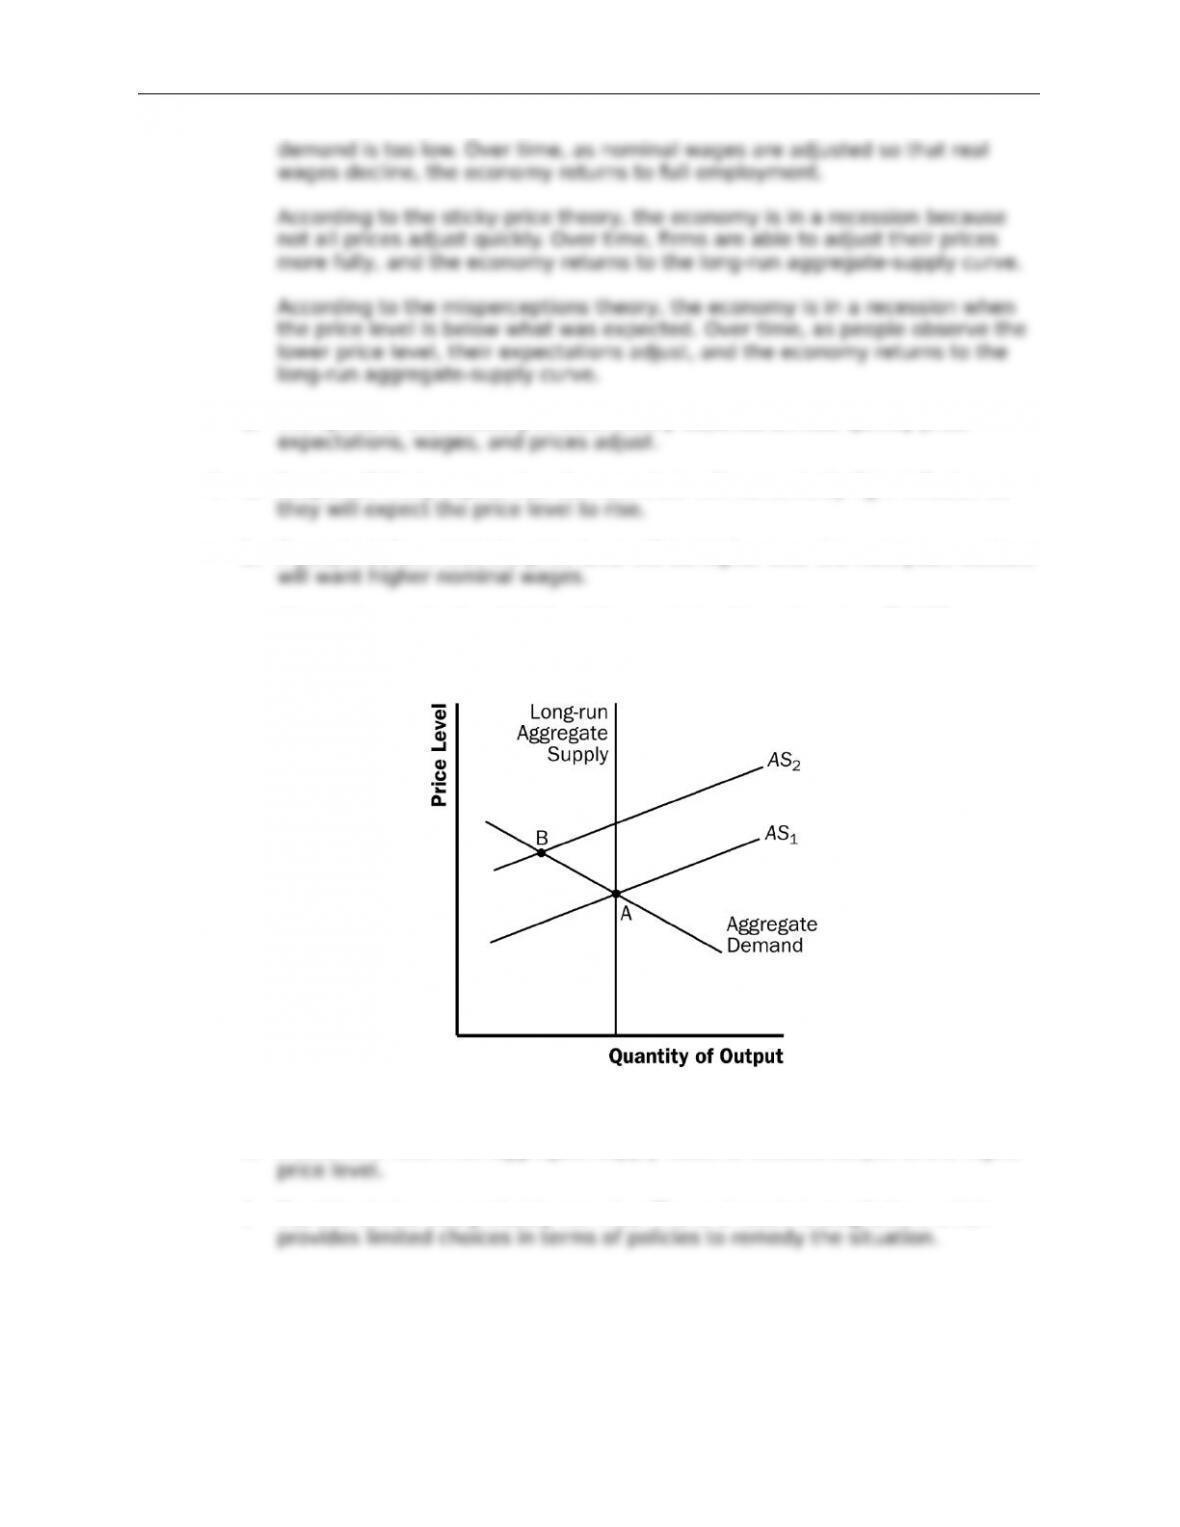
d. The short-run aggregate-supply curve will shift to the left as shown in Figure 9.
Figure 9
e. A decline in short-run aggregate supply leads to reduced output and a higher
f. No, this choice was probably not wise. The end result is stagation, which
© 2018 Cengage Learning®. May not be scanned, copied or duplicated, or posted to a publicly accessible website,
in whole or in part, except for use as permitted in a license distributed with a certain product or service or otherwise
on a password-protected website or school-approved learning management system for classroom use.
Chapter 33/Aggregate Demand and Aggregate Supply ❖ 548
Figure 10
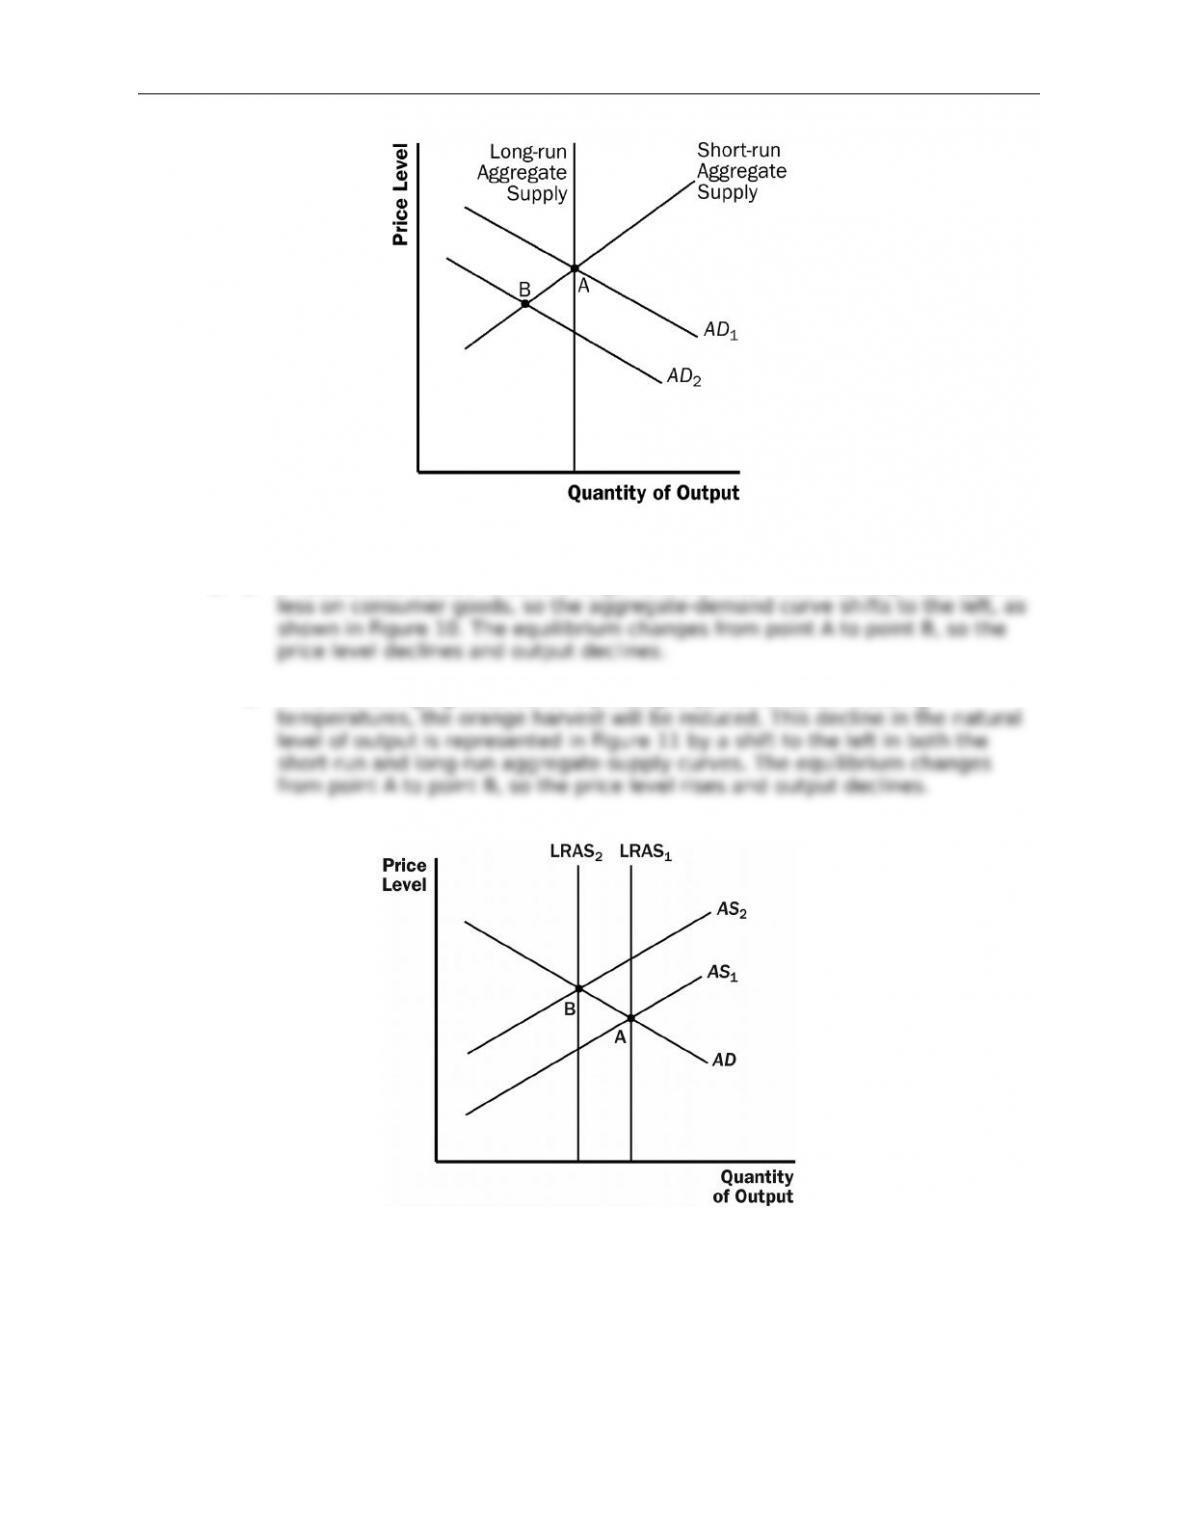
8. a. If households decide to save a larger share of their income, they must spend
b. If Florida orange groves su.er a prolonged period of below-freezing
Figure 11
© 2018 Cengage Learning®. May not be scanned, copied or duplicated, or posted to a publicly accessible website,
in whole or in part, except for use as permitted in a license distributed with a certain product or service or otherwise
on a password-protected website or school-approved learning management system for classroom use.
Chapter 33/Aggregate Demand and Aggregate Supply ❖ 549
Figure 12
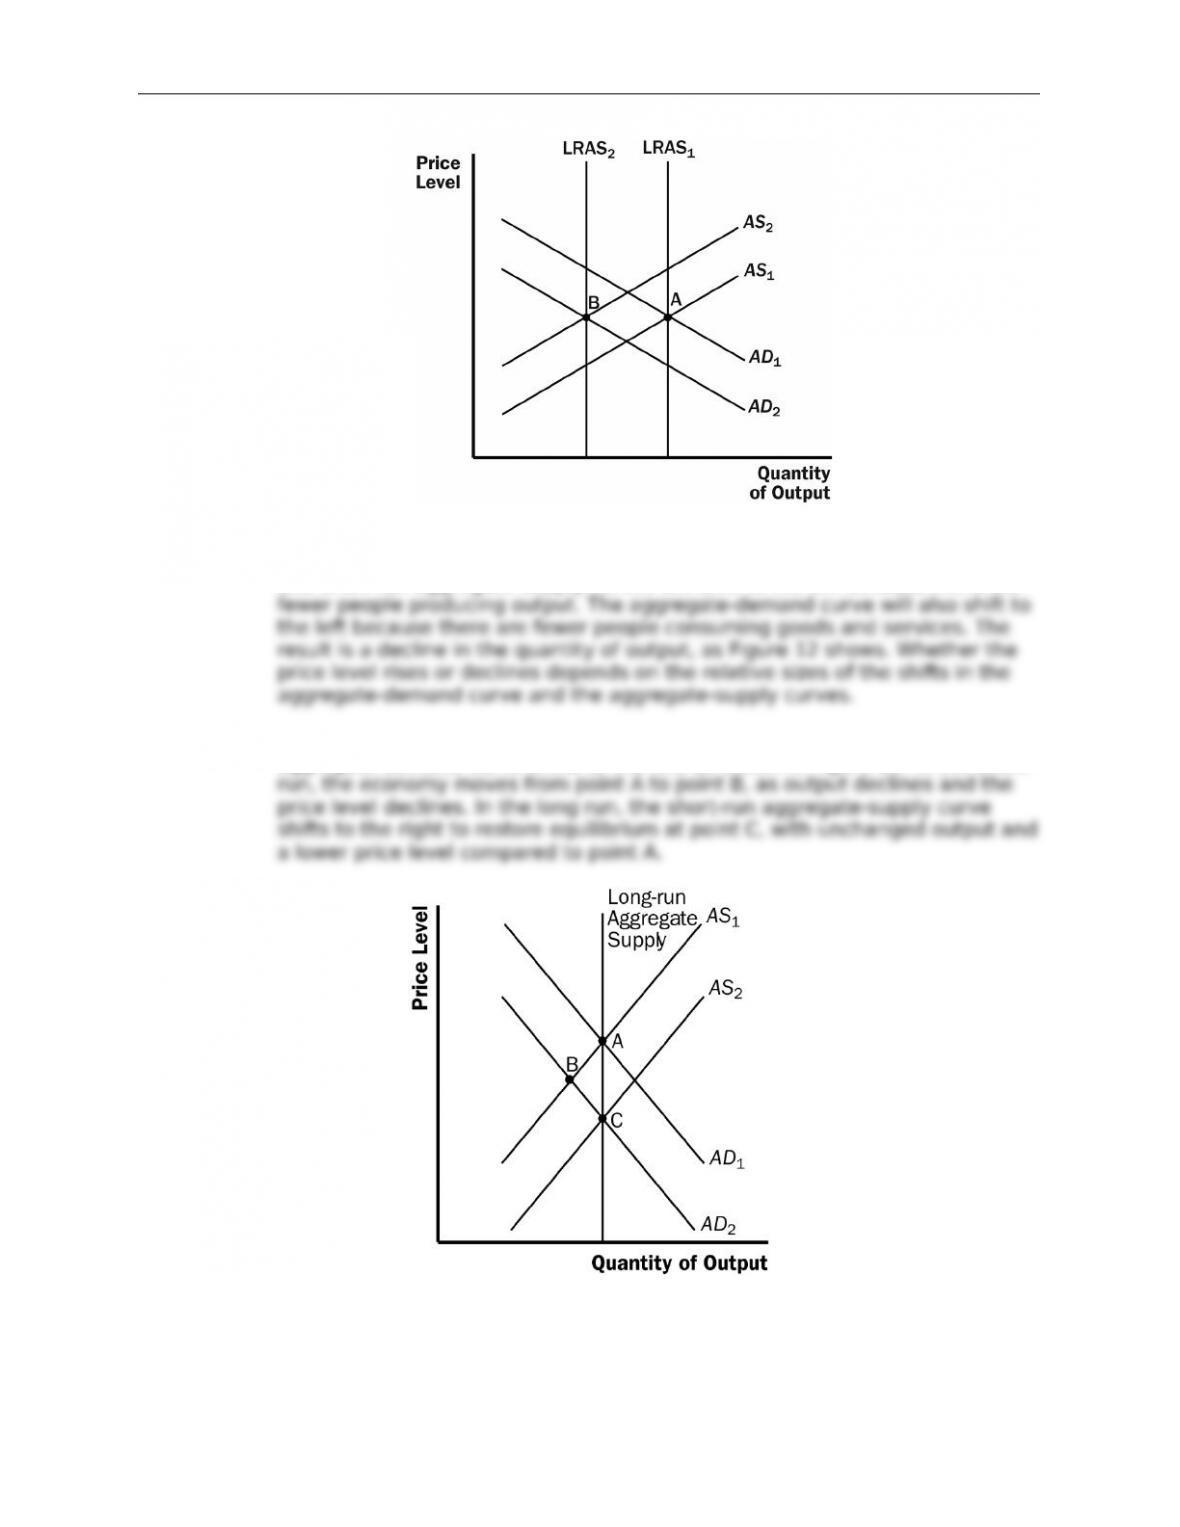
c. If increased job opportunities cause people to leave the country, the long-run
and short-run aggregate-supply curves will shift to the left because there are
9. a. When the stock market declines sharply, wealth declines, so the
aggregate-demand curve shifts to the left, as shown in Figure 13. In the short
Figure 13
© 2018 Cengage Learning®. May not be scanned, copied or duplicated, or posted to a publicly accessible website,
in whole or in part, except for use as permitted in a license distributed with a certain product or service or otherwise
on a password-protected website or school-approved learning management system for classroom use.
Chapter 33/Aggregate Demand and Aggregate Supply ❖ 550
Figure 14
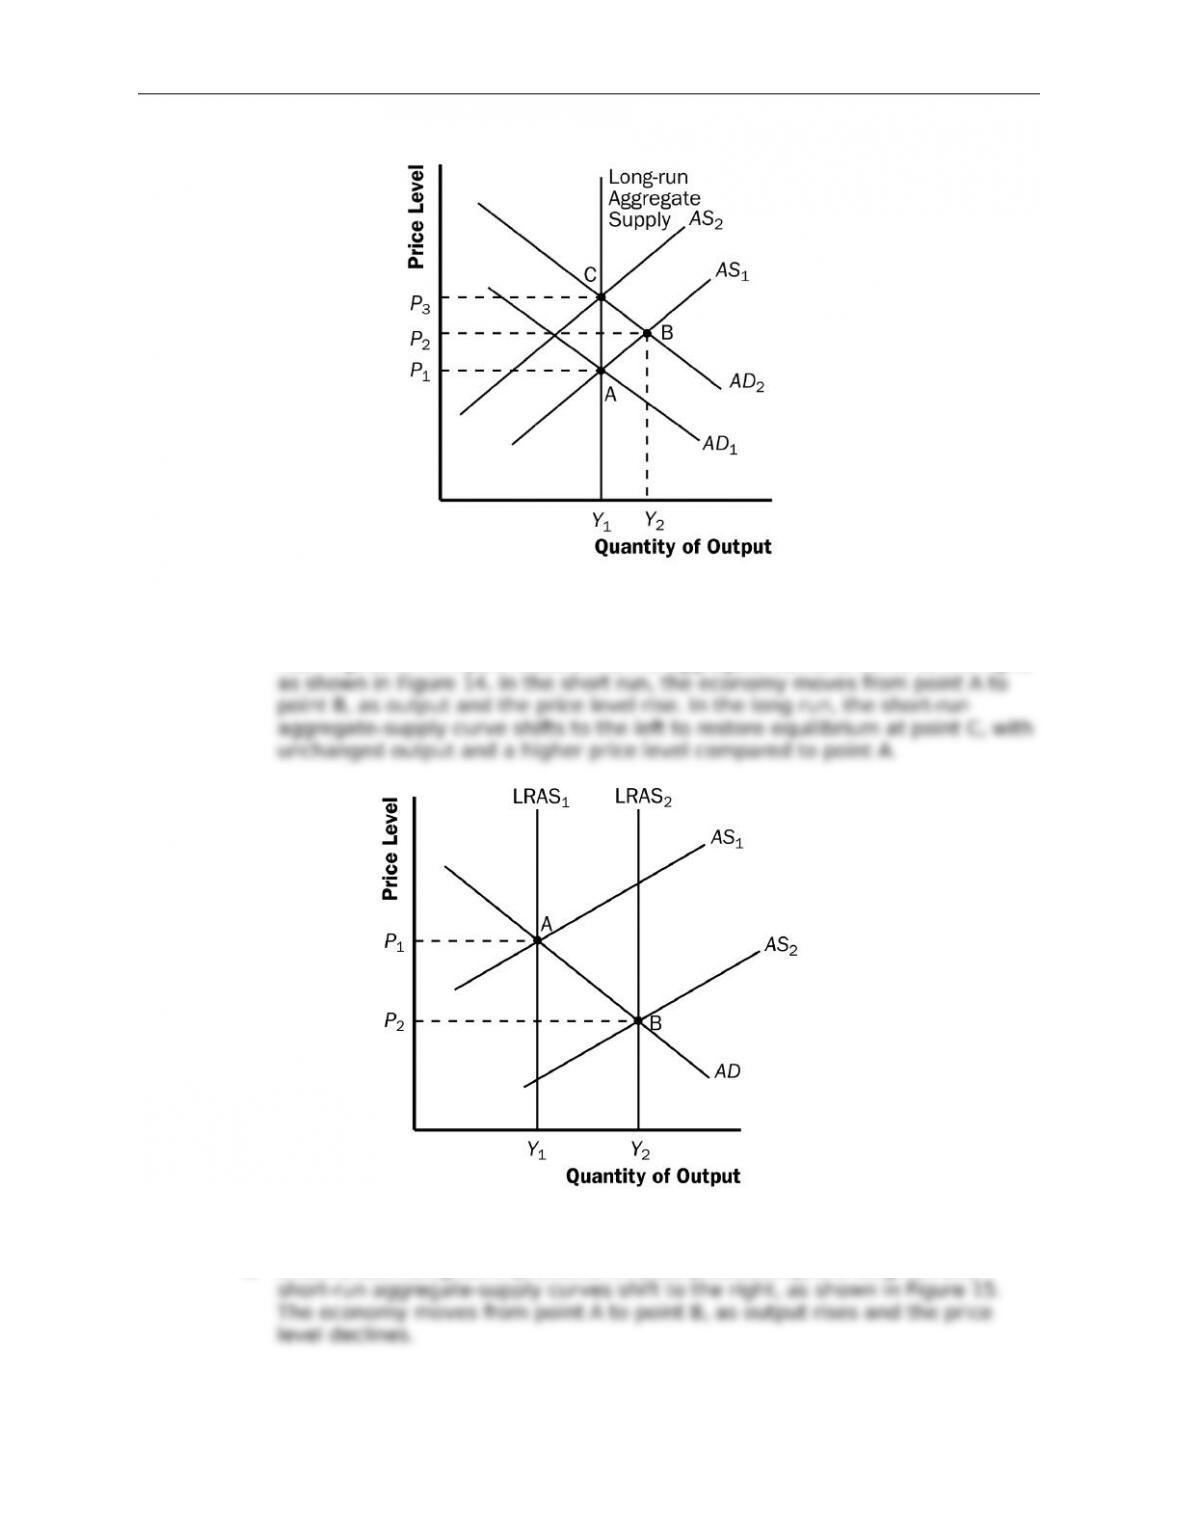
b. When the federal government increases spending on national defense, the
rise in government purchases shifts the aggregate-demand curve to the right,
Figure 15
c. When a technological improvement raises productivity, the long-run and
© 2018 Cengage Learning®. May not be scanned, copied or duplicated, or posted to a publicly accessible website,
in whole or in part, except for use as permitted in a license distributed with a certain product or service or otherwise
on a password-protected website or school-approved learning management system for classroom use.
Chapter 33/Aggregate Demand and Aggregate Supply ❖ 551
Figure 16
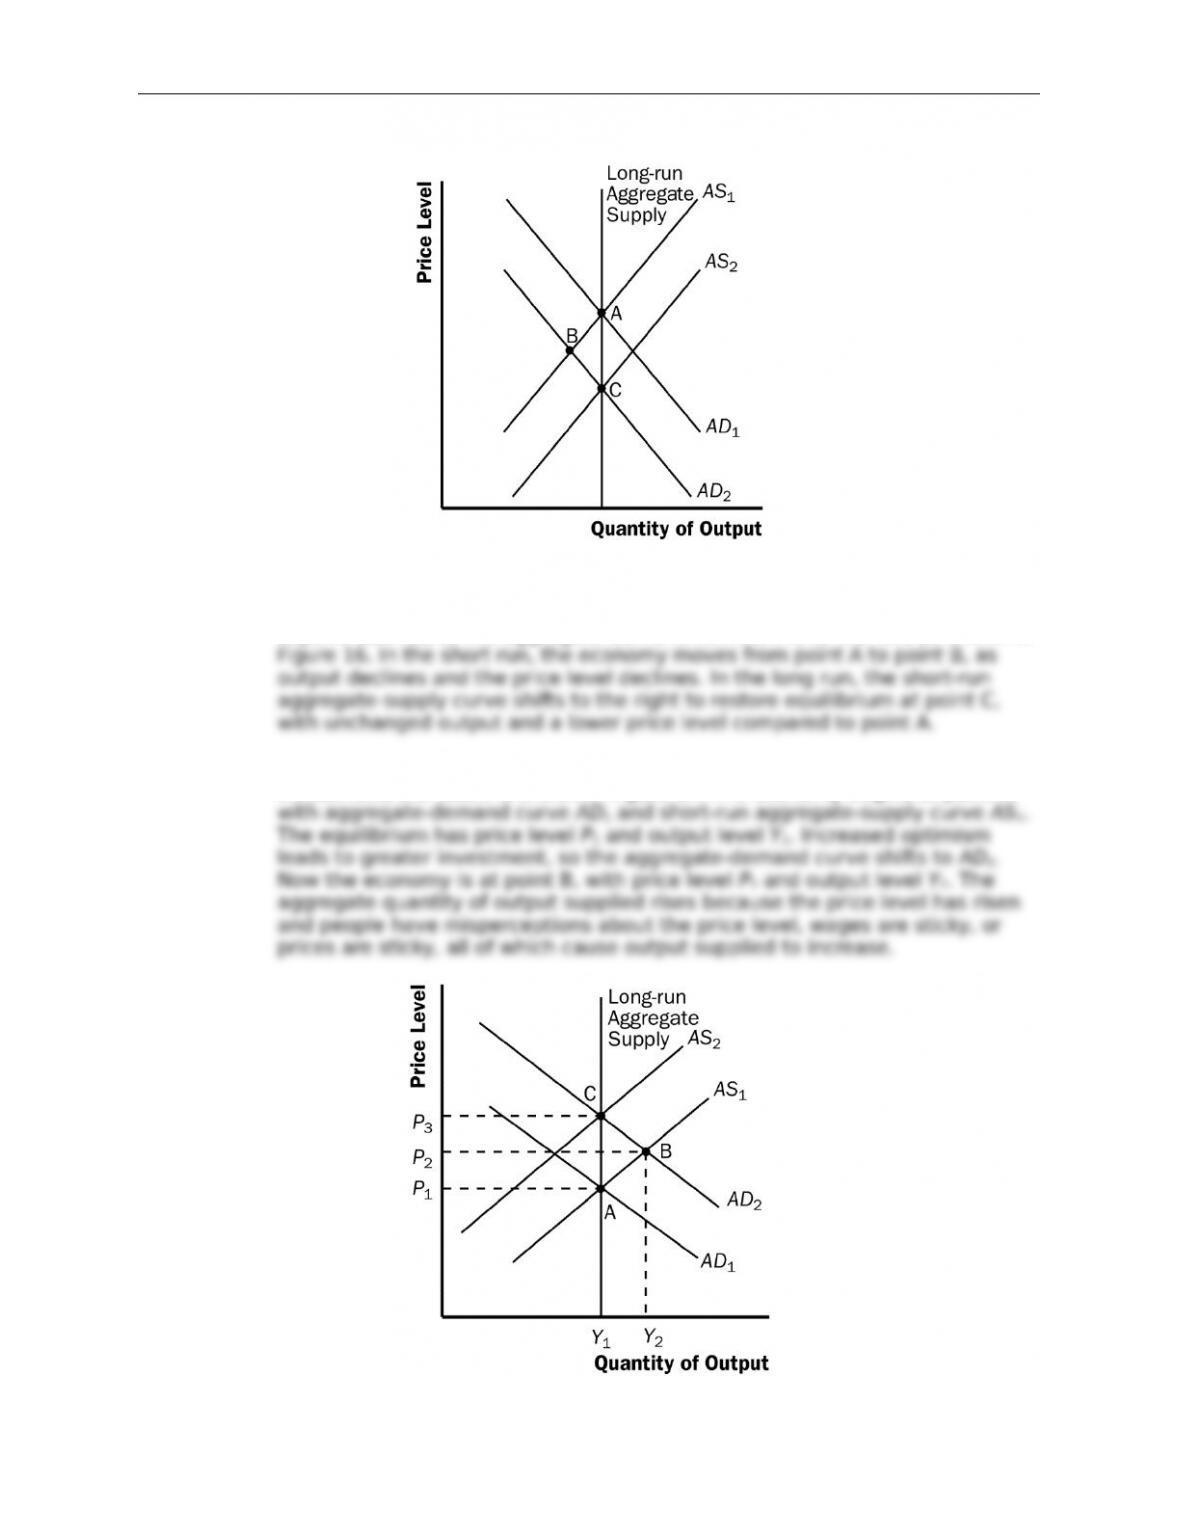
d. When a recession overseas causes foreigners to buy fewer U.S. goods, net
exports decline, so the aggregate-demand curve shifts to the left, as shown in
10. a. If *rms become optimistic about future business conditions and increase
investment, the result is shown in Figure 17. The economy begins at point A
© 2018 Cengage Learning®. May not be scanned, copied or duplicated, or posted to a publicly accessible website,
in whole or in part, except for use as permitted in a license distributed with a certain product or service or otherwise
on a password-protected website or school-approved learning management system for classroom use.

Chapter 33/Aggregate Demand and Aggregate Supply ❖ 552
Figure 17
b. Over time, as the misperceptions of the price level disappear, wages adjust, or
prices adjust, the short-run aggregate-supply curve shifts to the left to AS2 and
c. The investment boom might increase the long-run aggregate-supply curve
© 2018 Cengage Learning®. May not be scanned, copied or duplicated, or posted to a publicly accessible website,
in whole or in part, except for use as permitted in a license distributed with a certain product or service or otherwise
on a password-protected website or school-approved learning management system for classroom use.