
WHAT’S NEW IN THE EIGHTH EDITION:
There are two new In the News features, “Sex, Drugs, and GDP” and “Gauging the High Tech
Economy.” The denition of investment has been changed. There are two new questions in
the Problems and Applications section and tables have been updated.
LEARNING OBJECTIVES:
By the end of this chapter, students should understand:
why an economy’s total income equals its total expenditure.
how gross domestic product (GDP) is dened and calculated.
the breakdown of GDP into its four major components.
the distinction between real GDP and nominal GDP.
whether GDP is a good measure of economic well-being.
CONTEXT AND PURPOSE:
Chapter 23 is the rst chapter in the macroeconomic section of the text. It is the rst of a
two-chapter sequence that introduces students to two vital statistics that economists use to
monitor the macroeconomy—GDP and the consumer price index. Chapter 23 develops how
economists measure production and income in the macroeconomy. The following chapter
develops how economists measure the level of prices in the macroeconomy. Taken together,
Chapter 23 concentrates on the quantity of output in the macroeconomy while Chapter 24
concentrates on the price of output in the macroeconomy.
The purpose of this chapter is to provide students with an understanding of the
measurement and the use of gross domestic product (GDP). GDP is the single most
important measure of the health of the macroeconomy. Indeed, it is the most widely
reported statistic in every developed economy.
KEY POINTS:
Because every transaction has a buyer and a seller, the total expenditure in the
economy must equal the total income in the economy.
384
© 2018 Cengage Learning®. May not be scanned, copied or duplicated, or posted to a publicly accessible website,
in whole or in part, except for use as permitted in a license distributed with a certain product or service or otherwise
on a password-protected website or school-approved learning management system for classroom use.
23 MEASURING A NATION’S
INCOME
385 ❖ Chapter 23/Measuring a Nation’s Income
Gross domestic product (GDP) measures an economy’s total expenditure on newly
produced goods and services and the total income earned from the production of these
goods and services. More precisely, GDP is the market value of all nal goods and
services produced within a country in a given period of time.
GDP is divided among four components of expenditure: consumption, investment,
government purchases, and net exports. Consumption includes spending on goods and
services by households, with the exception of purchases of new housing. Investment
includes spending on business capital, residential capital, and inventories. Government
purchases include spending on goods and services by local, state, and federal
governments. Net exports equal the value of goods and services produced domestically
and sold abroad (exports) minus the value of goods and services produced abroad and
sold domestically (imports).
Nominal GDP uses current prices to value the economy’s production of goods and
services. Real GDP uses constant base-year prices to value the economy’s production of
goods and services. The GDP deDator―calculated from the ratio of nominal to real
GDP―measures the level of prices in the economy.
GDP is a good measure of economic well-being because people prefer higher incomes to
lower incomes. But it is not a perfect measure of well-being. For example, GDP excludes
the value of leisure and the value of a clean environment.
CHAPTER OUTLINE:
I. Review of the Denitions of Microeconomics and Macroeconomics
A. Denition of microeconomics: the study of how households and -rms make
decisions and how they interact in markets.
B. Denition of macroeconomics: the study of economy-wide phenomena
including in1ation, unemployment, and economic growth.
II. The Economy’s Income and Expenditure
A. To judge whether an economy is doing well, it is useful to look at Gross Domestic
Product (GDP).
1. GDP measures the total income of everyone in the economy.
2. GDP measures total expenditure on an economy’s output of goods and services.
© 2018 Cengage Learning®. May not be scanned, copied or duplicated, or posted to a publicly accessible website,
in whole or in part, except for use as permitted in a license distributed with a certain product or service or otherwise
on a password-protected website or school-approved learning management system for classroom use.
Students have heard of GDP and they are often interested in learning
more about what it is. The basic point that you must get across is that
GDP is a measure of both
aggregate production and aggregate income in
a nation over a period of one year. You can demonstrate this by using the
circular-Dow diagram and explaining that production generates income,
which provides the purchasing power that generates the demand for the
products.
Regardless of whether microeconomics is taught before macroeconomics
or vice versa, students need to be reminded of the diHerences between
the two areas of study. Begin by dening the two terms and contrasting
and comparing their focus.
Chapter 23/Measuring a Nation’s Income ❖ 386
B. For an economy as a whole, total income must equal total expenditure.
1. If someone pays someone else $100 to mow a lawn, the expenditure on the lawn
service ($100) is exactly equal to the income earned from the production of the
lawn service ($100).
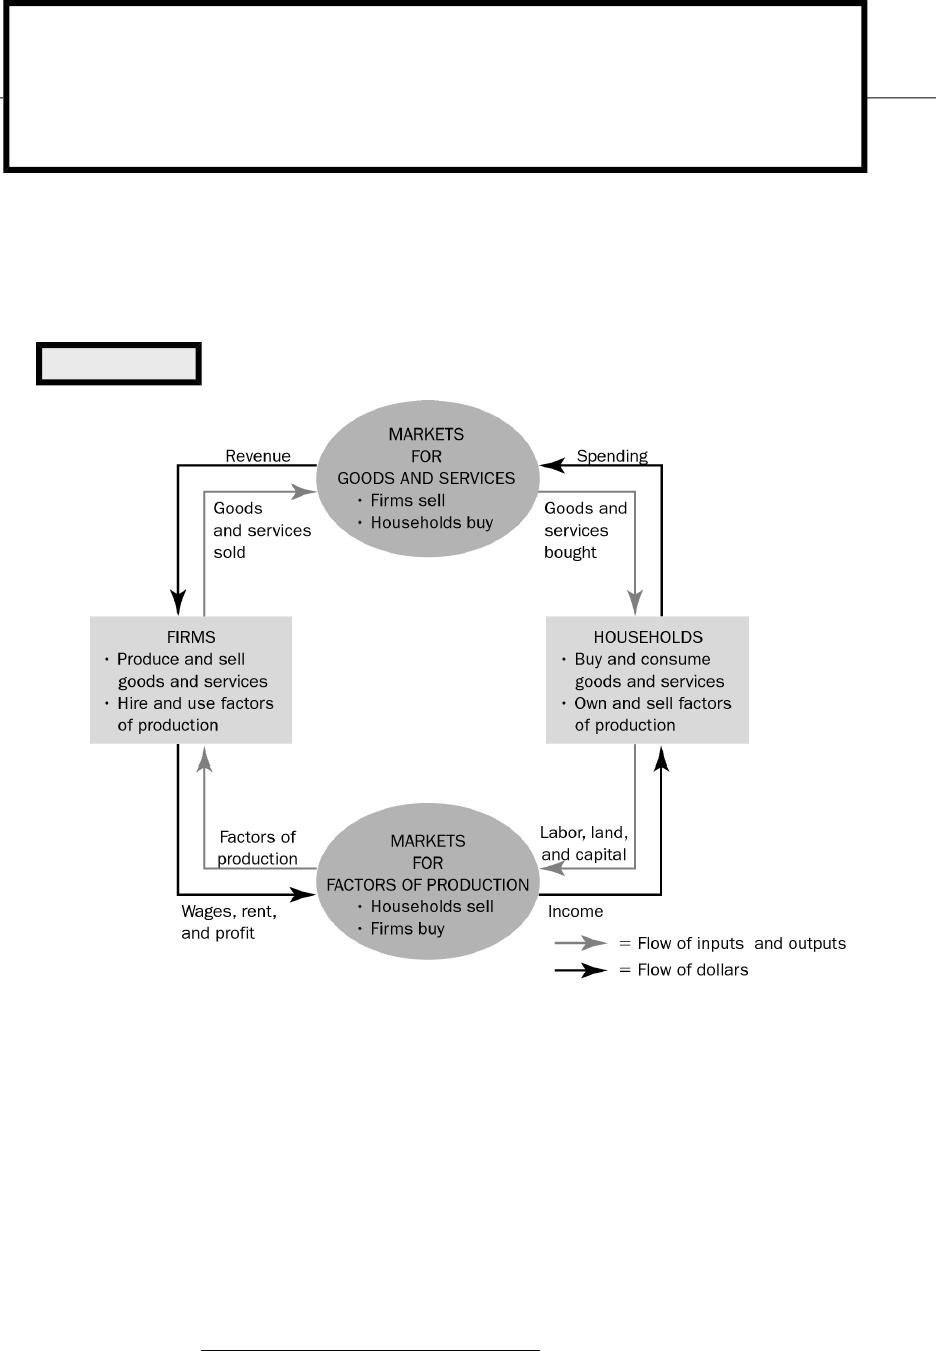
2. We can also use the circular-Dow diagram from Chapter 2 to show why total
income and total expenditure must be equal.
a. Households buy goods and services from rms; rms use this money to pay
for resources purchased from households.
b. In the simple economy described by this circular-Dow diagram, calculating
GDP could be done by adding up the total purchases of households or
summing total income paid by rms.
c. Note that this simple diagram is somewhat unrealistic as it omits saving,
taxes, government purchases, and investment purchases by rms. However,
because a transaction always has a buyer and a seller, total expenditure in
the economy must be equal to total income.
III. The Measurement of Gross Domestic Product
A. Denition of gross domestic product (GDP): the market value of all -nal
goods and services produced within a country in a given period of time.
© 2018 Cengage Learning®. May not be scanned, copied or duplicated, or posted to a publicly accessible website,
in whole or in part, except for use as permitted in a license distributed with a certain product or service or otherwise
on a password-protected website or school-approved learning management system for classroom use.
Students have heard of GDP and they are often interested in learning
more about what it is. The basic point that you must get across is that
GDP is a measure of both
aggregate production and aggregate income in
a nation over a period of one year. You can demonstrate this by using the
circular-Dow diagram and explaining that production generates income,
which provides the purchasing power that generates the demand for the
products.
Figure 1
387 ❖ Chapter 23/Measuring a Nation’s Income
B. “GDP Is the Market Value . . .”
1. To add together diHerent items, market values are used.
2. Market values are calculated by using market prices.
C. “. . . Of All . . .”
1. GDP includes all items produced and sold legally in the economy.
2. The value of housing services is somewhat diOcult to measure.
a. If housing is rented, the value of the rent is used to measure the value of the
housing services.
b. For housing that is owned (or mortgaged), the government estimates the
rental value and uses this gure to value the housing services.
3. GDP does not include illegal goods or services or items that are not sold in
markets.
a. When you hire someone to mow your lawn, that production is included in GDP.
b. If you mow your own lawn, that production is not included in GDP.
D. “. . . Final . . .”
1. Intermediate goods are not included in GDP.
2. The value of intermediate goods is already included as part of the value of the
nal good.
3. Goods that are placed into inventory are considered to be “nal” and included in
GDP as a rm’s inventory investment.
a. Goods that are sold out of inventory are counted as a decrease in inventory
investment.
b. The goal is to count the production when the good is nished, which is not
necessarily the same time that the product is sold.
E. “. . . Goods and Services . . .”
1. GDP includes both tangible goods and intangible services.
© 2018 Cengage Learning®. May not be scanned, copied or duplicated, or posted to a publicly accessible website,
in whole or in part, except for use as permitted in a license distributed with a certain product or service or otherwise
on a password-protected website or school-approved learning management system for classroom use.
Make sure that students realize that investment goods (such as structures
and vehicles used in production) are not intermediate goods. Investment
goods represent products purchased for nal use by business rms.
To put GDP in terms that students may understand better, explain to them
that GDP represents the amount of money one would need to purchase
one year’s worth of the economy’s production of all nal goods and
services.
Have a contest and see which student can come closest in guessing the
level of GDP for the United States last year.
Chapter 23/Measuring a Nation’s Income ❖ 388
F. “. . . Produced . . .”
1. Only current production is counted.
2. Used goods that are sold do not count as part of GDP.
G. “. . . Within a Country . . .”
1. GDP measures the production that takes place within the geographical boundaries
of a particular country.
2. If a Canadian citizen works temporarily in the United States, the value of her
output is included in GDP for the United States. If an American owns a factory in
Haiti, the value of the production of that factory is not included in U.S. GDP.
H. “. . . in a Given Period of Time.”
1. The usual interval of time used to measure GDP is a year or a quarter (three
months).
2. When the government reports GDP, the data are generally reported on an annual
basis.
3. In addition, data are generally adjusted for regular seasonal changes (such as
Christmas).
I. In addition to summing expenditure, the government also calculates GDP by adding
up total income in the economy.
1. The two ways of calculating GDP generate almost exactly the same answer.
2. The diHerence between the two calculations of GDP is called the statistical
discrepancy.
J. FYI: Other Measures of Income
A. Gross National Product (GNP) is the total income earned by a nation’s permanent
residents.
1. GNP includes income that American citizens earn abroad.
© 2018 Cengage Learning®. May not be scanned, copied or duplicated, or posted to a publicly accessible website,
in whole or in part, except for use as permitted in a license distributed with a certain product or service or otherwise
on a password-protected website or school-approved learning management system for classroom use.
Students sometimes have trouble understanding that the production of a
foreign rm operating in the United States is part of U.S. GDP. Help them
make the connection by using the circular-Dow diagram. Show them that,
even if it is a foreign rm, the rm’s workers are living in the United States
and buying clothes, groceries, and other goods in the United States. Thus,
the workers in the foreign rm operating in the United States are fueling
the domestic economy.
It can be a challenge to teach all of these denitions without putting your
students to sleep. Concentrate on the measures that will mean the most
to students as the semester progresses.
389 ❖ Chapter 23/Measuring a Nation’s Income
2. GNP excludes income that foreigners earn in the United States.
B. Net National Product (NNP) is the total income of a nation’s residents (GNP) minus
losses from depreciation (wear and tear on an economy’s stock of equipment and
structures).
C. National income is the total income earned by a nation’s residents in the production
of goods and services.
1. National income diHers from NNP by excluding indirect business taxes and
including business subsidies.
2. NNP and national income also diHer due to “statistical discrepancy.”
D. Personal income is the income that households and noncorporate businesses receive.
E. Disposable personal income is the income that households and noncorporate
businesses have left after taxes and other obligations to the government.
IV. The Components of GDP
A. GDP (Y ) can be divided into four components: consumption (C ), investment (I ),
government purchases (G ), and net exports (NX ).
B. Denition of consumption: spending by households on goods and services,
with the exception of purchases of new housing.
C. Denition of investment: spending on business capital, residential capital,
and inventories.
1. GDP accounting uses the word “investment” diHerently from how we use the term
in everyday conversation.
2. When a student hears the word “investment,” she thinks of nancial instruments
such as stocks and bonds.
3. In GDP accounting, investment means purchases of investment goods such as
business capital, residential structures, and inventories.
D. Denition of government purchases: spending on goods and services by
local, state, and federal governments.
1. Salaries of government workers are counted as part of the government purchases
component of GDP.
© 2018 Cengage Learning®. May not be scanned, copied or duplicated, or posted to a publicly accessible website,
in whole or in part, except for use as permitted in a license distributed with a certain product or service or otherwise
on a password-protected website or school-approved learning management system for classroom use.
Students will ask why GDP is called “Y.” Remind them that in equilibrium
GDP expenditures must be equal to income. The “Y ” stands for income
because the letter “I ” is used for investment.
= + + +Y C I G NX

Chapter 23/Measuring a Nation’s Income ❖ 390
2. Transfer payments are not included as part of the government purchases
component of GDP.
E. Denition of net exports: spending on domestically produced goods by
foreigners (exports) minus spending on foreign goods by domestic
residents (imports).
F. Case Study: The Components of U.S. GDP
1. Table 1 shows these four components of GDP for 2015.
2. The data for GDP come from the Bureau of Economic Analysis, which is part of the
Department of Commerce.
G. In the News: Sex, Drugs, and GDP
1. Countries are reconsidering what goods and services to include in GDP.
2. The inclusion of typically excluded goods and services like illegal drugs and
prostitution are considered in this Slate article.
V. Real Versus Nominal GDP
A. There are two possible reasons for total spending to rise from one year to the next.
1. The economy may be producing a larger output of goods and services.
2. Goods and services could be selling at higher prices.
B. When studying GDP over time, economists would like to know if output has changed
(not prices).
C. Thus, economists measure real GDP by valuing output using a xed set of prices.
D. A Numerical Example
1. Two goods are being produced: hot dogs and hamburgers.
© 2018 Cengage Learning®. May not be scanned, copied or duplicated, or posted to a publicly accessible website,
in whole or in part, except for use as permitted in a license distributed with a certain product or service or otherwise
on a password-protected website or school-approved learning management system for classroom use.
Make sure that you point out Table 1. Call attention to the importance of
consumption and the negative number in the net exports column.
Make sure that you do this example or a similar numerical example in
class. If you feel comfortable improvising, let the students pick two goods
and then make up an example with them.
Spend some time in class distinguishing between government purchases
and transfer payments. Point out that transfer payments are actually
negative taxes representing payments from the government to individuals
(with no good or service provided in return) rather than payments from
individuals to the government. Dene net taxes as the diHerence between
taxes and transfers.
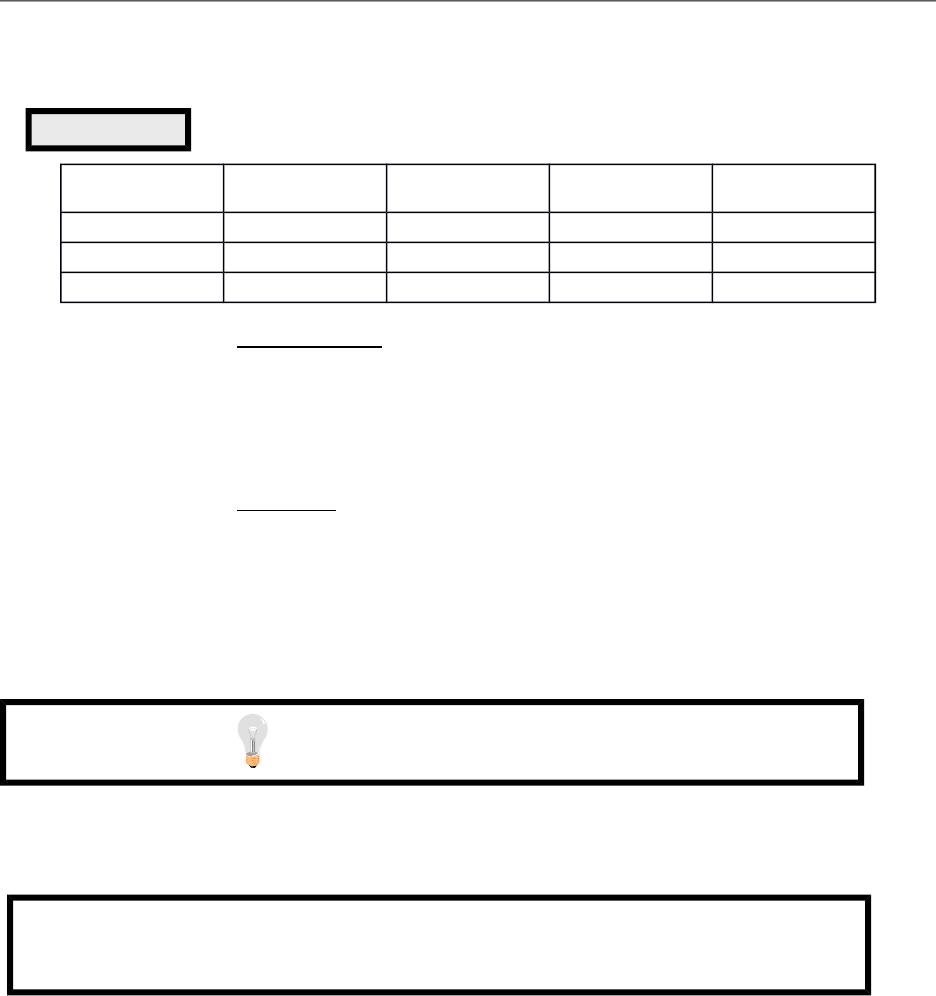
Table 1
391 ❖ Chapter 23/Measuring a Nation’s Income
Year Price of
Hot Dogs
Quantity of
Hot Dogs
Price of
Hamburgers
Quantity of
Hamburgers
2016 $1 100 $2 50
2017 $2 150 $3 100
2018 $3 200 $4 150
2. Denition of nominal GDP: the production of goods and services valued at
current prices.
Nominal GDP for 2016 = ($1 × 100) + ($2 × 50) = $200.
Nominal GDP for 2017 = ($2 × 150) + ($3 × 100) = $600.
Nominal GDP for 2018 = ($3 × 200) + ($4 × 150) = $1,200.
3. Denition of real GDP: the production of goods and services valued at
constant prices.
Let’s assume that the base year is 2016.
Real GDP for 2016 = ($1 × 100) + ($2 × 50) = $200.
Real GDP for 2017 = ($1 × 150) + ($2 × 100) = $350.
Real GDP for 2018 = ($1 × 200) + ($2 × 150) = $500.
E. Because real GDP is unaHected by changes in prices over time, changes in real GDP
reDect changes in the amount of goods and services produced.
© 2018 Cengage Learning®. May not be scanned, copied or duplicated, or posted to a publicly accessible website,
in whole or in part, except for use as permitted in a license distributed with a certain product or service or otherwise
on a password-protected website or school-approved learning management system for classroom use.
Emphasize that when there is inDation, nominal GDP can increase while
real GDP actually declines. Make sure that students understand that real
GDP will be used as a proxy for aggregate production throughout the
course.
Make sure that it is clear to students how to calculate these numbers so
that they can compute nominal GDP and real GDP on their own.
Table 2
Chapter 23/Measuring a Nation’s Income ❖ 392
F. The GDP DeDator
1. Denition of GDP de1ator: a measure of the price level calculated as the
ratio of nominal GDP to real GDP times 100.
2. Example Calculations
GDP DeDator for 2016= ($200 / $200) × 100 = 100.
GDP DeDator for 2017 = ($600 / $350) × 100 = 171.
GDP DeDator for 2018 = ($1200 / $500) × 100 = 240.
G. Case Study: A Half Century of Real GDP
1. Figure 2 shows quarterly data on real GDP for the United States since 1965.
2. We can see that real GDP has increased over time.
3. We can also see that there are times when real GDP declines. These periods are
called recessions.
© 2018 Cengage Learning®. May not be scanned, copied or duplicated, or posted to a publicly accessible website,
in whole or in part, except for use as permitted in a license distributed with a certain product or service or otherwise
on a password-protected website or school-approved learning management system for classroom use.
Figure 2
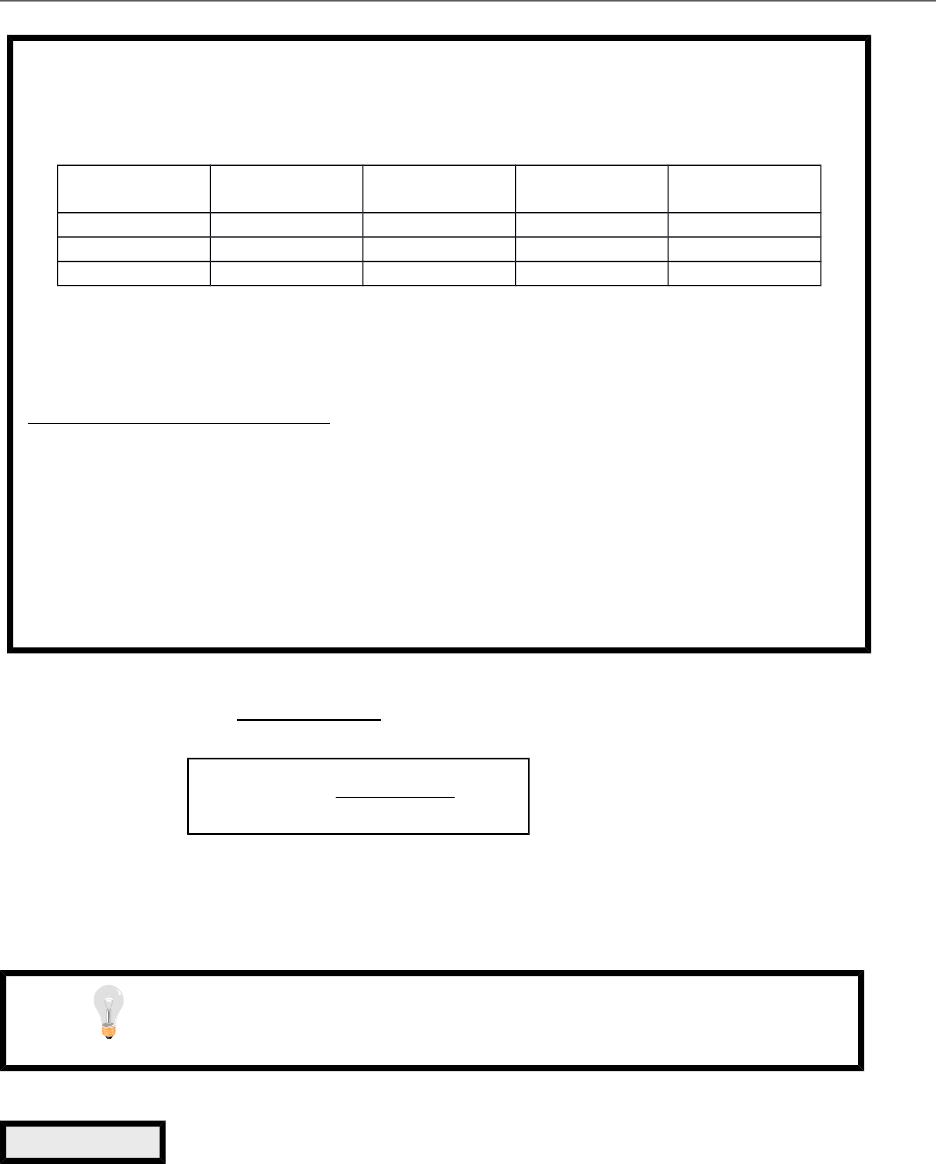
ALTERNATIVE CLASSROOM EXAMPLE:
The country of ____________ (insert name based on school mascot such as
“Pantherville” or “Owlstown”) produces two goods: footballs and basketballs.
Below is a table showing prices and quantities of output for three years:
Year Price of
Footballs
Quantity of
Footballs
Price of
Basketballs
Quantity of
Basketballs
Year 1 $10 120 $12 200
Year 2 12 200 15 300
Year 3 14 180 18 275
Nominal GDP in Year 1 = ($10 × 120) + ($12 × 200) = $3,600
Nominal GDP in Year 2 = ($12 × 200) + ($15 × 300) = $6,900
Nominal GDP in Year 3 = ($14 × 180) + ($18 × 275) = $7,470
Using Year 1 as the Base Year:
Real GDP in Year 1 = ($10 × 120) + ($12 × 200) = $3,600
Real GDP in Year 2 = ($10 × 200) + ($12 × 300) = $5,600
Real GDP in Year 3 = ($10 × 180) + ($12 × 275) = $5,100
(Note that nominal GDP rises from Year 2 to Year 3, but real GDP falls.)
GDP deDator for Year 1 = ($3,600/$3,600) × 100 = 1 × 100 = 100
GDP deDator for Year 2 = ($6,900/$5,600) × 100 = 1.2321 × 100 = 123.21
GDP deDator for Year 3 = ($7,470/$5,100) × 100 = 1.4647 × 100 = 146.47
= ´
Nominal GDP
GDP deDator 100
Real GDP
Make sure that you point out that nominal GDP and real GDP will be equal
in the base year. This implies that the GDP deDator for the base year will
always be equal to 100.
393 ❖ Chapter 23/Measuring a Nation’s Income
H. In the News: Gauging the High-Tech Economy
1. Because GDP is used in the measurement of productivity, if GDP is incorrect, then
productivity is incorrect.
2. This Wall Street Journal article considers the diOculty in measuring and including
some high-tech goods and services in GDP and the repercussions for the measure
of productivity.
VI. Is GDP a Good Measure of Economic Well-Being?
A. GDP measures both an economy’s total income and its total expenditure on goods
and services.
B. GDP per person tells us the income and expenditure level of the average person in
the economy.
C. GDP, however, may not be a very good measure of the economic well-being of an
individual.
1. GDP omits important factors in the quality of life including leisure, the quality of
the environment, and the value of goods produced but not sold in formal markets.
2. GDP also says nothing about the distribution of income.
3. However, a higher GDP does help us achieve a good life. Nations with larger GDP
generally have better education and better health care.
D. Case Study: International Di0erences in GDP and the Quality of Life
1. Table 3 shows real GDP per person, life expectancy at birth, the average years of
schooling among adults, and an index of life satisfaction based on asking people
to gauge how they feel about their lives.
2. In rich countries, life expectancy is higher, adults have more years of schooling,
and people rate their life satisfaction higher.
3. In poor countries, people typically die about 10 years earlier, have less than half
as much schooling, and rate their satisfaction about 2 points lower on the
10-point scale.
© 2018 Cengage Learning®. May not be scanned, copied or duplicated, or posted to a publicly accessible website,
in whole or in part, except for use as permitted in a license distributed with a certain product or service or otherwise
on a password-protected website or school-approved learning management system for classroom use.
Get students involved in a discussion of the merits and problems involved
with using GDP as a measure of well-being. Students are often as
interested in what is not included in GDP as they are in what is included.
Have the students break into small groups and list the things that might
be missing if we use GDP as a measure of well-being. Then, have each
group report their results and summarize them on the board.
Table 3

Chapter 23/Measuring a Nation’s Income ❖ 394
Activity 1—GDP and Well-Being
Type: In-class demonstration
Topics: Per capita GDP
Materials needed: None
Time: 15 minutes
Class limitations: Works in any size class
Purpose
This activity examines the usefulness and limits of measures of GDP. Students
often have diOculty accepting the use of GDP as a proxy for well-being. Per capita
GDP does not directly measure well-being but it is highly correlated with direct
measures. Making this correlation explicit helps students understand the
emphasis on GDP in macroeconomics.
Instructions
Ask students the following questions. Discuss each before moving to the next
question.
1. If GDP is a good measure of well-being, why is Switzerland’s GDP so much
lower than India’s GDP or China’s GDP?
2. What measures would be better to compare the well-being of diHerent
countries?
3. How do you expect these direct measures to correlate with per capita GDP?
Common Answers and Points for Discussion
1. GDP itself tells very little; Switzerland’s GDP is much lower than that of India
or China, yet Swiss citizens have one of the highest standards of living in the
world. The diHerence, of course, is population. Switzerland is a small country,
so its GDP is relatively small, despite its wealth. The appropriate comparison
is per capita GDP.
A more interesting question is “Is per capita GDP a good measure of
well-being?” Or worded another way: “What constitutes well-being?”
2. Well-being can be measured directly in a variety of ways. Students often
suggest these:
Health care
Food
Education
These are certainly better measures than money income, but they can be
diOcult to collect and interpret.
E. In the News: Measuring Macroeconomic Well-Being
1. Some economists wonder if we need a better measure of economic well-being.
2. This article from The Wall Street Journal describes some attempts at creating a
better measure of well-being.
© 2018 Cengage Learning®. May not be scanned, copied or duplicated, or posted to a publicly accessible website,
in whole or in part, except for use as permitted in a license distributed with a certain product or service or otherwise
on a password-protected website or school-approved learning management system for classroom use.