1
Chapter 2
48.0
60
D
25.0
2
2
30
D
2.2
6.11=== 18.0
1.1
60
D
C
; 0.73≈=== 0.727
41.0
2
2
30
D
2.3 The D
10
, D
30,
and D
60
for soils A, B, and C are obtained from the grain-size
distribution curves.
Soil A:
;
2.0
5.3
10
60
17.5===
D
D
C
u
5.43=== )2.0)(5.3(
95.1
))((
2
1060
2
30
DD
D
C
c
2
© 2018 Cengage Learning®. All Rights Reserved. May not be scanned, copied or duplicated, or posted to a publicly accessible website, in whole or in part.
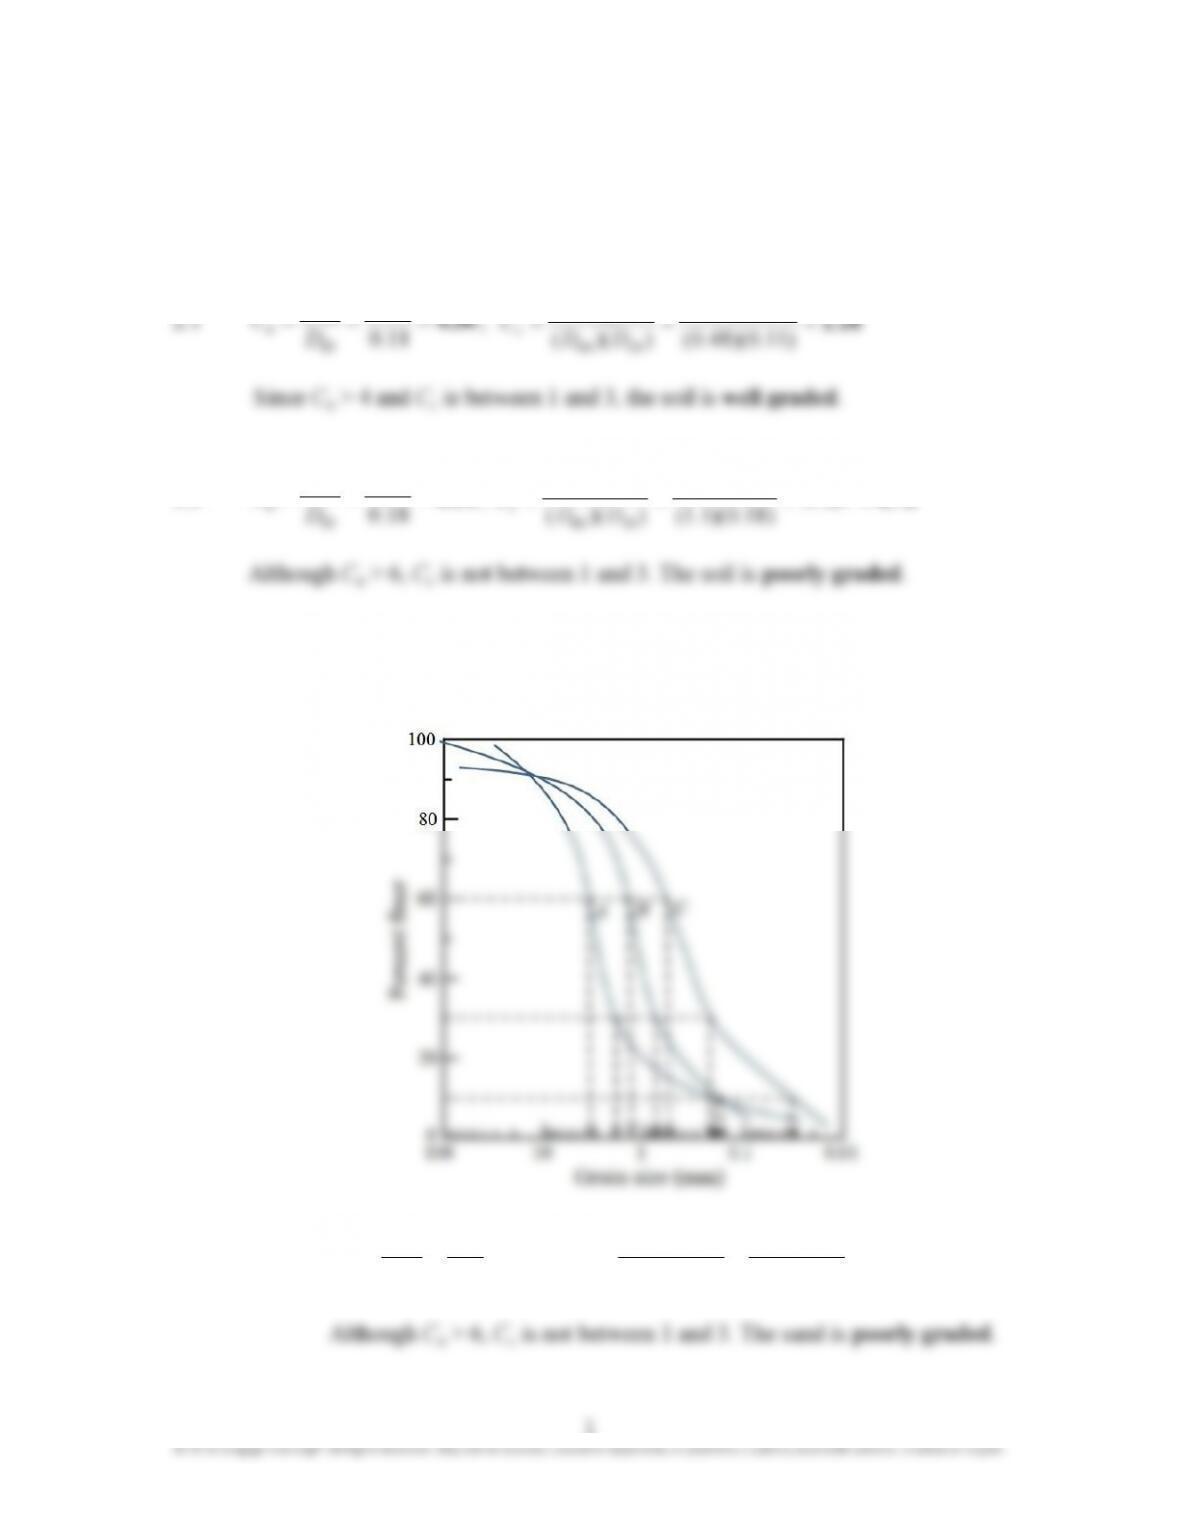
Soil B:
;
17.0
5.1
10
60
8.82=== D
D
C
u
2.2=== )17.0)(5.1(
75.0
))((
2
1060
2
30
DD
D
C
c
C
u
> 6 and C
c
is between 1 and 3. The sand is well graded.
Soil C: ;
032.0
55.0
10
60
17.2=== D
D
C
u
2.75=== )032.0)(55.0(
22.0
))((
2
1060
2
30
DD
D
C
c
C
u
> 6 and C
c
is between 1 and 3. The sand is well graded.
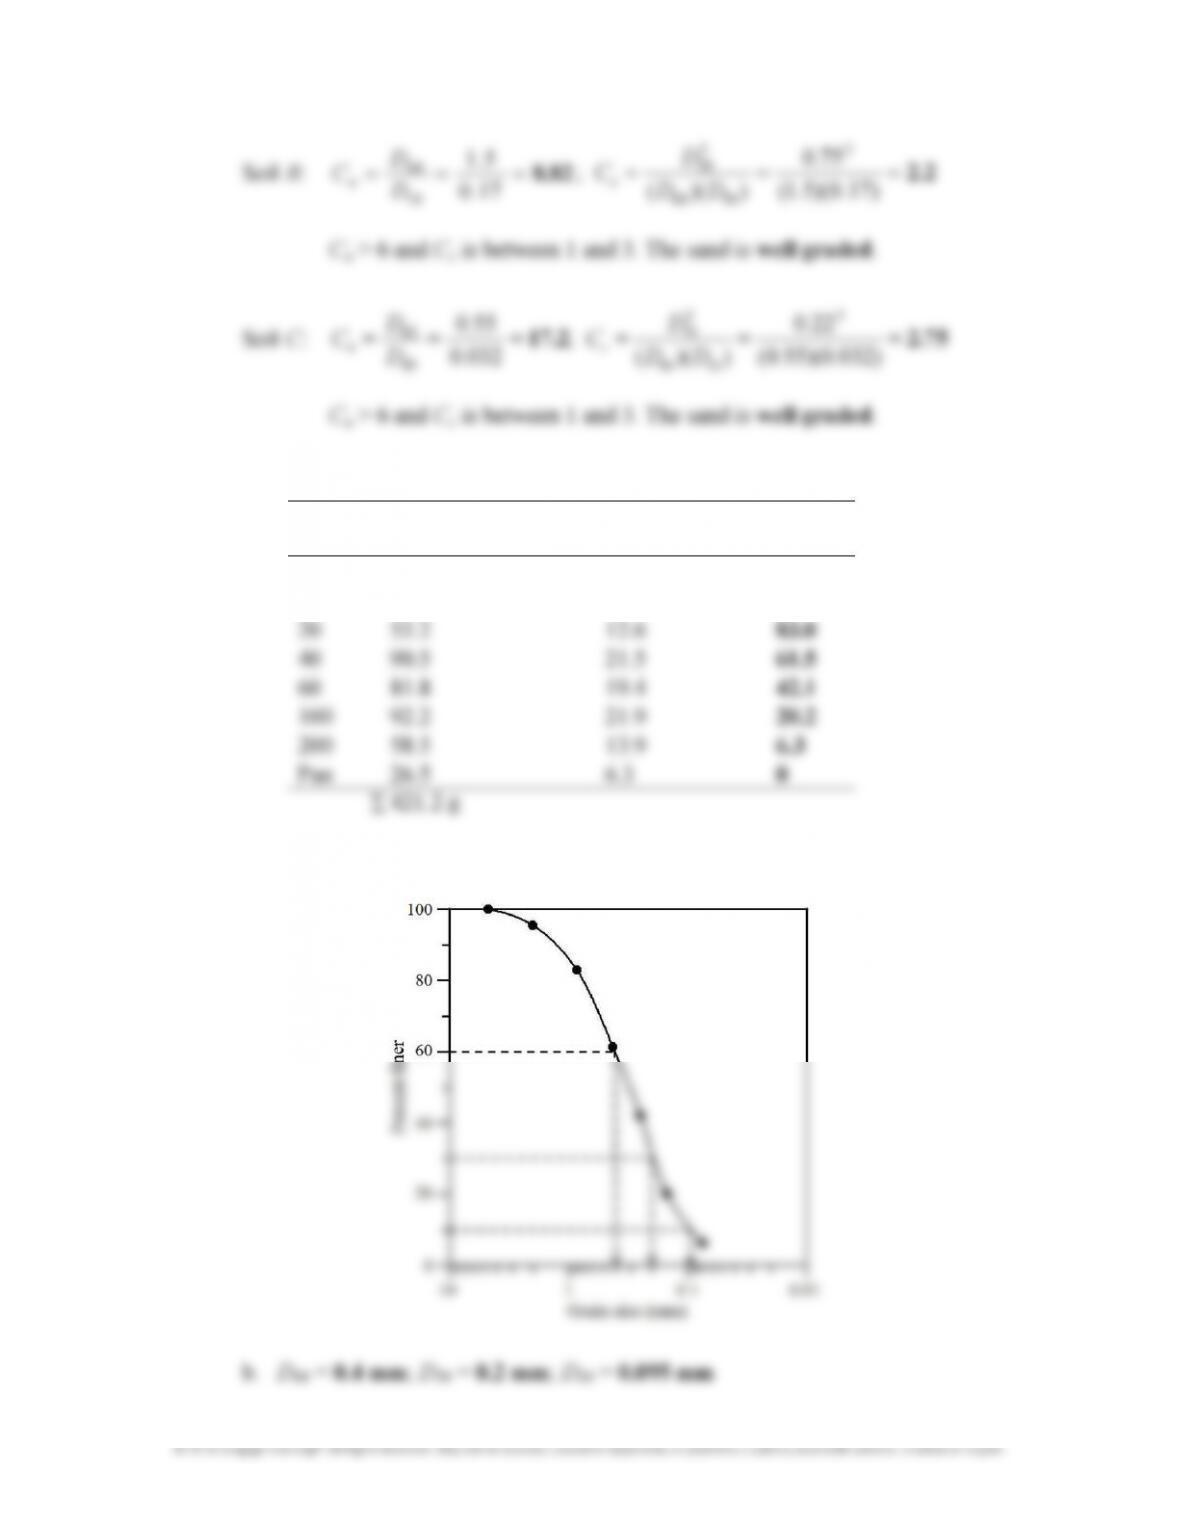
2.4 a.
Sieve
No.
Mass of soil retained
on each sieve (g)
Percent retained
on each sieve
Percent
finer
4
10
0.0
18.5
0.0
4.4
100.0
95.6
The grain-size distribution is shown in the figure.
3
© 2018 Cengage Learning®. All Rights Reserved. May not be scanned, copied or duplicated, or posted to a publicly accessible website, in whole or in part.
c. 4.21=== 095.0
4.0
10
60
D
D
C
u
d. 1.05=== )095.0)(4.0(
)2.0(
))((
)(
2
6010
2
30
DD
D
C
c
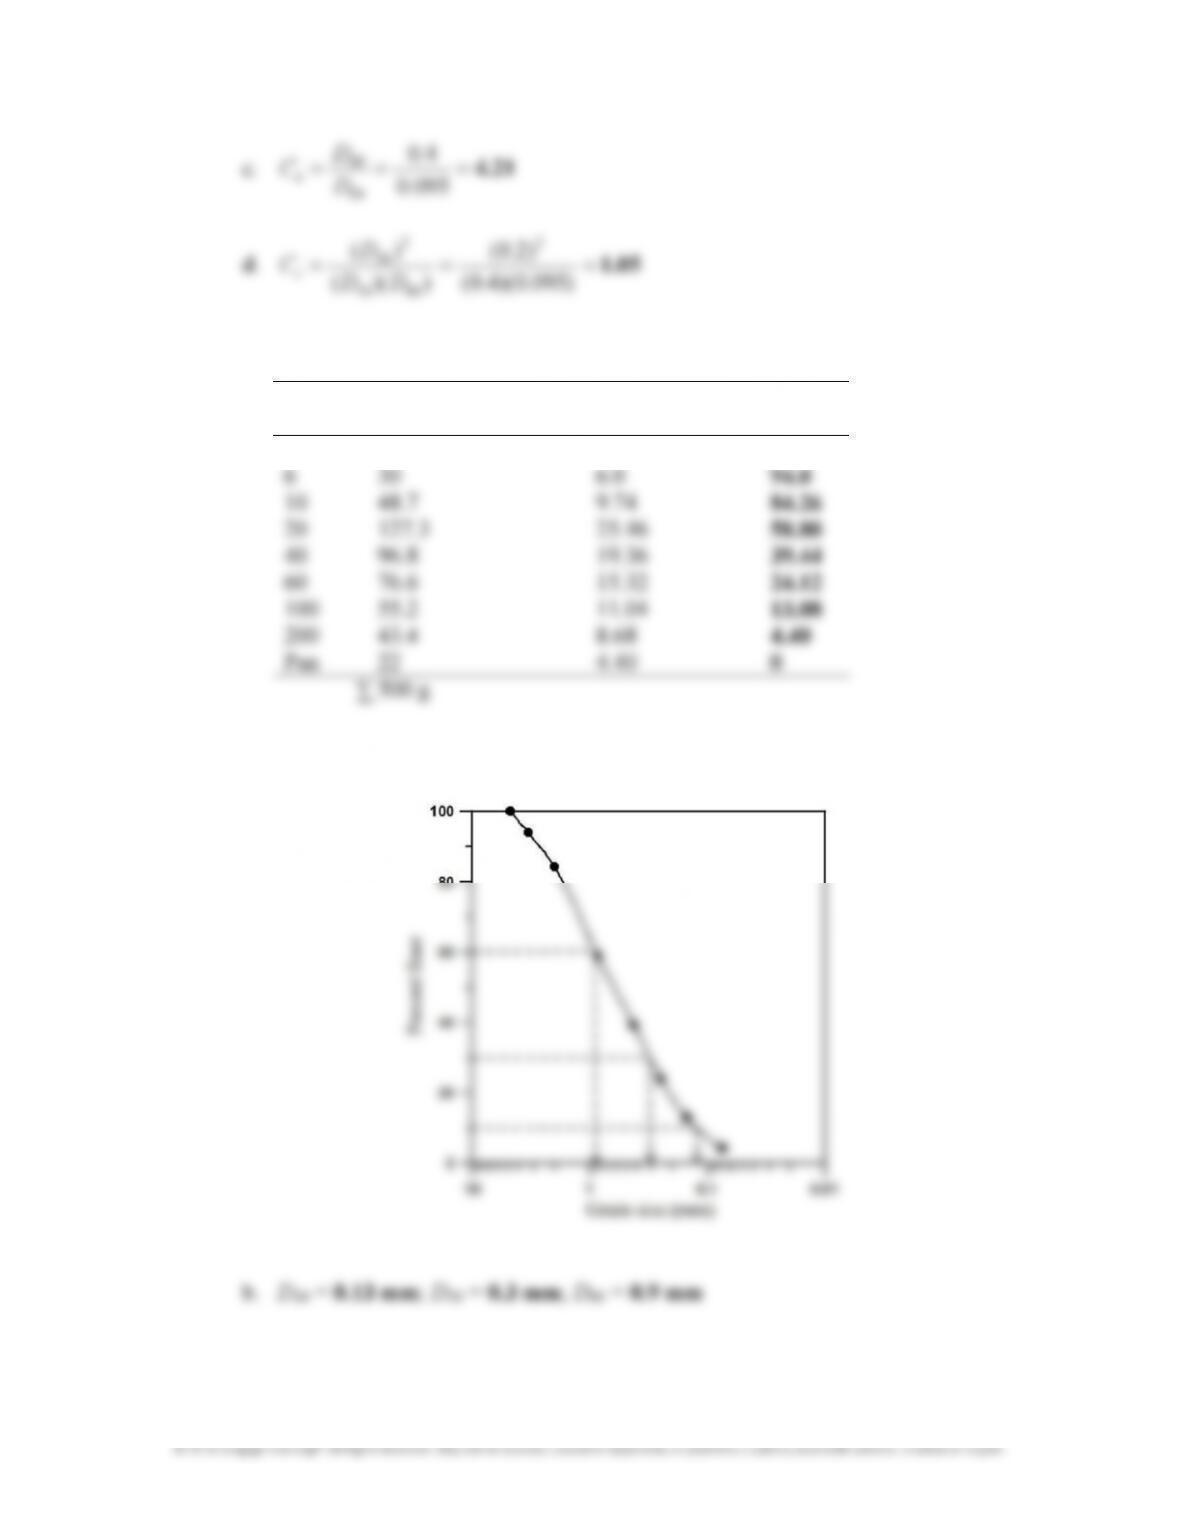
2.5 a.
Sieve
No.
Mass of soil retained
on each sieve (g)
Percent retained
on each sieve
Percent
finer
4
0
0.0
100
The grain-size distribution is shown in the figure.
4
© 2018 Cengage Learning®. All Rights Reserved. May not be scanned, copied or duplicated, or posted to a publicly accessible website, in whole or in part.
c. 6.926.923 ≈=== 13.0
9.0
10
60
D
D
C
u
d. 0.770.769 ≈=== )13.0)(9.0(
3.0
))((
2
1060
2
30
DD
D
C
c
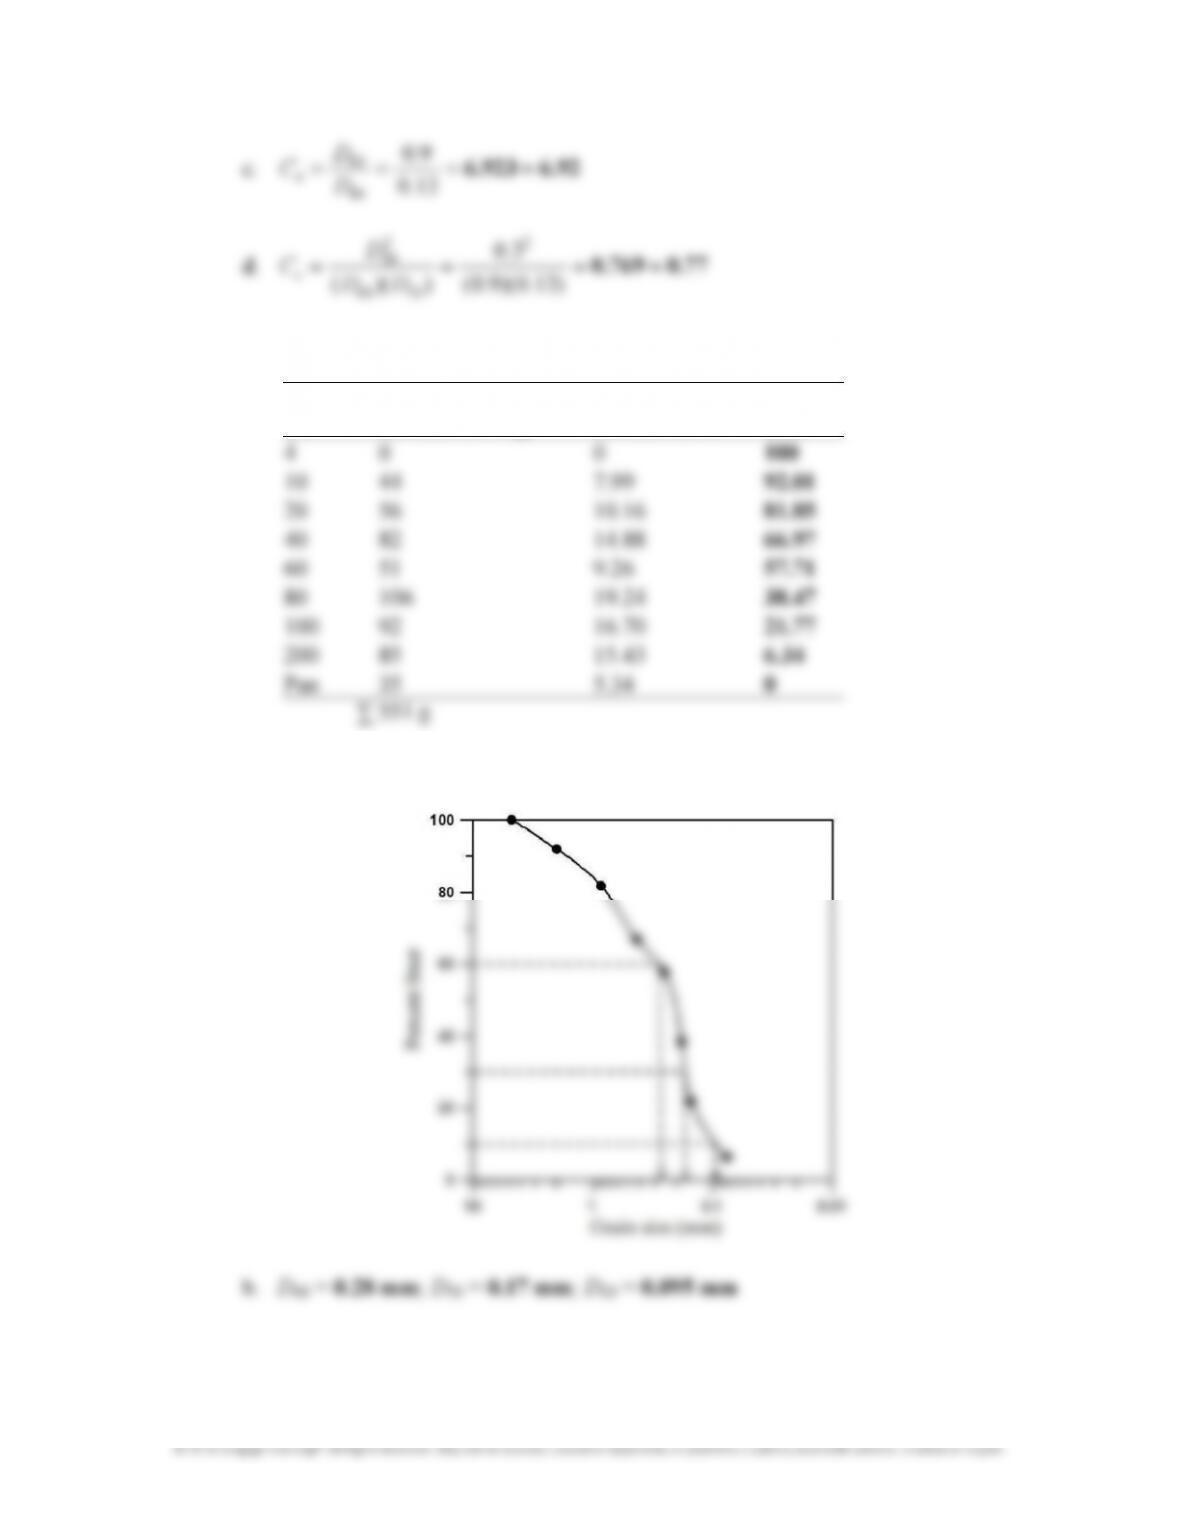
2.6 a.
Sieve
No.
Mass of soil retained
on each sieve (g)
Percent retained
on each sieve
Percent
finer
The grain-size distribution is shown in the figure.
5
© 2018 Cengage Learning®. All Rights Reserved. May not be scanned, copied or duplicated, or posted to a publicly accessible website, in whole or in part.
c.
2.95==
095
.
0
28.0
u
C
d.
1.09== )28.0)(095.0(
)17.0(
2
c
C
2.7 a.
Sieve
No.
Mass of soil retained
on each sieve (g)
Percent retained
on each sieve
Percent
finer
∑
500 g
The grain-size distribution is shown in the figure.
6
© 2018 Cengage Learning®. All Rights Reserved. May not be scanned, copied or duplicated, or posted to a publicly accessible website, in whole or in part.
d.
1.611.609 ≈=== )21.0)(45.0(
39.0
))((
2
1060
2
30
DD
D
C
c
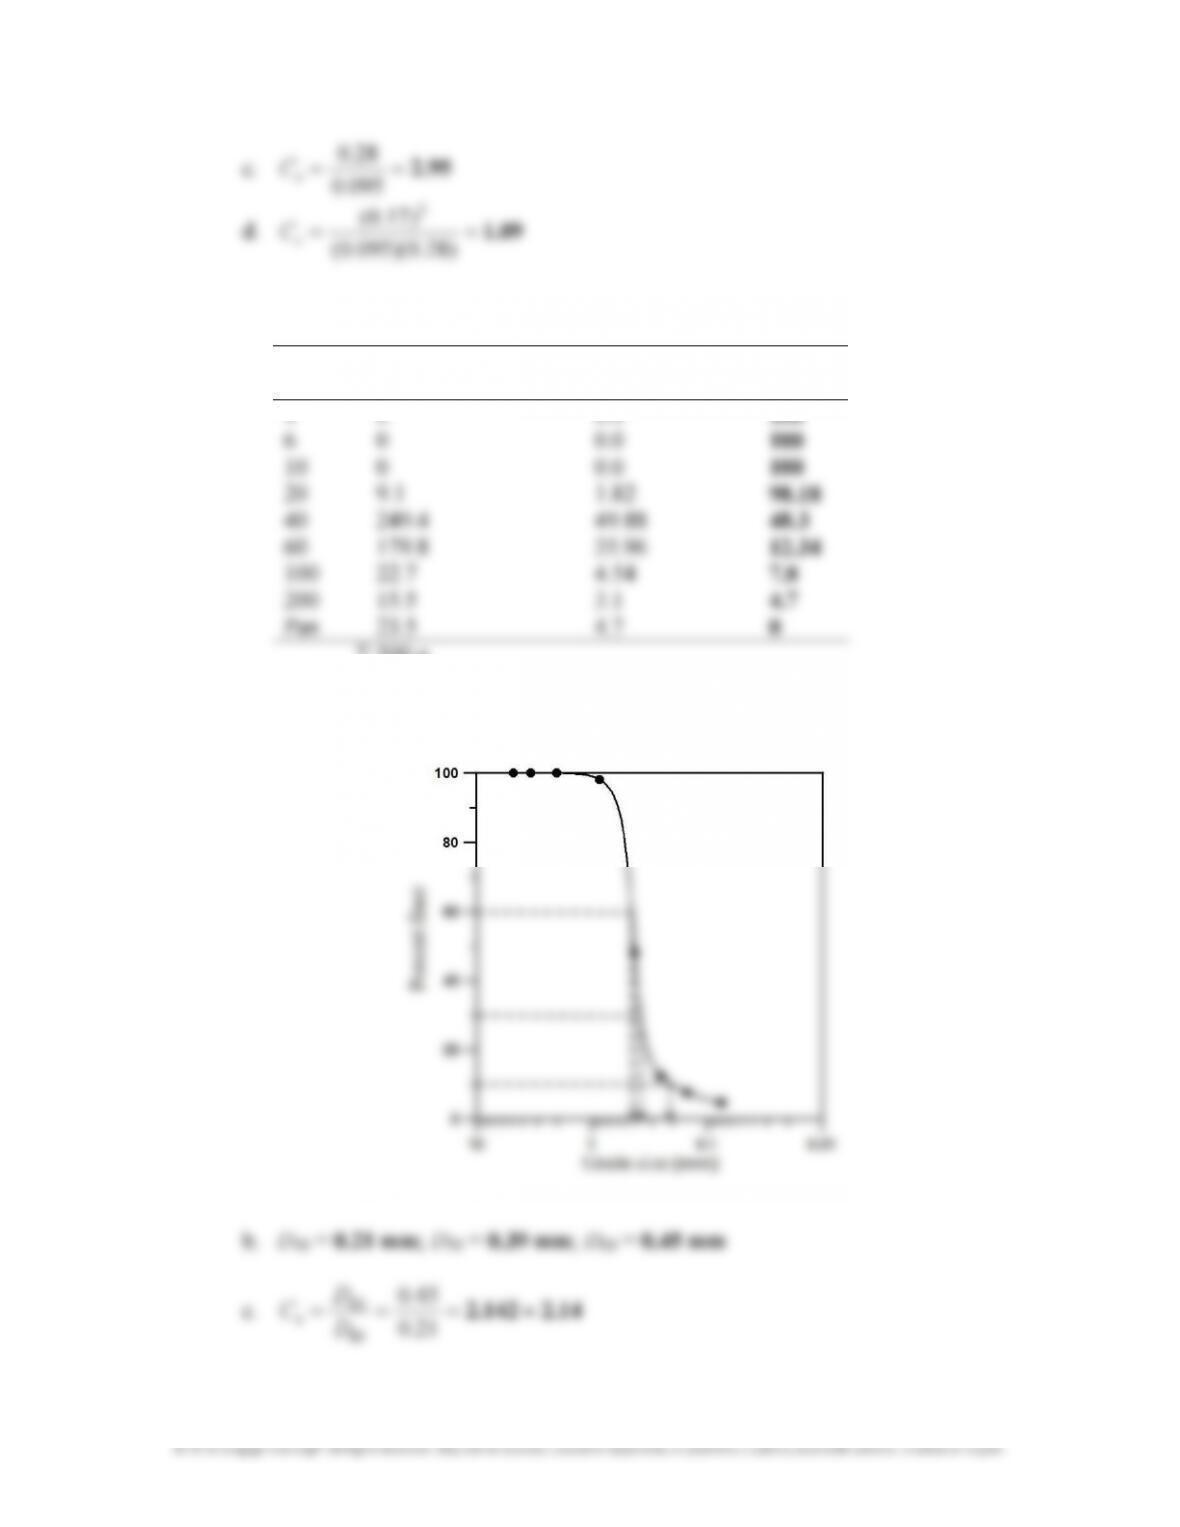
2.8 a. The grain-size distribution curve is shown in the figure
1 0.1 0.01 0.001
Grain Size (mm)
0
20
40
60
80
100
P
e
r
c
e
n
t
F
i
n
e
r
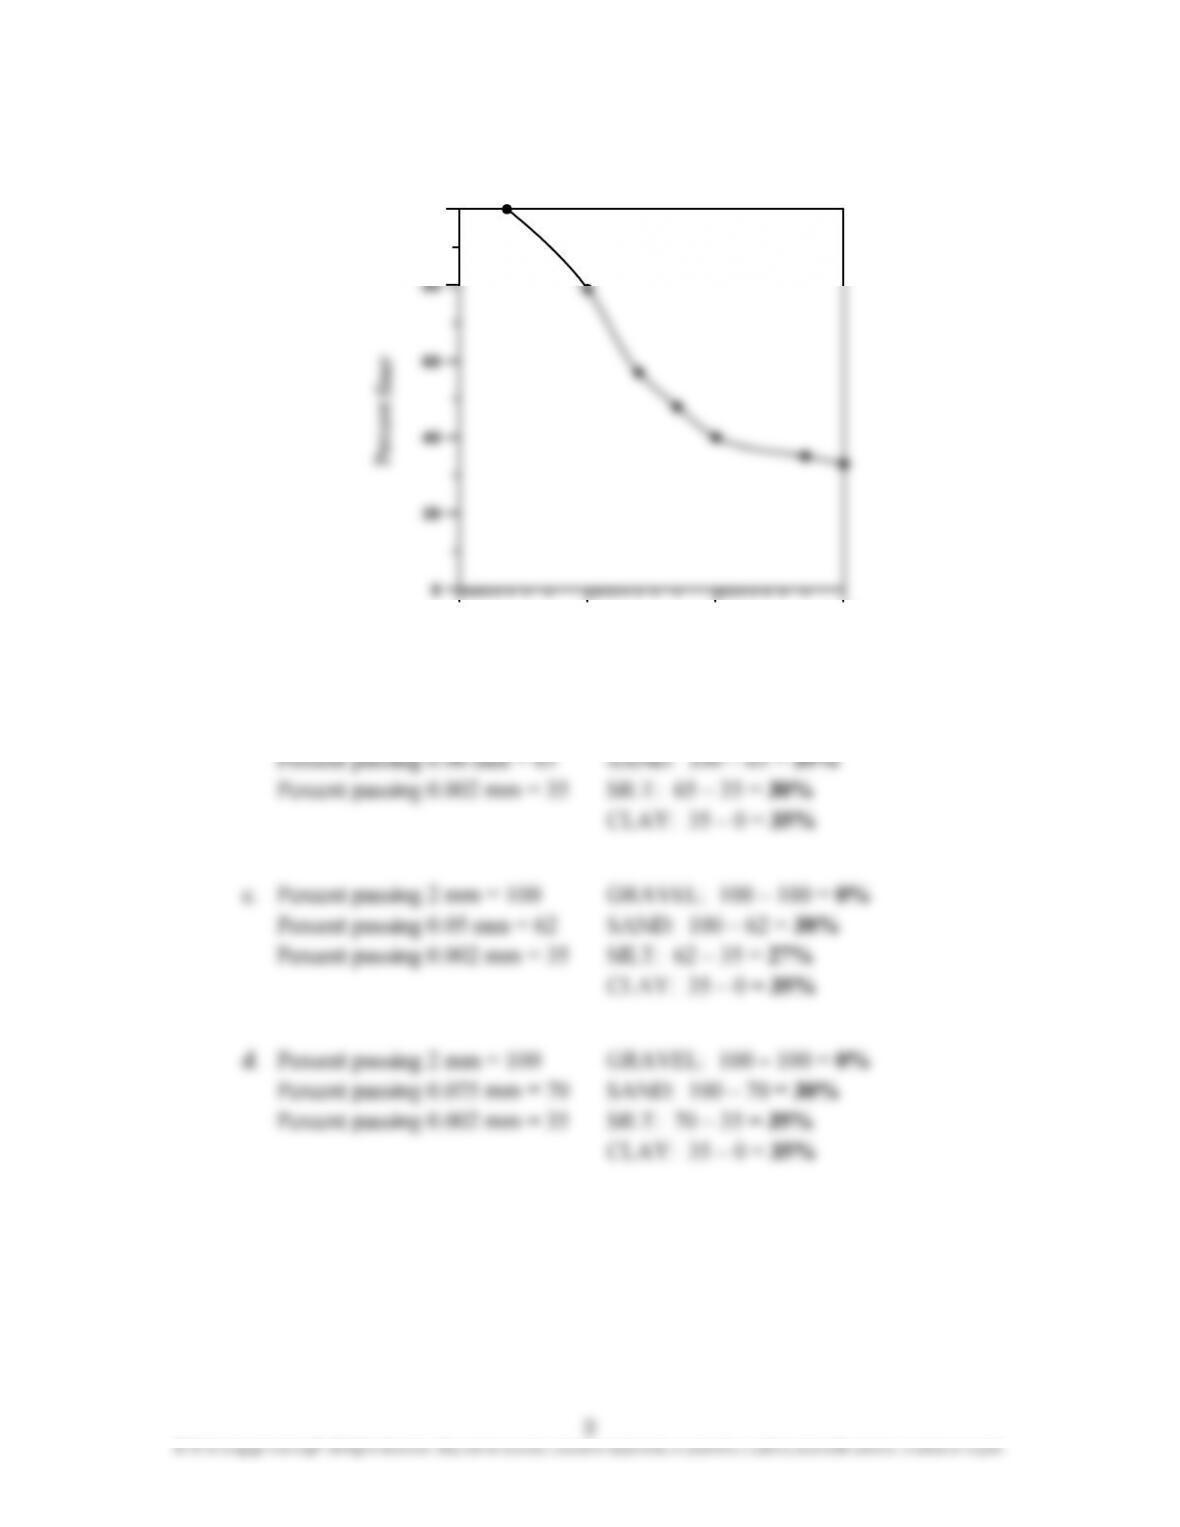
b. Percent passing 2 mm = 100 GRAVEL: 100 – 100 = 0%
Grain size (mm)
Percent finer
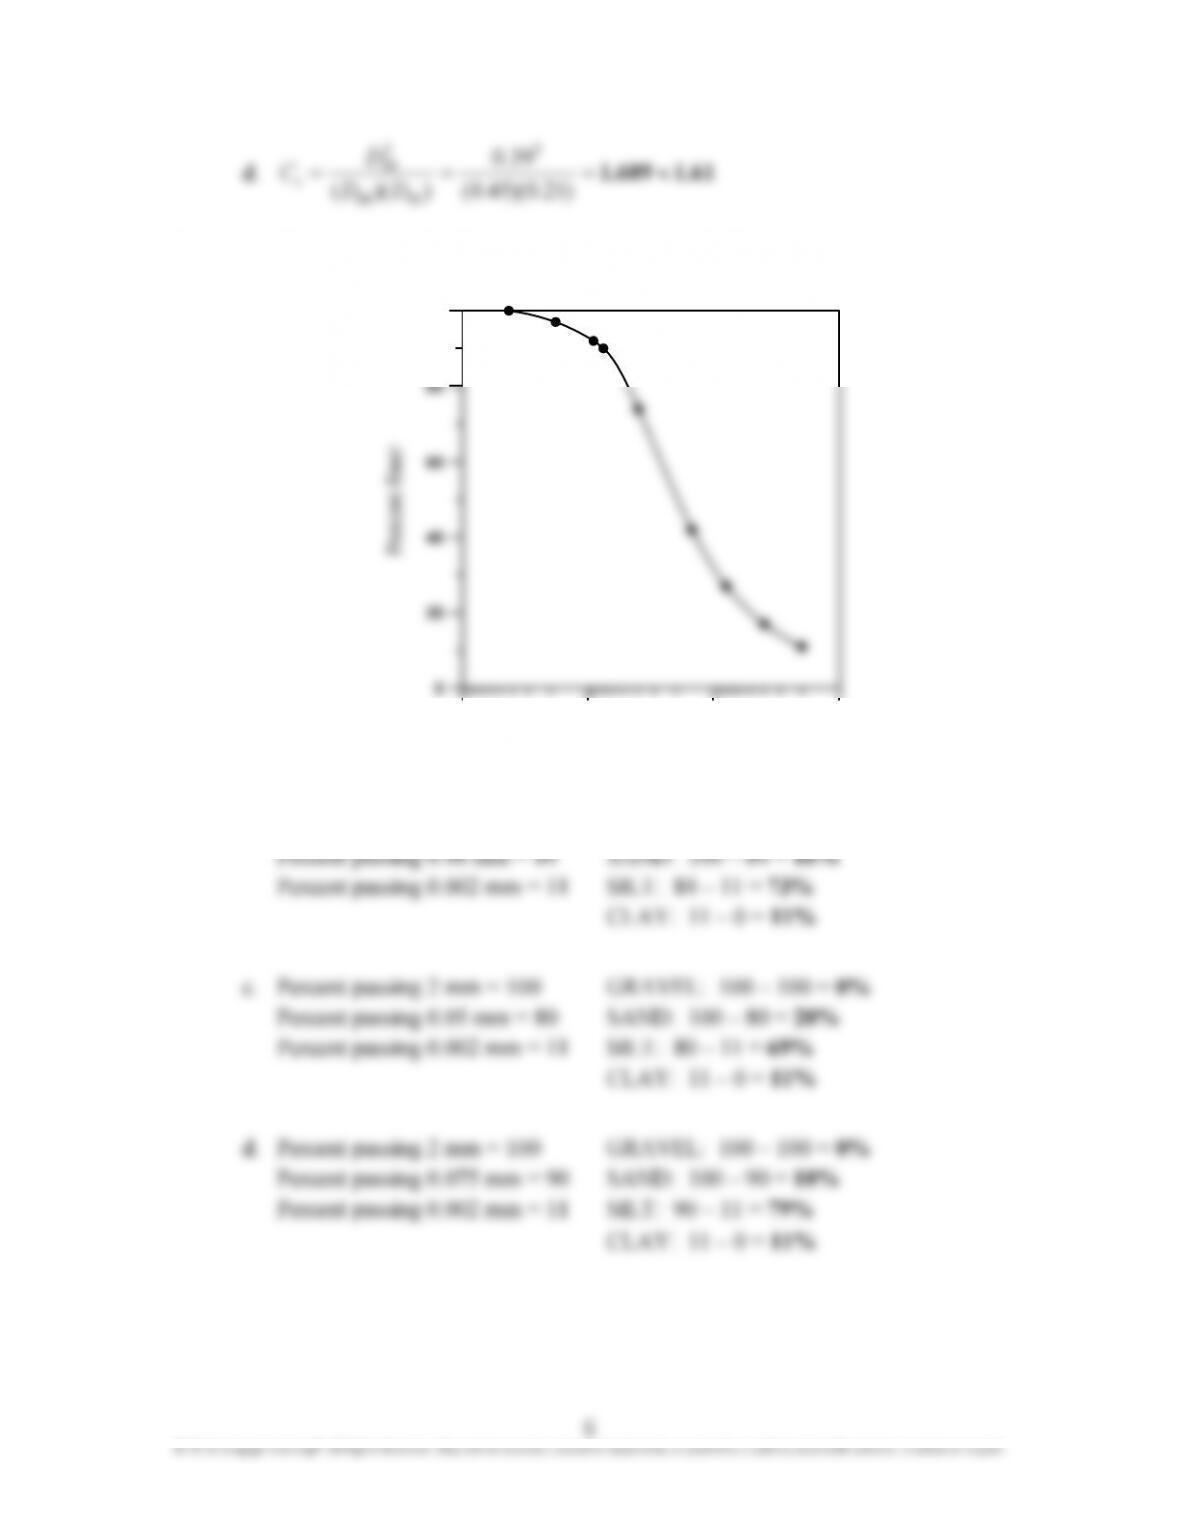
2.9 a. The grain-size distribution curve is shown in the figure.
1 0.1 0.01 0.001
Grain Size (mm)
0
20
40
60
80
100
P
e
r
c
e
n
t
F
i
n
e
r
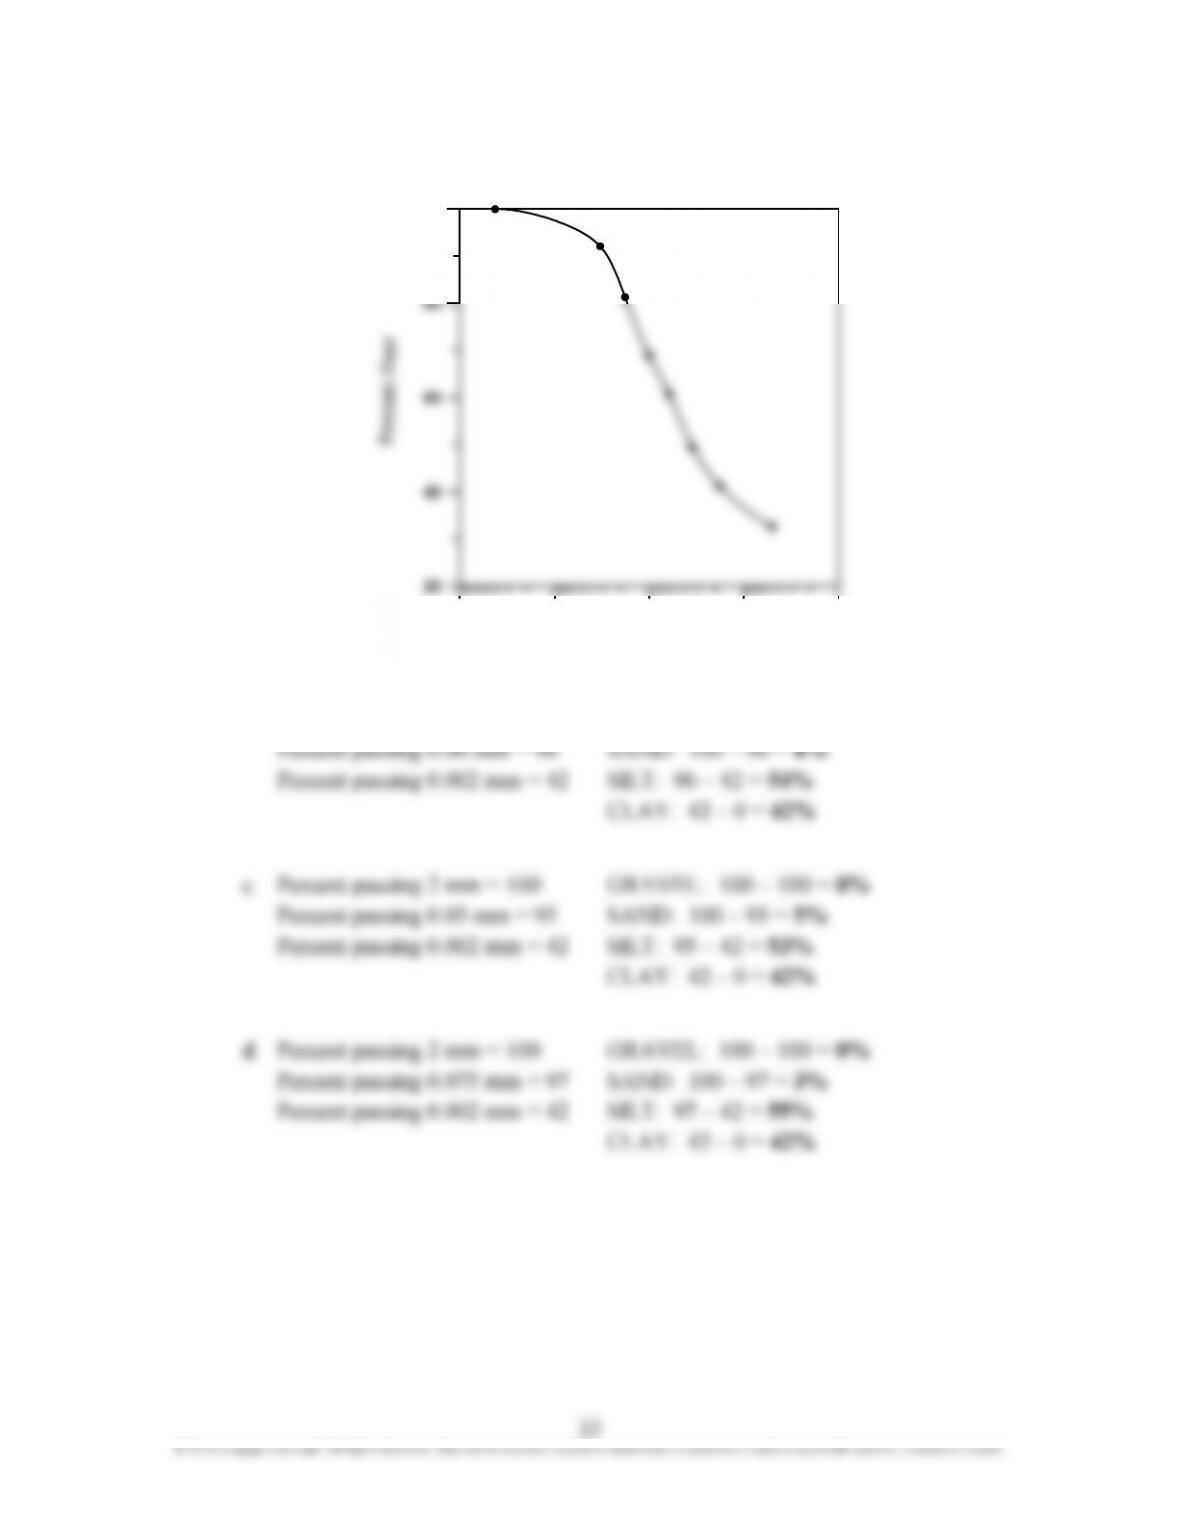
b. Percent passing 2 mm = 100 GRAVEL: 100 – 100 = 0%
Grain size (mm)
Percent finer
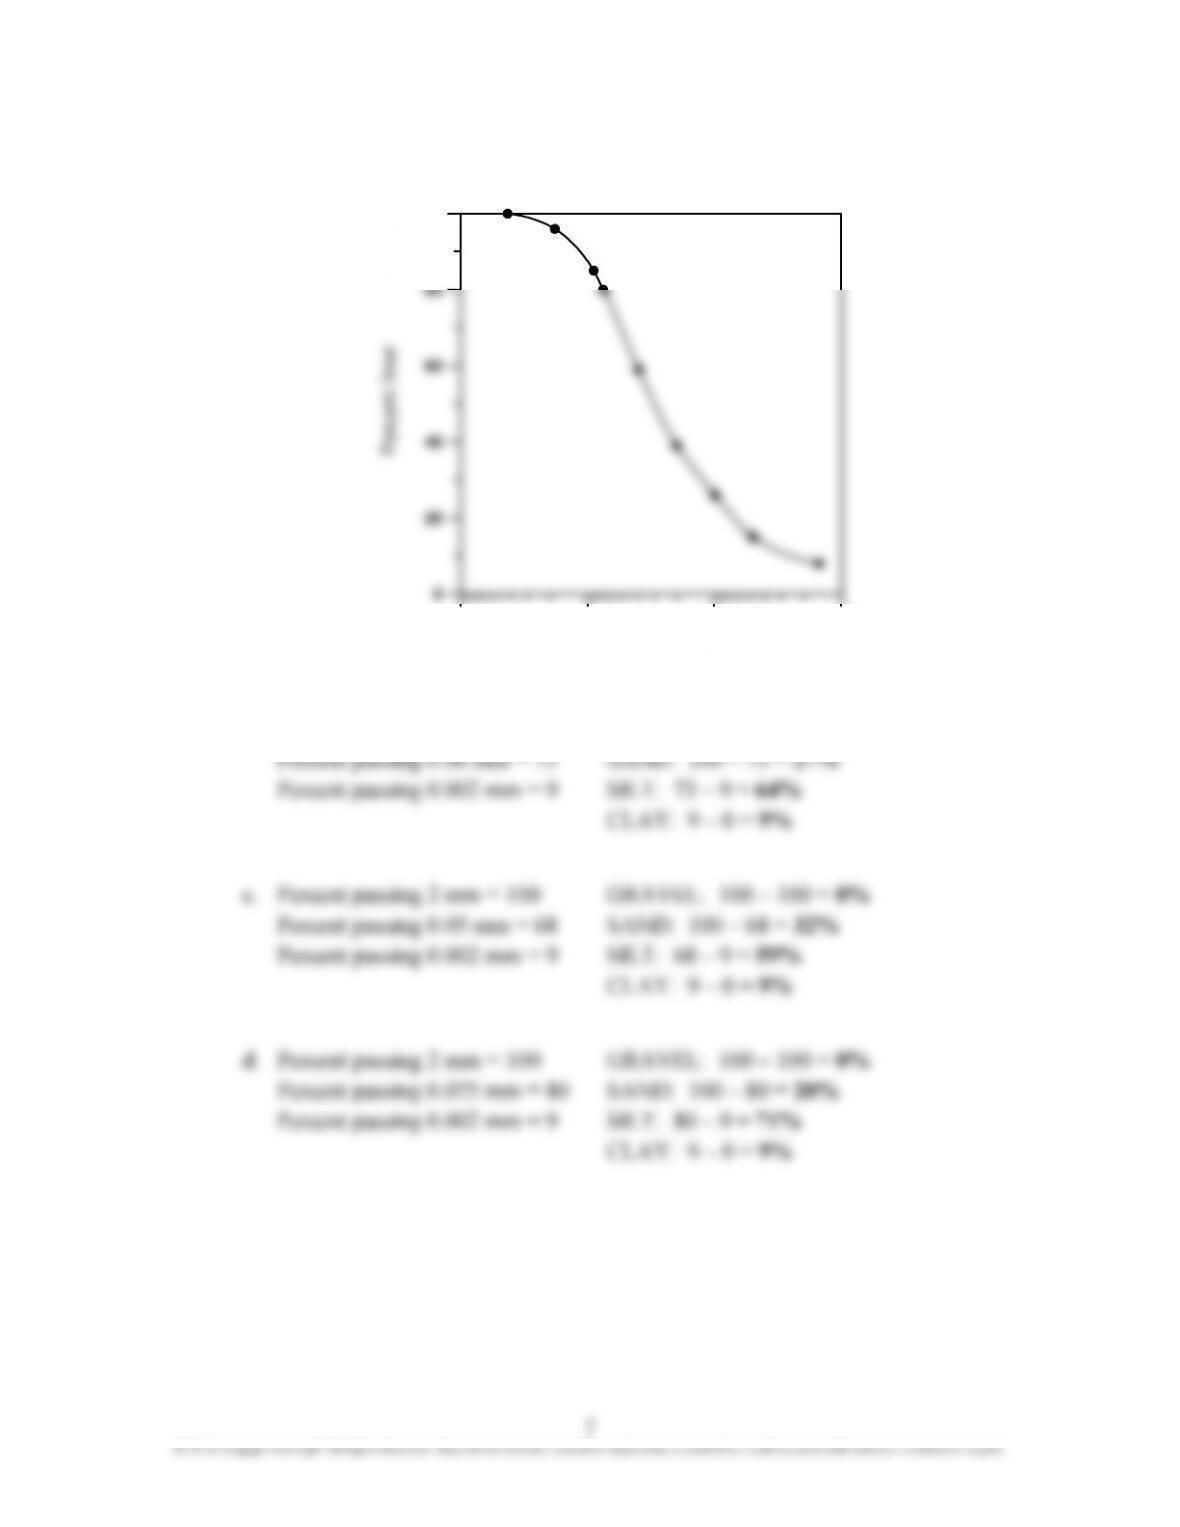
2.10 a. The grain-size distribution curve is shown in the figure.
1 0.1 0.01 0.001
Grain Size (mm)
0
20
40
60
80
100
P
e
r
c
e
n
t
F
i
n
e
r
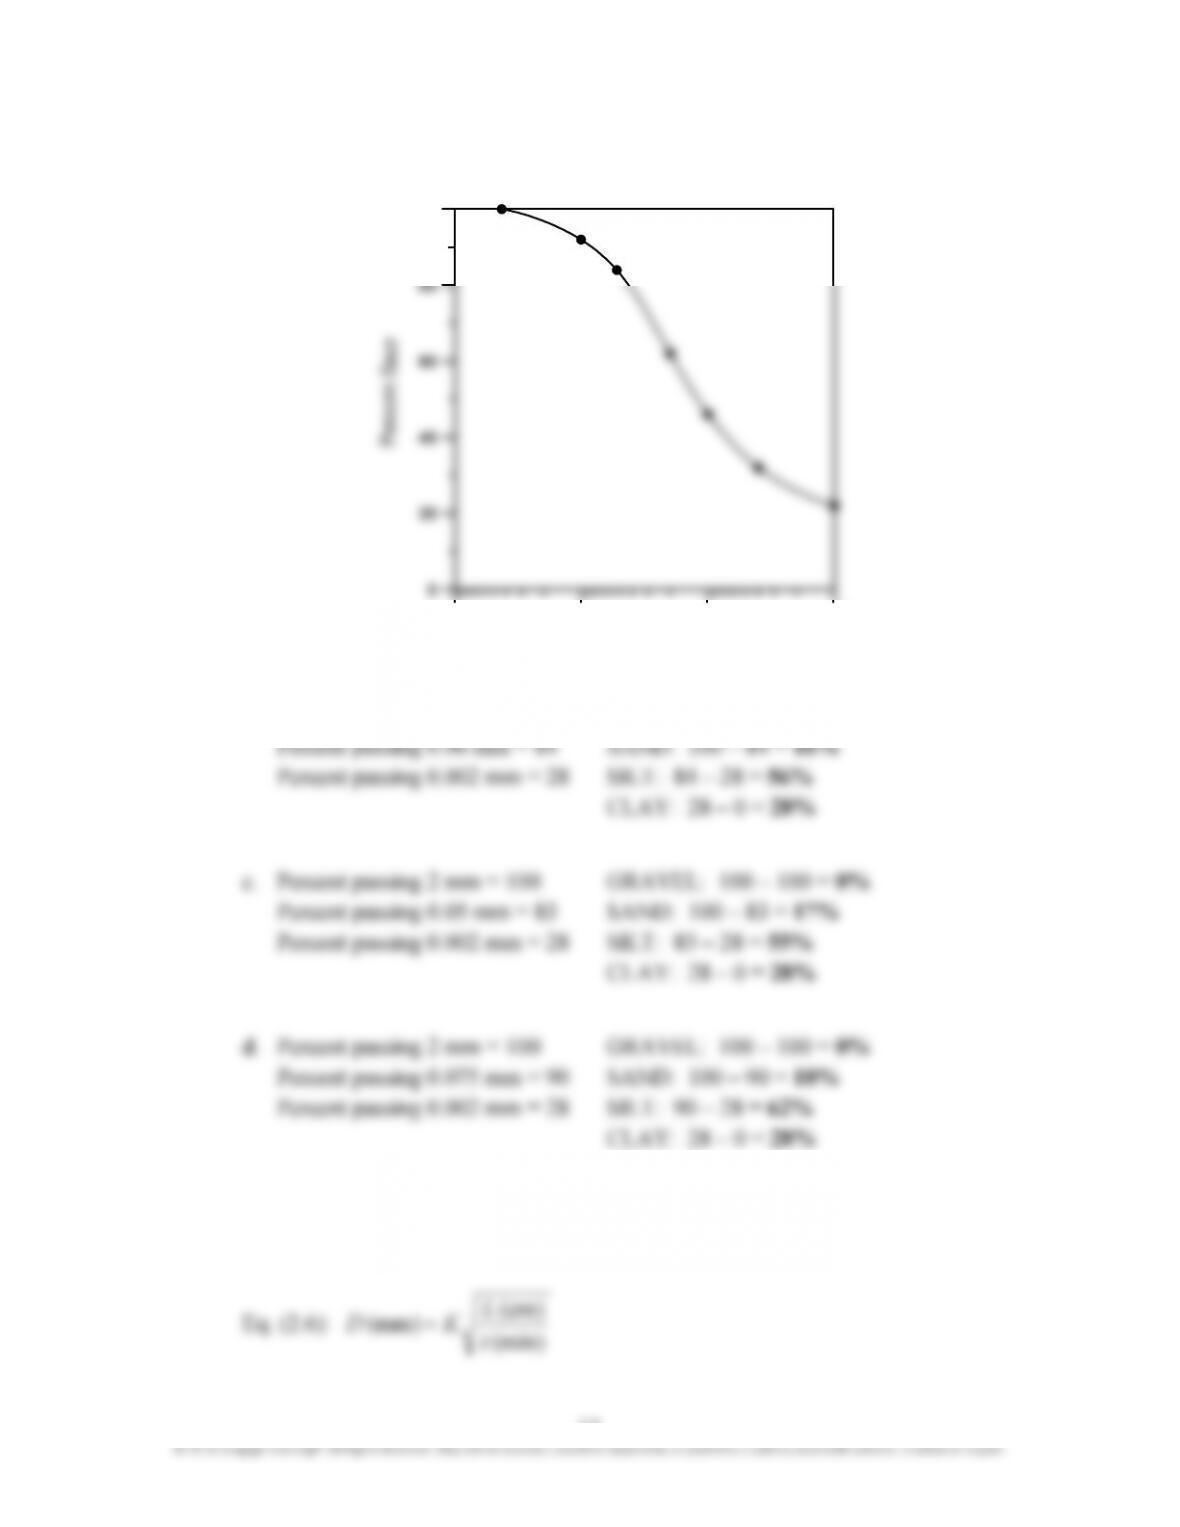
b. Percent passing 2 mm = 100 GRAVEL: 100 – 100 = 0%
Grain size (mm)
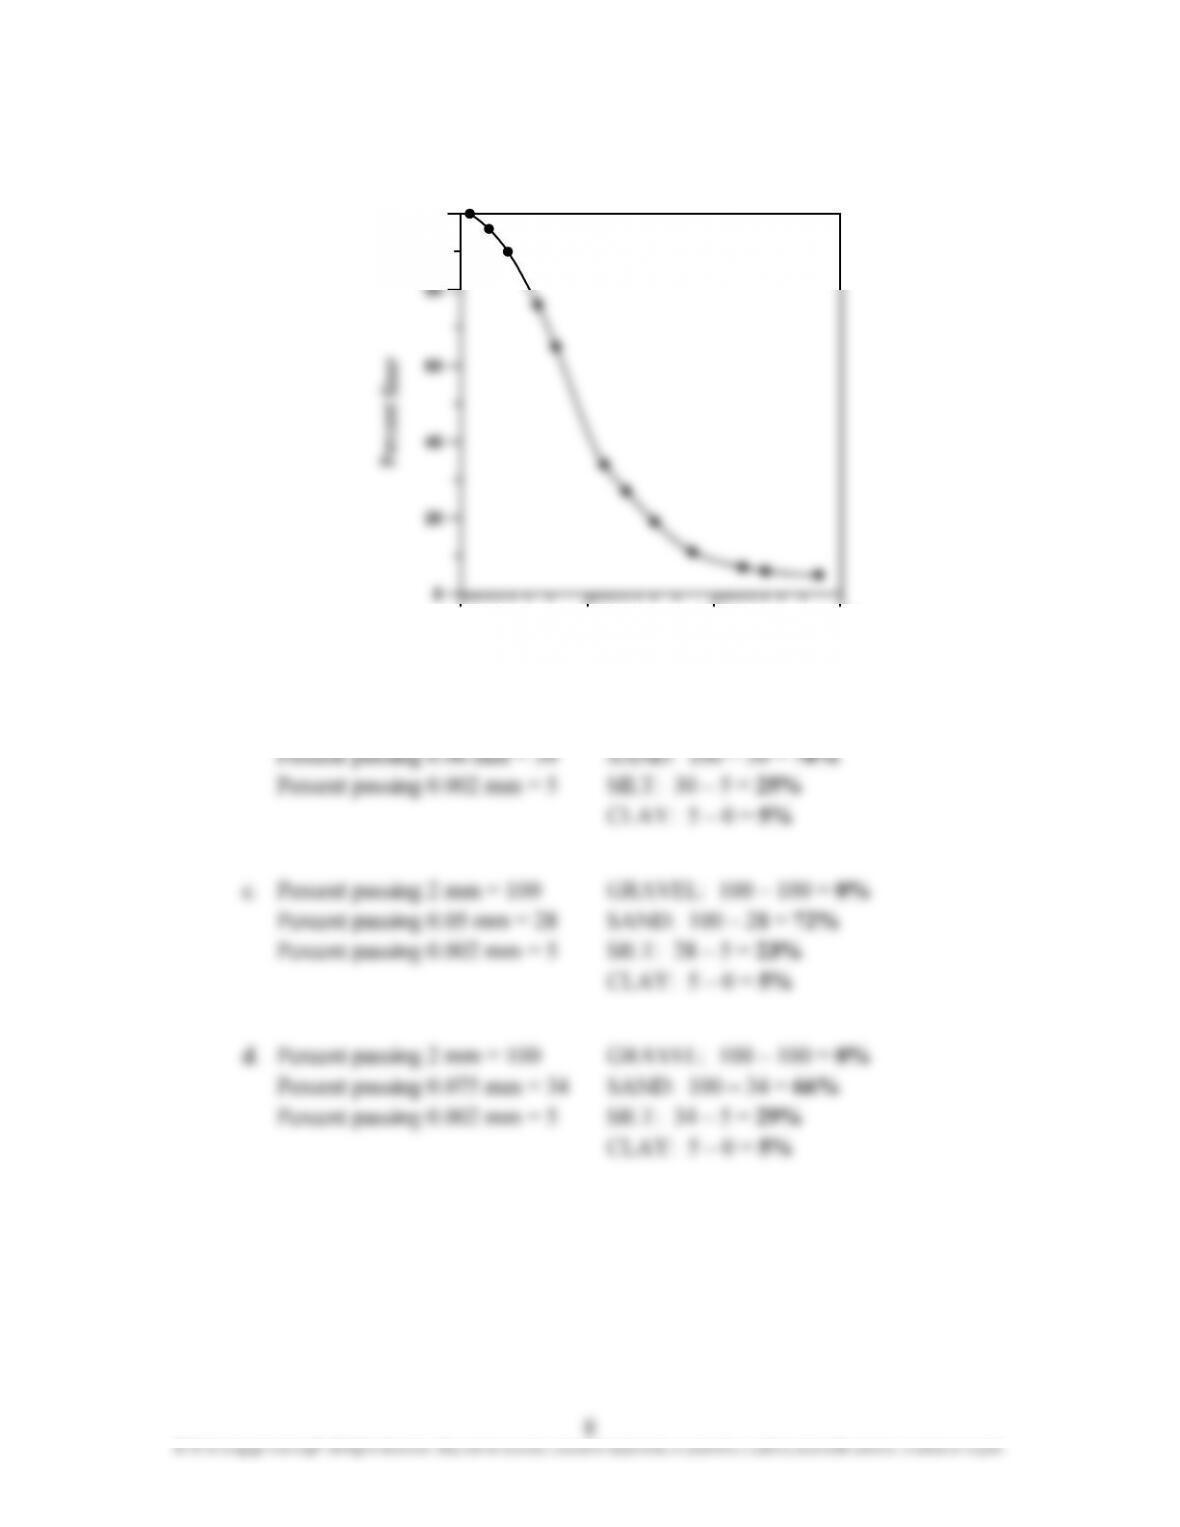
2.11 a. The grain-size distribution curve is shown in the figure.
1 0.1 0.01 0.001
Grain Size (mm)
0
20
40
60
80
100
P
e
r
c
e
n
t
F
i
n
e
r
b. Percent passing 2 mm = 100 GRAVEL: 100 – 100 = 0%
Grain size (mm)
2.12 a. The grain-size distribution curve is shown in the figure.
1 0.1 0.01 0.001 0.0001
Grain Size (mm)
20
40
60
80
100
P
e
r
c
e
n
t
F
i
n
e
r
b. Percent passing 2 mm = 100 GRAVEL: 100 – 100 = 0%
Grain size (mm)
11
2.13 a. The grain-size distribution curve is shown below.
1 0.1 0.01 0.001
Grain Size (mm)
0
20
40
60
80
100
P
e
r
c
e
n
t
F
i
n
e
r
b. Percent passing 2 mm = 100 GRAVEL: 100 – 100 = 0%
2.14 G
s
= 2.65; temperature = 26°C; time = 45 min.; L = 10.4 cm.
Grain size (mm)
12
© 2018 Cengage Learning®. All Rights Reserved. May not be scanned, copied or duplicated, or posted to a publicly accessible website, in whole or in part.
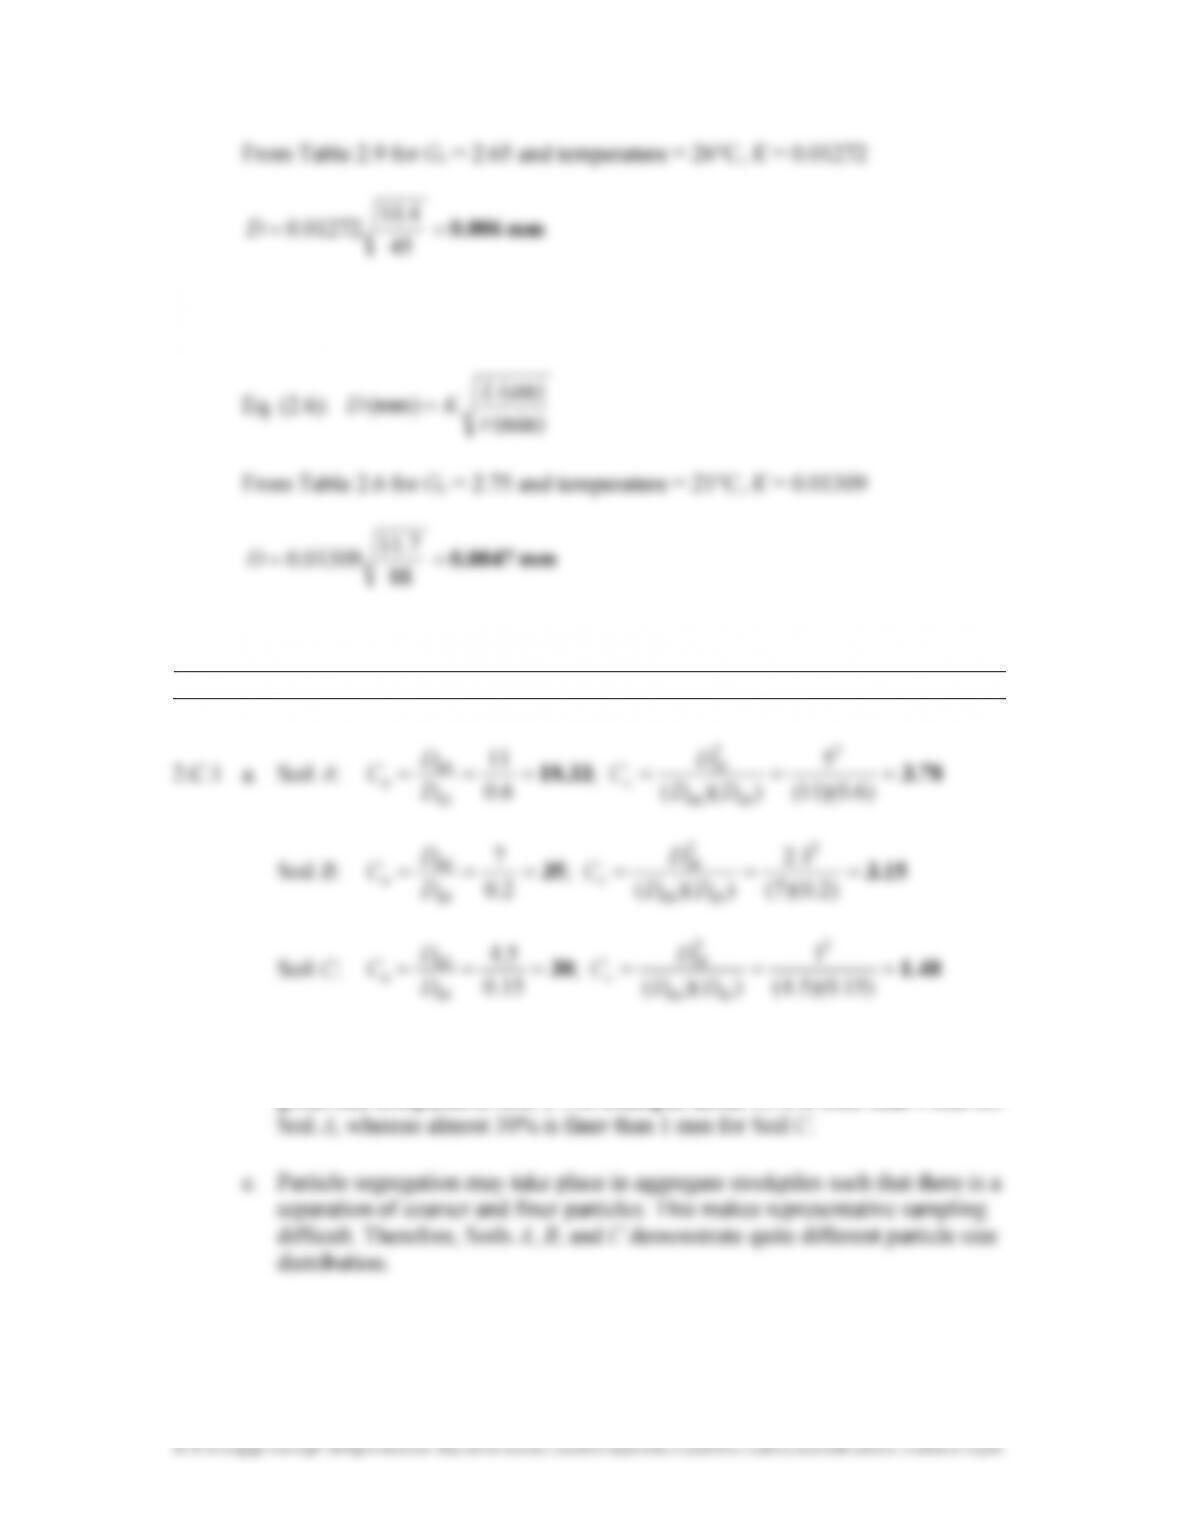
From Table 2.9 for G
s
= 2.65 and temperature = 26°C, K = 0.01272
mm0.006
45
10.4
01272.0 ==D
2.15 G
s
= 2.75; temperature = 21°C; time = 88 min.; L = 11.7 cm
88
CRITICAL THINKING PROBLEMS
15.0
10
D
u
))((
1060
DD
c
b. Soil A is coarser than Soil C. A higher percentage of soil C is finer than any
given size compared to Soil A. For example, about 15% is finer than 1 mm for
d. Soil A
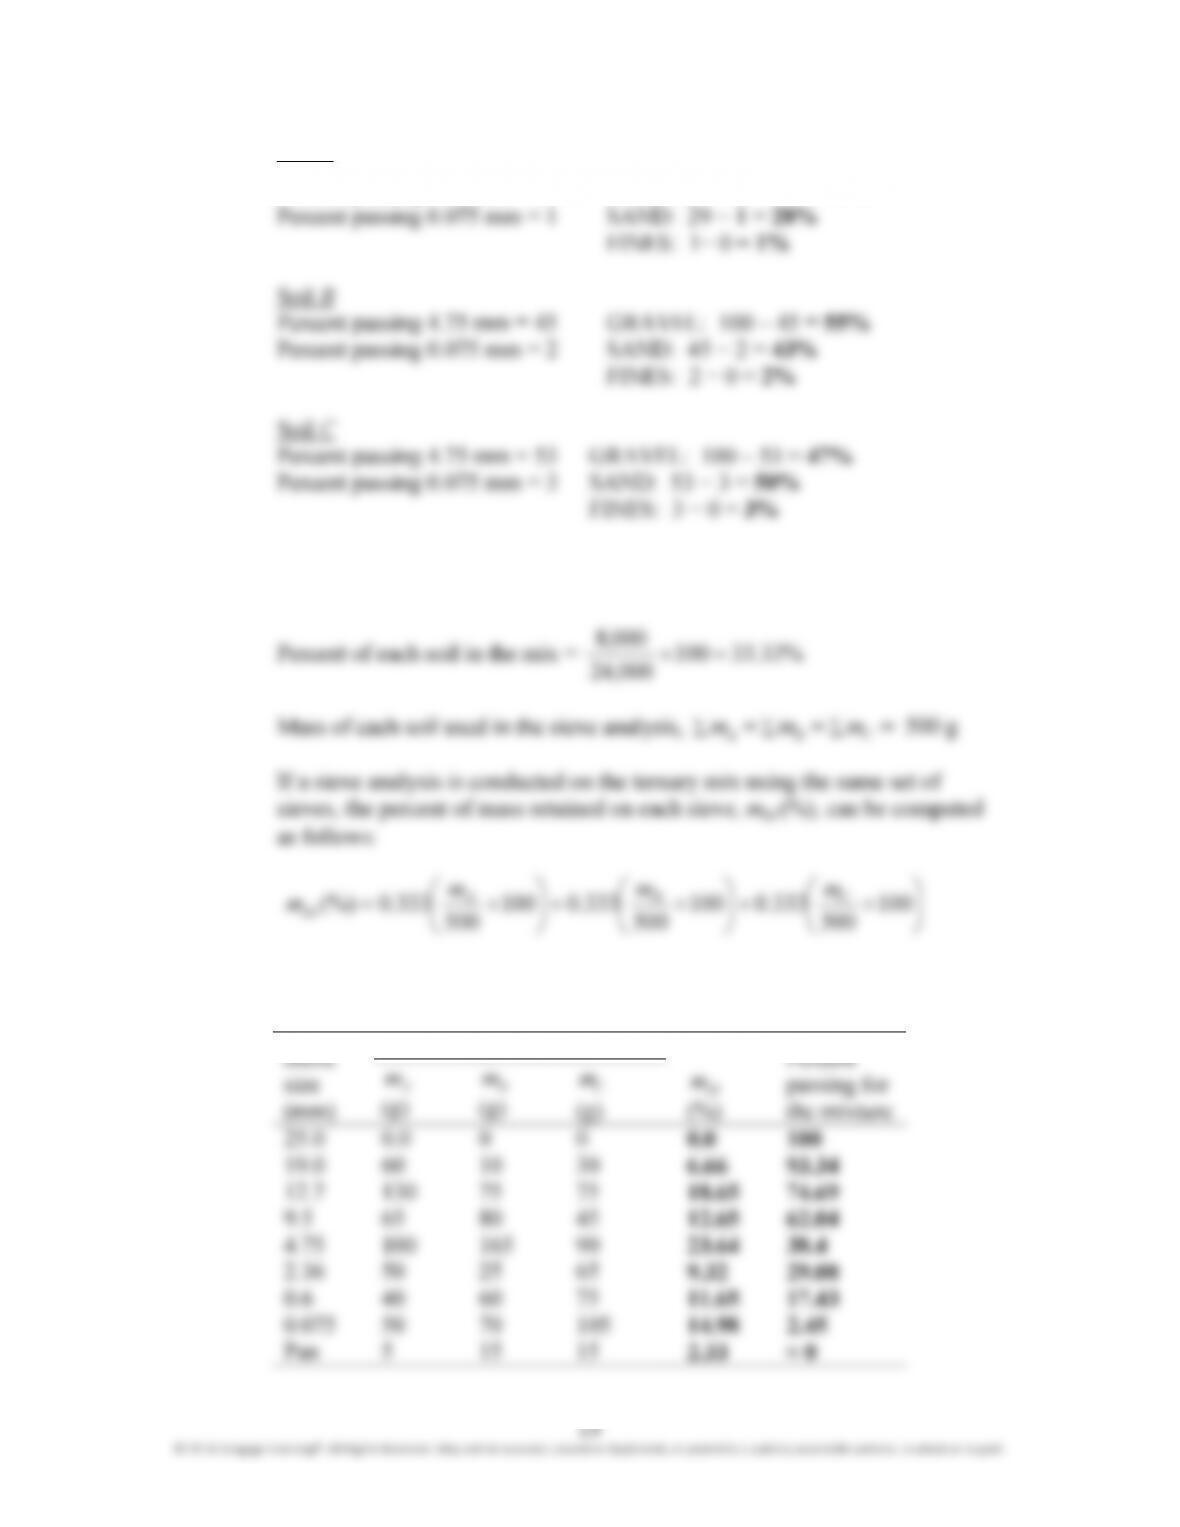
Percent passing 4.75 mm = 29 GRAVEL: 100 − 29 = 71%
2.C.2 a. Total mass in the ternary mix = 8000 × 3 = 24,000 kg
000,8 =×
500
500
500
M
The calculated values are shown in the following table.
Mass retained
14
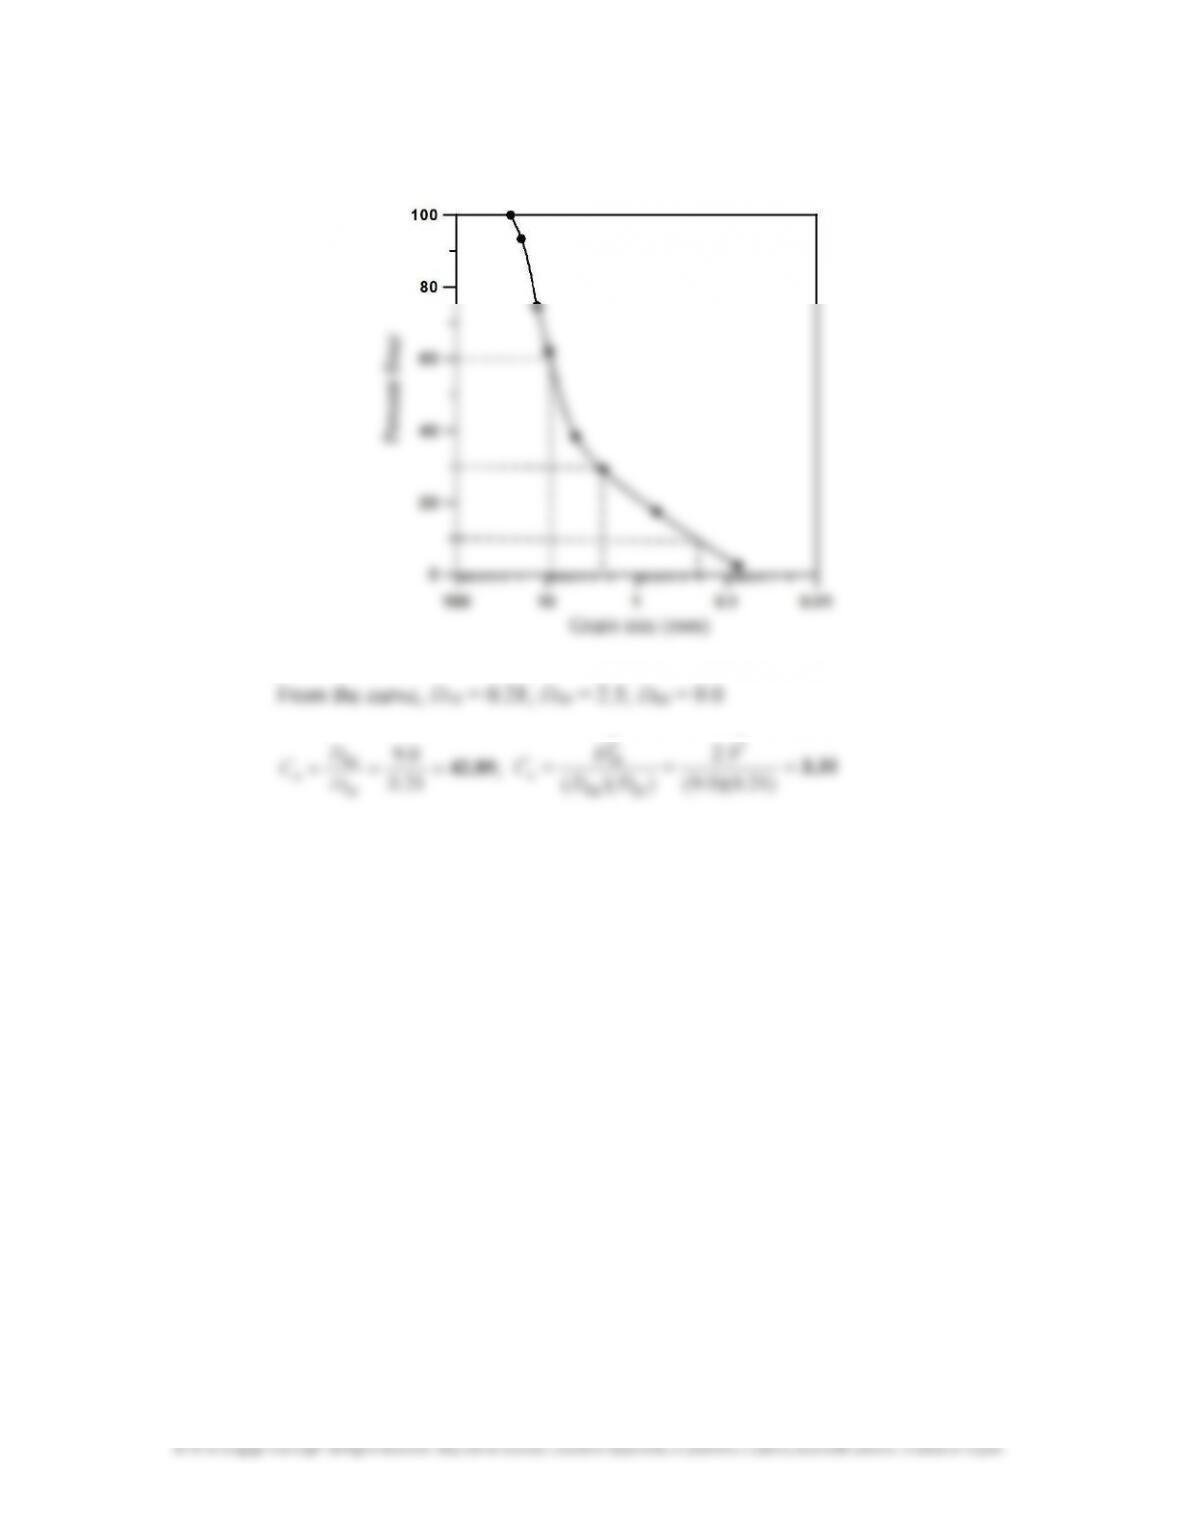
b. The grain-size distribution curve for the mixture is drawn below.
21.0
10
u
))((
1060
DD
Grain size (mm)