97
Chapter 11
11.1
fs
s
s
e
II
E
µ
BασS
2
)center flexible,(
1
)( −
′
∆=
2
kN/m 300
)2)(1(
600 ==∆
σ
1==
(rigid)e
11.2
fs
s
s
e
II
E
BS
2
)rigid(
1
)(93.0
µ
ασ
−
′
∆=
21
s
E z
z
∑ ∆
98
© 2018 Cengage Learning®. All Rights Reserved. May not be scanned, copied or duplicated, or posted to a publicly accessible website, in whole or in part.
Given: B = L = 8 ft; µ
s
= 0.4;
α
= 4
2
lb/ft 1360
)8)(8(
000,87 ≈=∆
σ
ft. 4
2
8
2
===
′B
B
21
1
21 FFI
s
s
s
µ
µ
−
−
+=
( ) ( )
25.5
28
21
2
1; ===
′
==
′B
H
n
B
L
m
From Table 11.1, F
1
= 0.443; from Table 11.2, F
2
= 0.029.
(rigid)
628, 416
e
11.3
cm 056.1
)1)(72.2()175.3)((
91
2
===
π
ws
s
s
γAG
W
H
σ
′
2
Final height, H
H
s
H
v
= H – H
s
v
H
H
e=
99
2
11.4 a. The plot of e vs.
σ
′ is shown.
c
100
© 2018 Cengage Learning®. All Rights Reserved. May not be scanned, copied or duplicated, or posted to a publicly accessible website, in whole or in part.
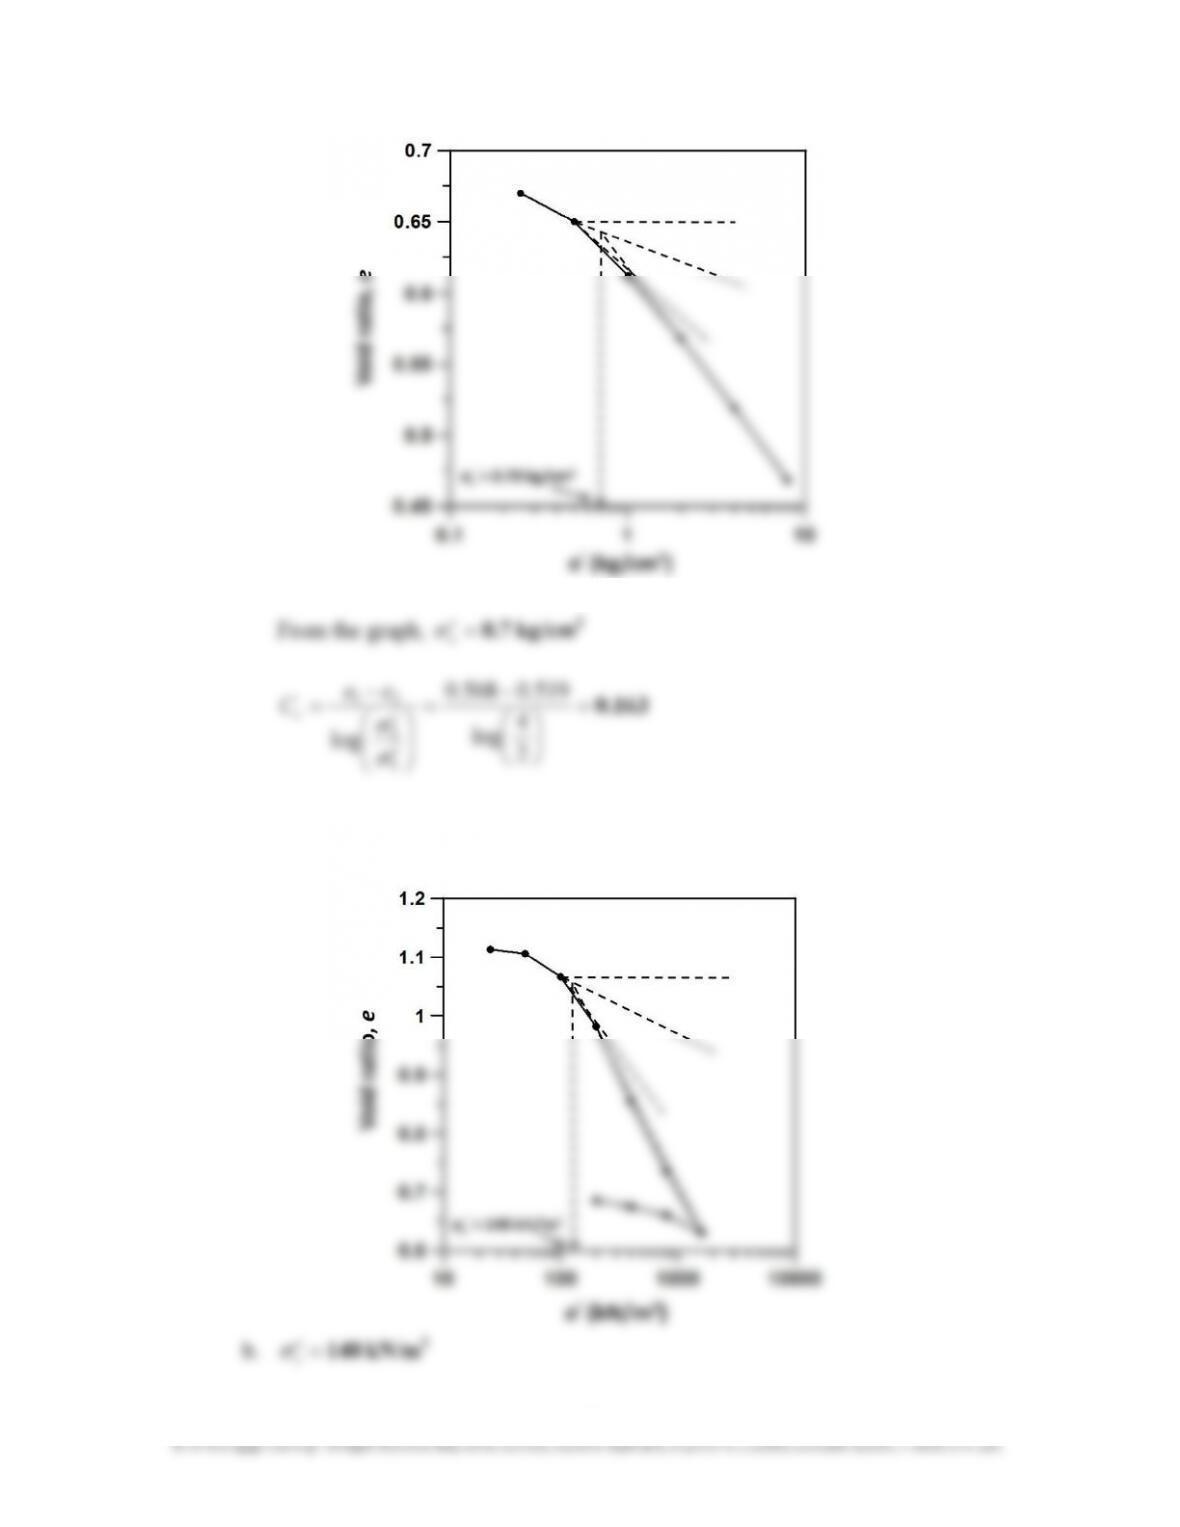
c.
0.39≈
−
=
′
′
−
=
400
800
log
735.0855.0
log
1
2
21
σ
σ
ee
C
c
d.
049.0
400
800
log
66.0675.0
log
1
2
21
=
−
=
′
′
−
=
σ
σ
ee
C
s
0.125
==
39.0
049.0
c
s
C
C
11.5 a. Height of solids:
in. 0.087 cm 222.0
)1)(55.2(4)(4.91)(2.5
18
2
==== g
γAG
W
H
ws
s
s
σ′
(ton/ft
2
)
Change in
dial reading
(in.)
Final
height, H
(in.)
H
s
(in.)
H
v
= H – H
s
(in.)
s
v
H
H
e=
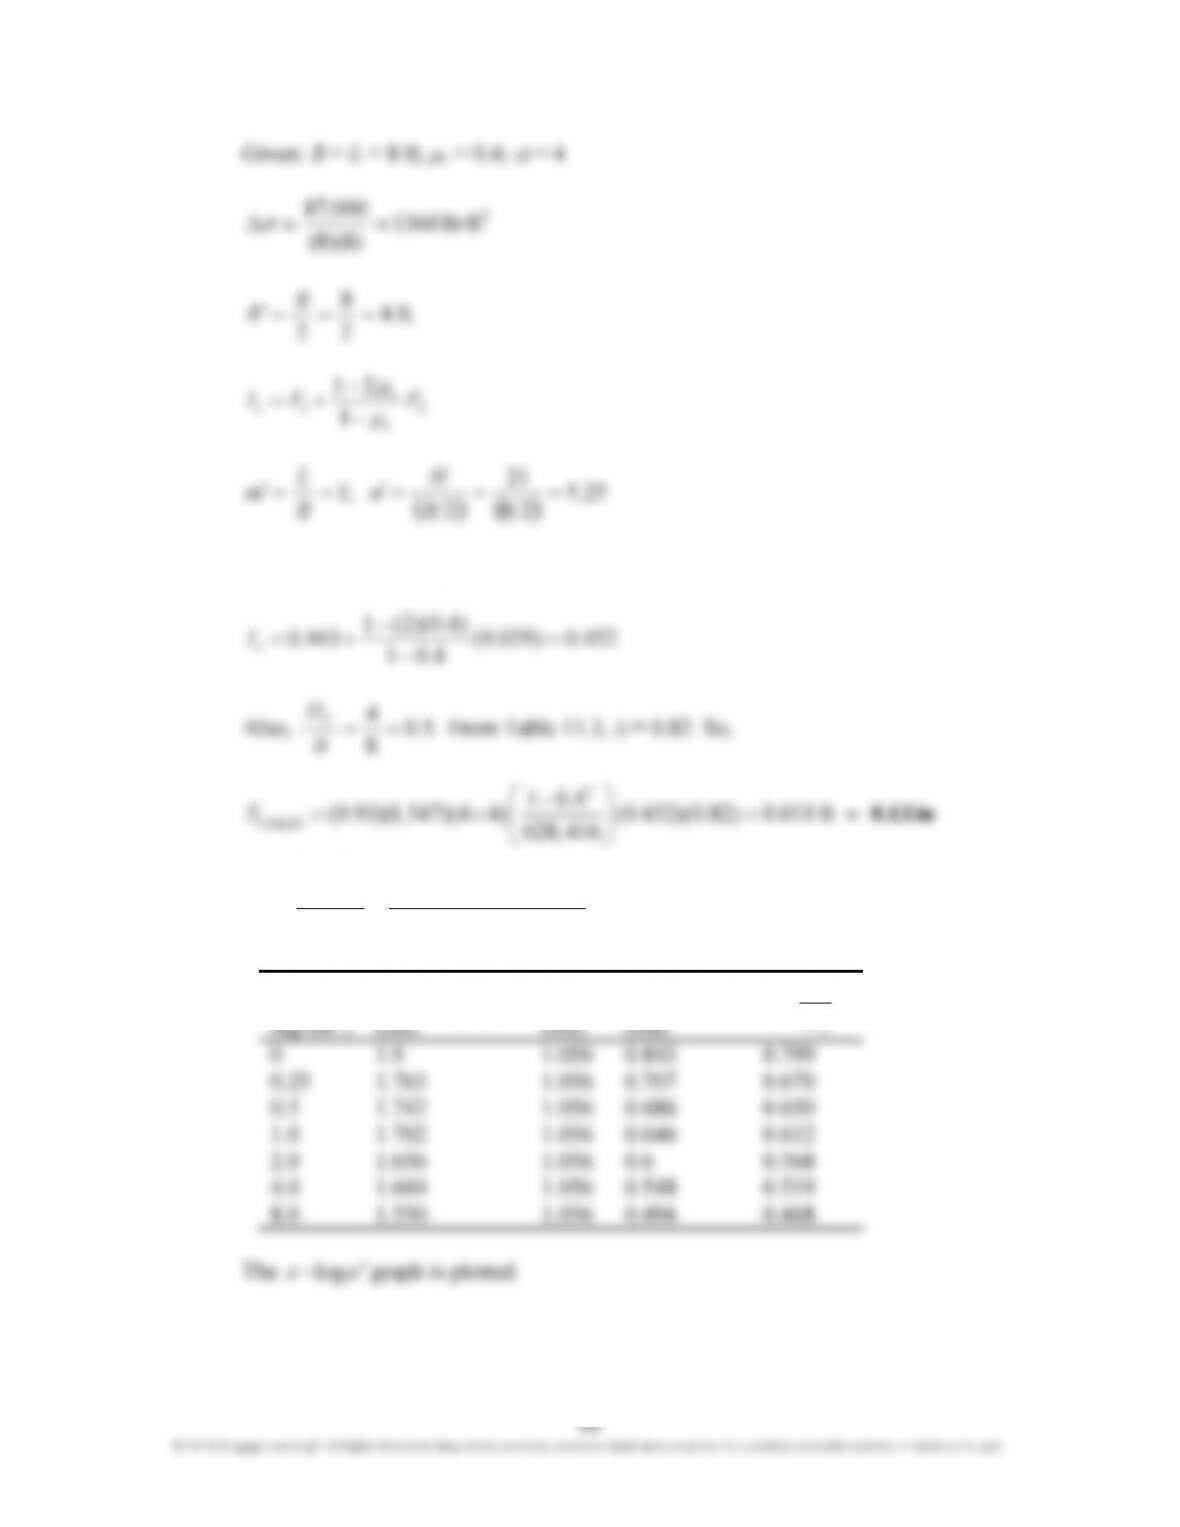
The e-log
σ
′ graph is given.
b. From the graph,
2
5.88=
−
=
2
4
log
80.357.5
101
11.6
195.1
2000
4000
log
36.172.1
log
1
2
21
=
−
=
′
′
−
=
σ
σ
ee
C
c
11.7 a.
′
′
∆+
′
+
=
o
o
o
c
c
e
HC
S
σ
σσ
log
1
11.8 Eq. (11.75):
6
4
av
bmt
σ
σ
σ
σ
′
∆
+
′
∆
+
′
∆
=
′
∆
102
m
1
z
(m)
2Bb =
(m)
bzn =
1
q
(kN/m
2
)
I
4
(Table 10.11)
∆
σ
′
= qI
4
(kN/m
2
)
+
82.01
c
11.9 Refer to the solution of Problem 11.4:
From the e-log
σ′
curve, 140=
′
c
σ
kN/m
2
; C
c
= 0.39; C
s
= 0.049
11.10 a.
lb/ft 1502.2 = 9)(62.4)(8(119)
2
16
+ (9)(123) + (4.5)(112) =
2
+−
′
o
σ
103
© 2018 Cengage Learning®. All Rights Reserved. May not be scanned, copied or duplicated, or posted to a publicly accessible website, in whole or in part.
in. 7.61 ft 0.634 ≈=
+
+
=2.1502
9302.1502
log
71.01
)16)(324.0(
c
S
b. Since
c
σσσ
′
>=+=
′
∆+
′
2.24329302.1502
0
,
∆
log log
1 1
0 324 (16)
2100 (0 324)(16) 1502 2 930
5log log
1 0 71 1502 2 1 0 71 2100
s c c o
c
o o o c
C H σ C H σ σ
Se σ e σ
.
. .
. . .
′ ′ ′
+
= +
′ ′
+ +
+
= +
+ +
= ≈0.281 ft 3.37 in.
11.11
3
(sand)
kN/m 16.57
58
.
0
1
)81.9)(67.2(
1
=
+
=
+
=
e
γG
γ
ws
d
11.12 a.
465.0
1.2
2.4
log
84.098.0 =
−
=
c
C
104
© 2018 Cengage Learning®. All Rights Reserved. May not be scanned, copied or duplicated, or posted to a publicly accessible website, in whole or in part.
0.767=
−= 1.2
6
log465.098.0
3
e
b.
1.109=
−= 5.1
9.1
log
5
465.0
1.1
3
e
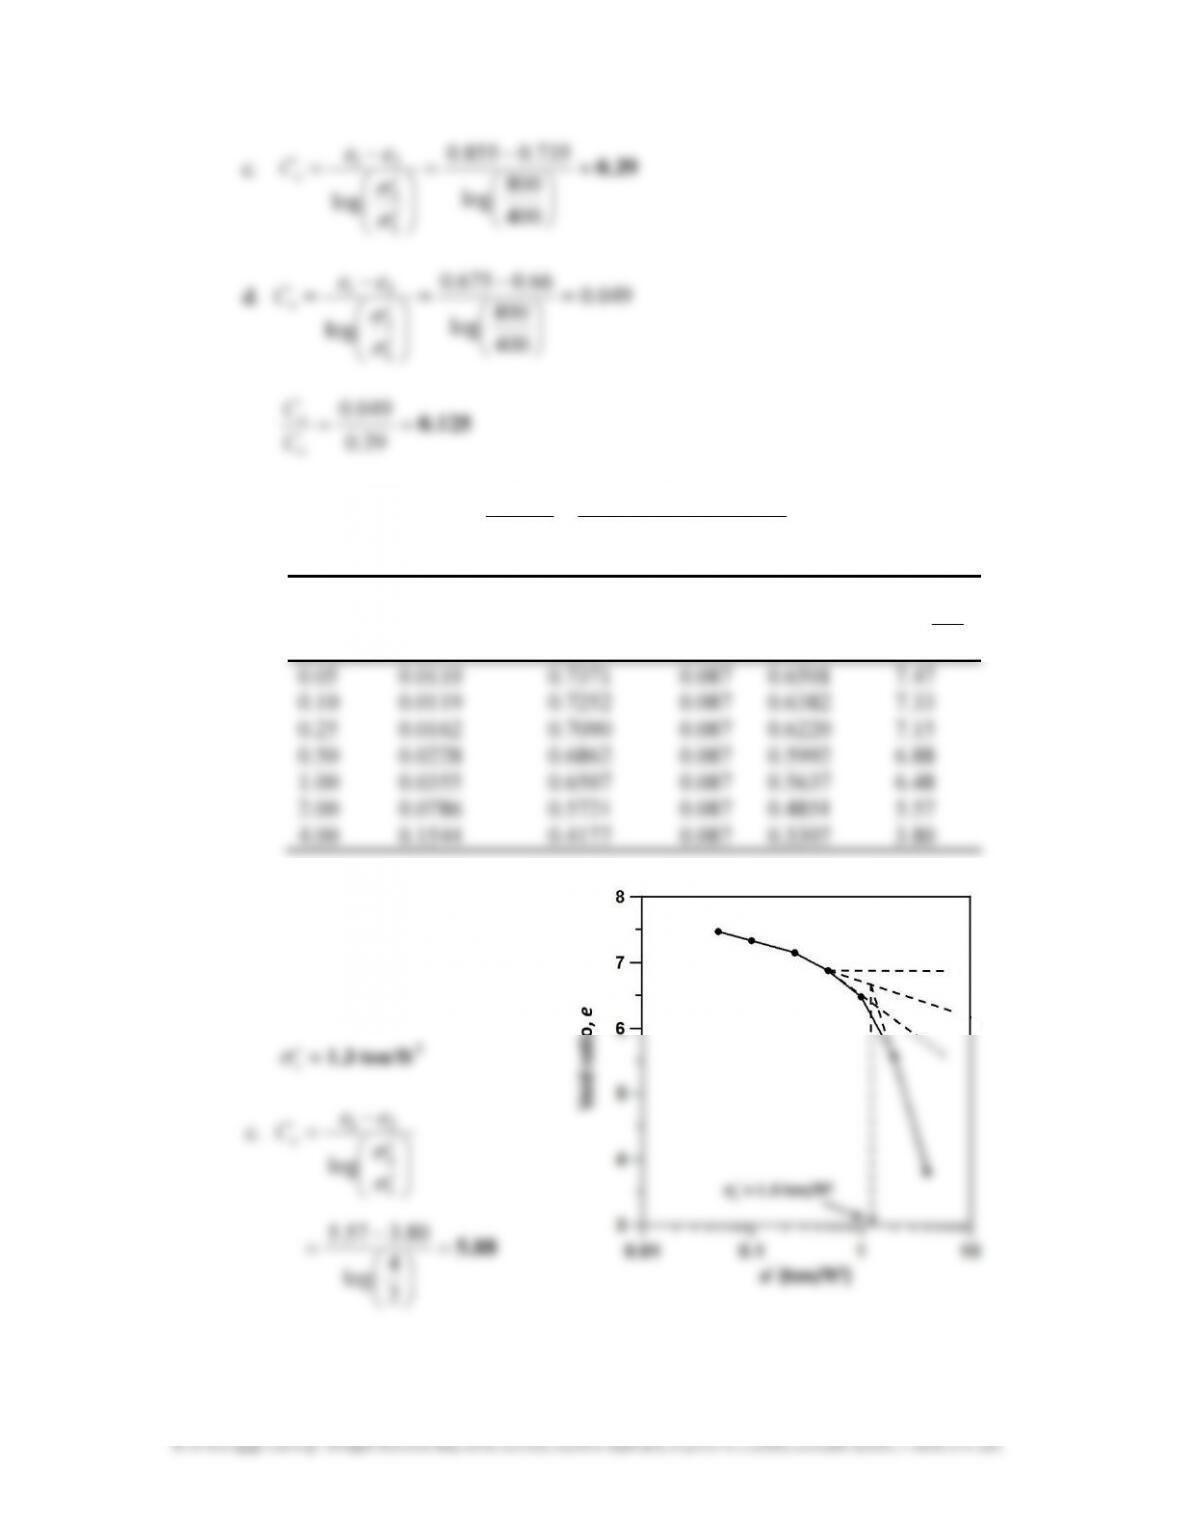
11.13 The plot of e−log
σ′
is shown.
2
m 0.33=
11.14
2
dr
H
tc
T
v
v
=
; U = 85%; T
v
= 0.684 (Table 11.7)
2
cm
2
750
11.15 a.
1
dr
=
H
z
;
33.0
2
750
)60)(24)(180)(18.0(
22
dr
=
== H
tc
T
v
v
Therefore,
kN/m 59.85=−=−= )43.01)(105()1(
0zz
Uuu
105
11.16 a.
avav
11 e
e
e
a
m
v
v
+
′
∆
∆
=
+
=
σ
11.17 In the laboratory:
2
dr
75
75
H
tc
T
v
=
2
m) (6
106
© 2018 Cengage Learning®. All Rights Reserved. May not be scanned, copied or duplicated, or posted to a publicly accessible website, in whole or in part.
t
55
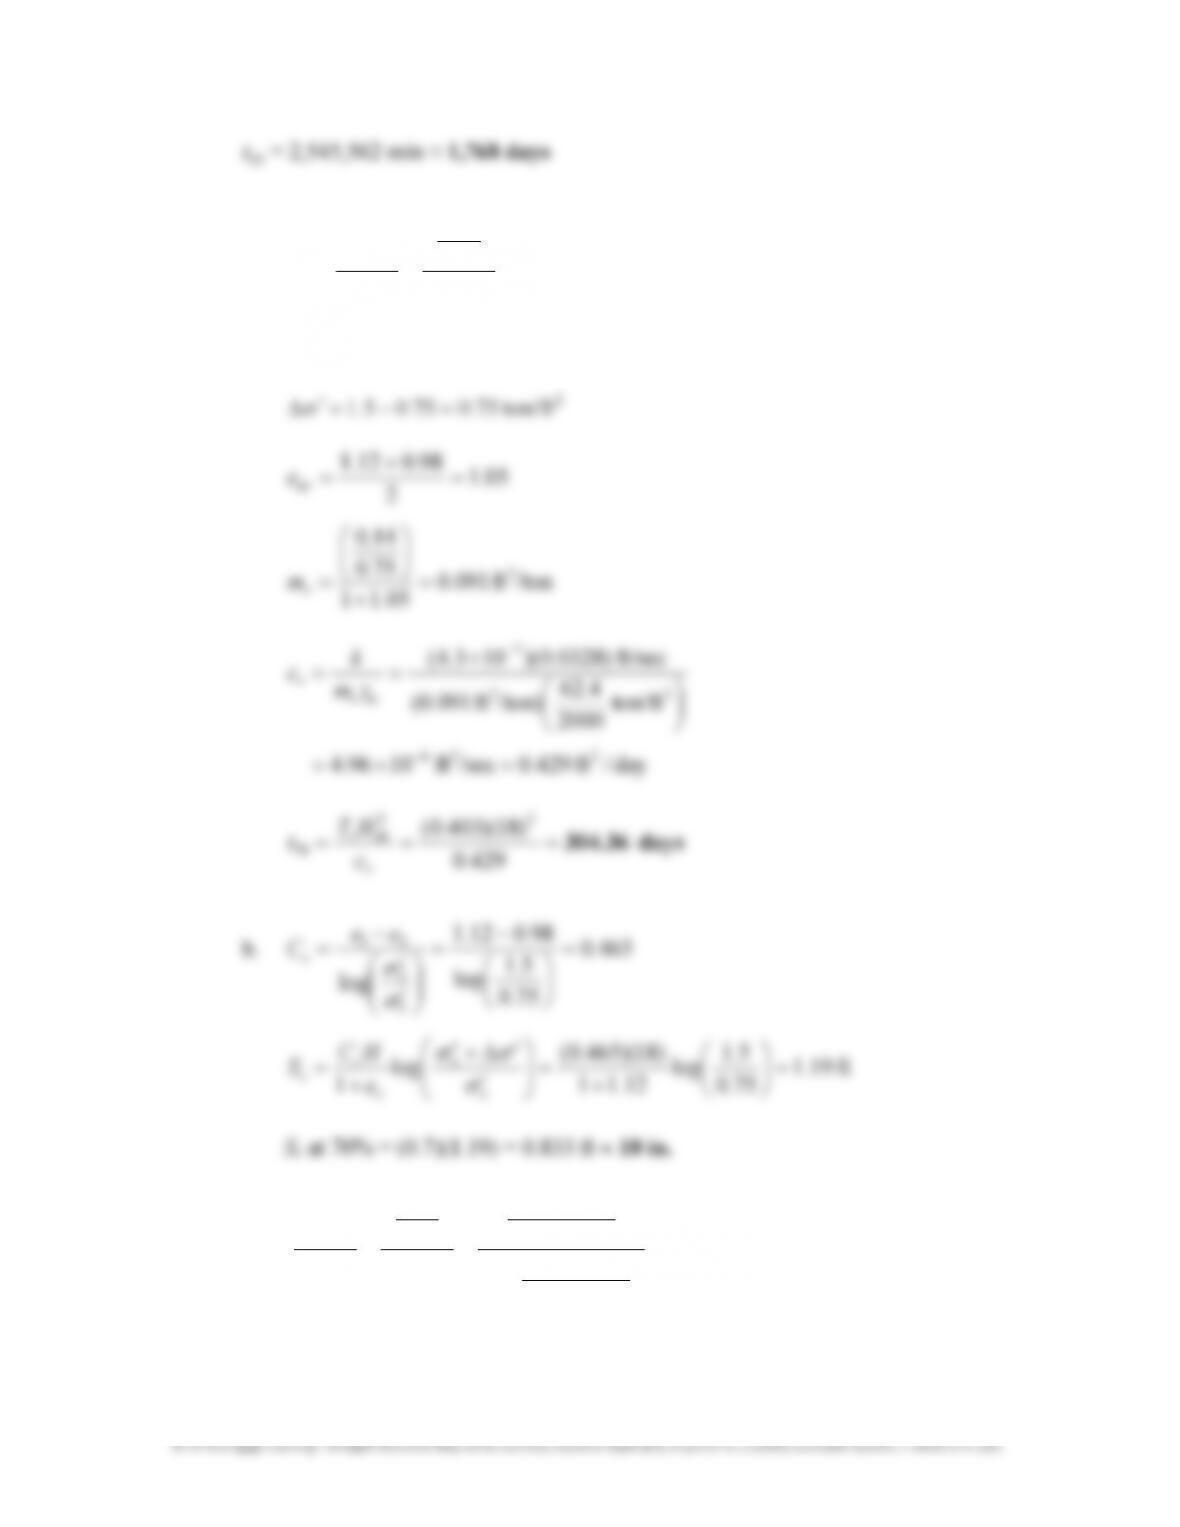
= 2,545,562 min ≈ 1,768 days
11.18 a.
avav
11 e
e
e
a
m
v
v
+
′
∆
∆
=
+
=
σ
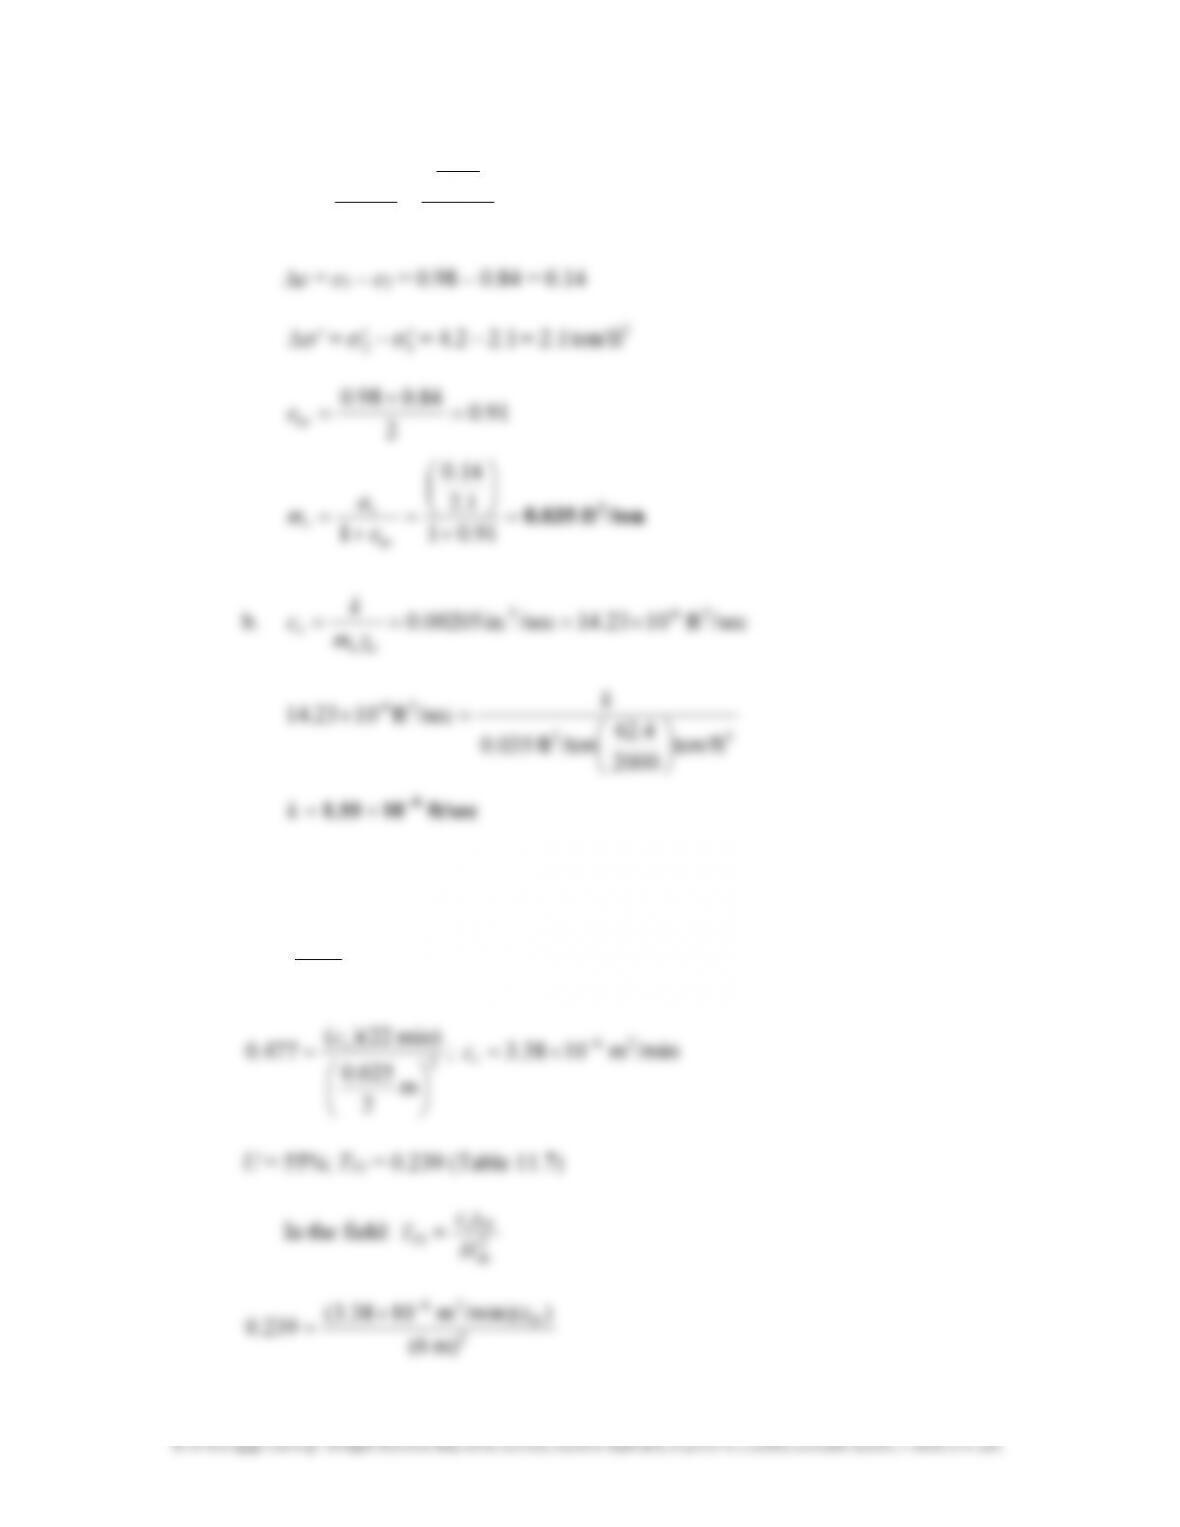
∆e = 1.12 – 0.98 = 0.14
2
11.19 /kNm 10 42.5
2
77.092.0
1
150300
77.092.0
11
24
avav
−
×=
+
+
−
−
=
+
′
∆
∆
=
+
=e
e
e
a
m
v
v
σ
107
© 2018 Cengage Learning®. All Rights Reserved. May not be scanned, copied or duplicated, or posted to a publicly accessible website, in whole or in part.
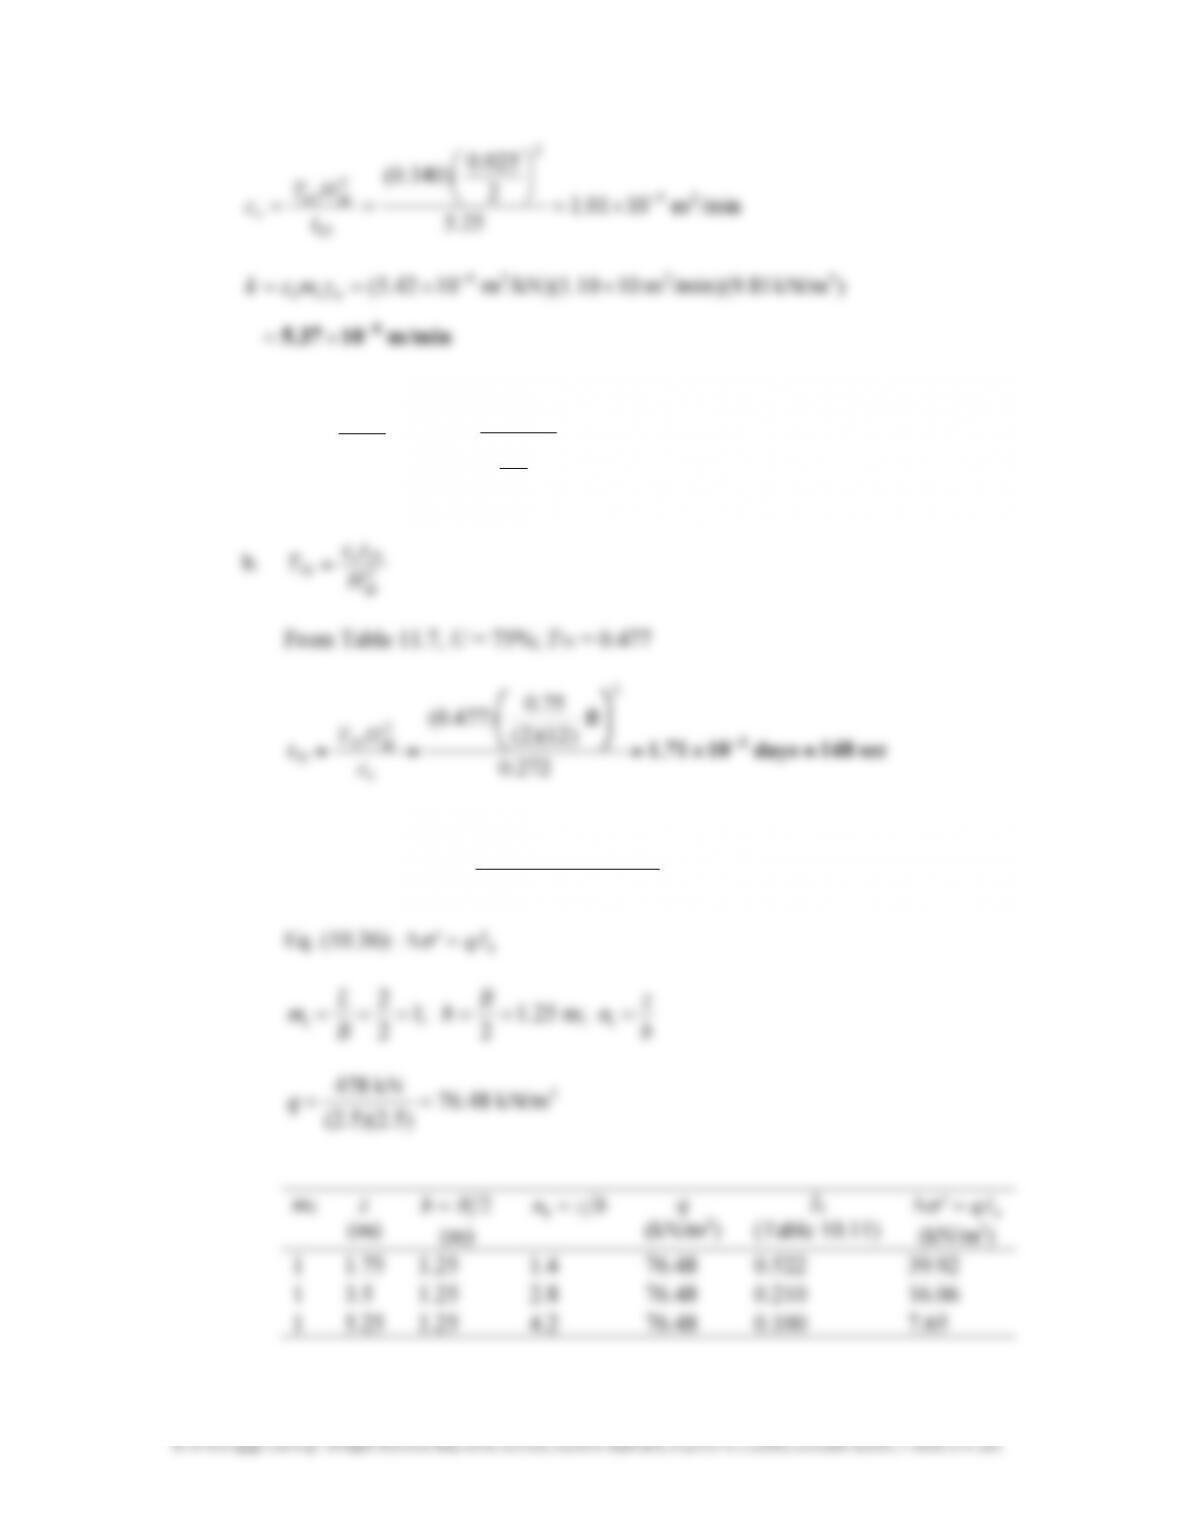
/minm 1001.1
25.5
2
025.0
)340.0(
25
2
65
2
dr65 −
×=
== t
HT
c
v
m/min
10
5.37
8−
−
×
=
××== )kN/m 81.9)(/minm 1010.1)(/kNm 1042.5(
3224
wvv
γmck
11.20 a.
2
dr
87
87
H
tc
T
v
=
==
=
; 2
2
21
)300(
742.0
=
==
=
v
c
; c
v
= 0.272 ft
2
/day
11.21 a. Eq. (11.75):
6
4
av
bmt
σ
σ
σ
σ
′
∆
+
′
∆
+
′
∆
=
′
∆
108
© 2018 Cengage Learning®. All Rights Reserved. May not be scanned, copied or duplicated, or posted to a publicly accessible website, in whole or in part.
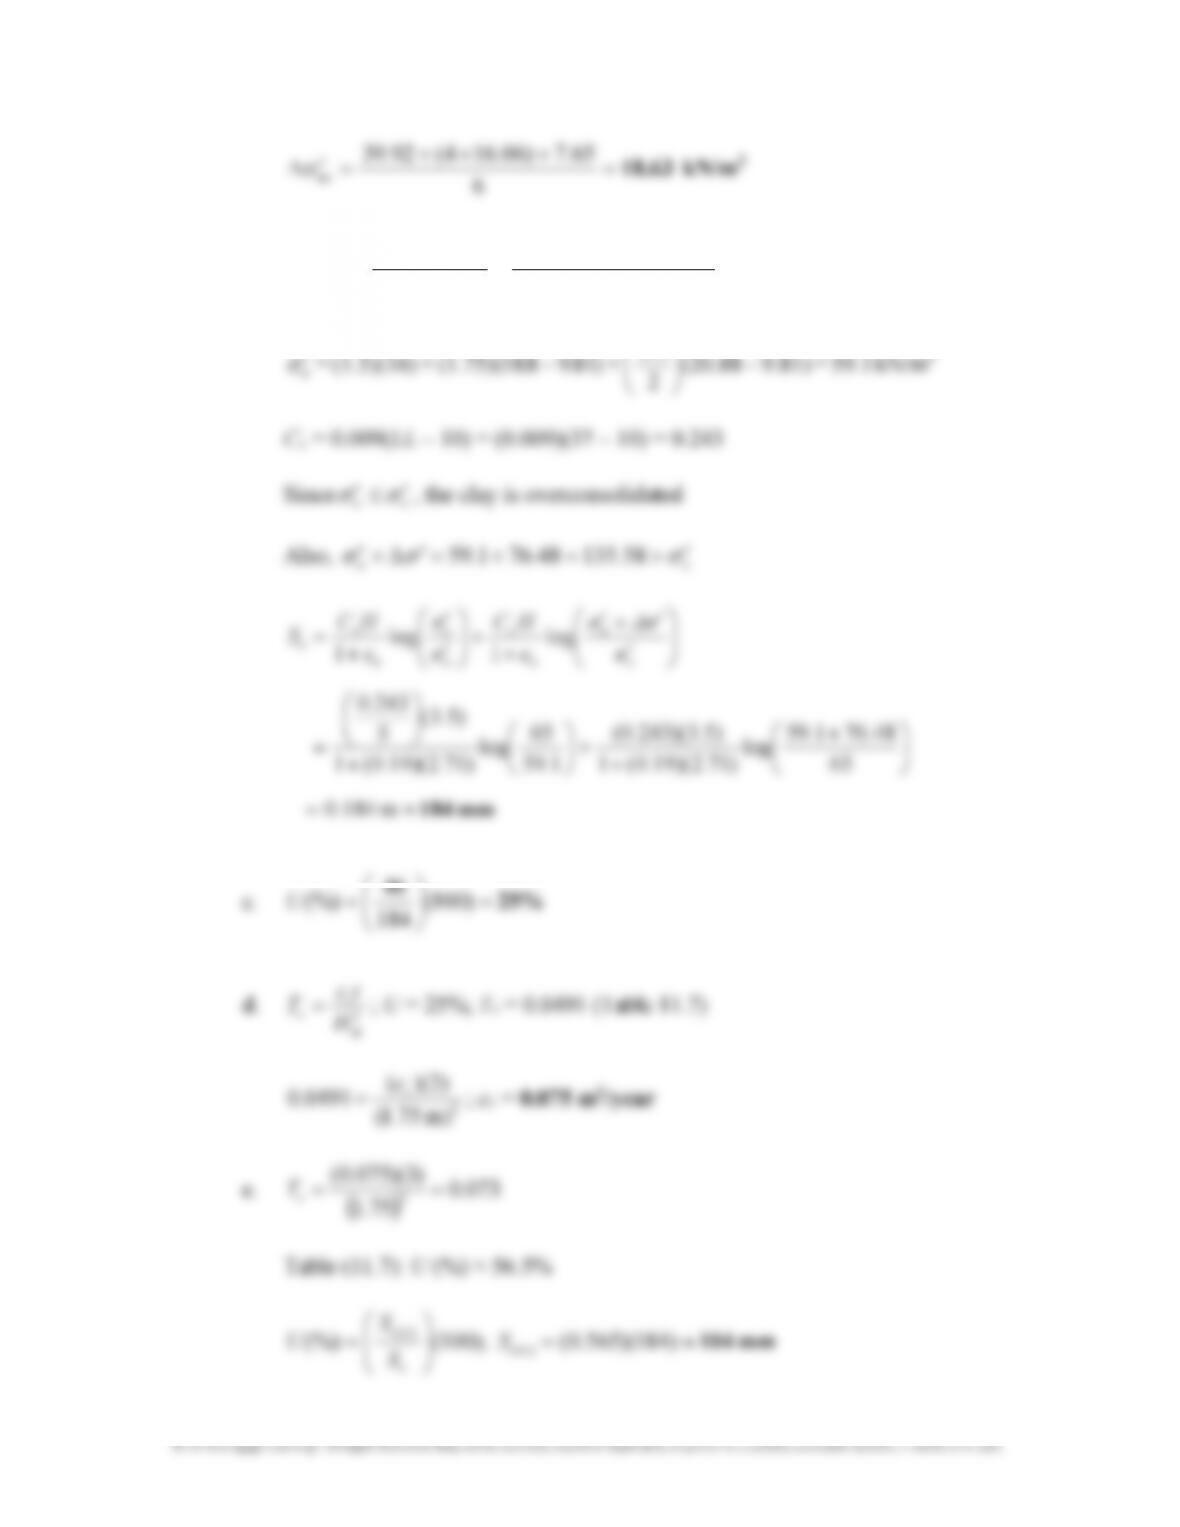
2
kN/m 18.63=
+
×
+
=
′
∆
6
65.7)06.164(92.39
av
σ
b. 3
claysat
kN/m 88.20
)71.2)(19.0(1
)71.2)(81.9)(19.01(
1
)w1( =
==
=
+
++
+
+
++
+
=
==
=
+
++
+
+
++
+
=
==
=
−
−−
−
s
sw
wG
Gγ
γ
3.5
2
)(
tc
c
S
109
CRITICAL THINKING PROBLEM
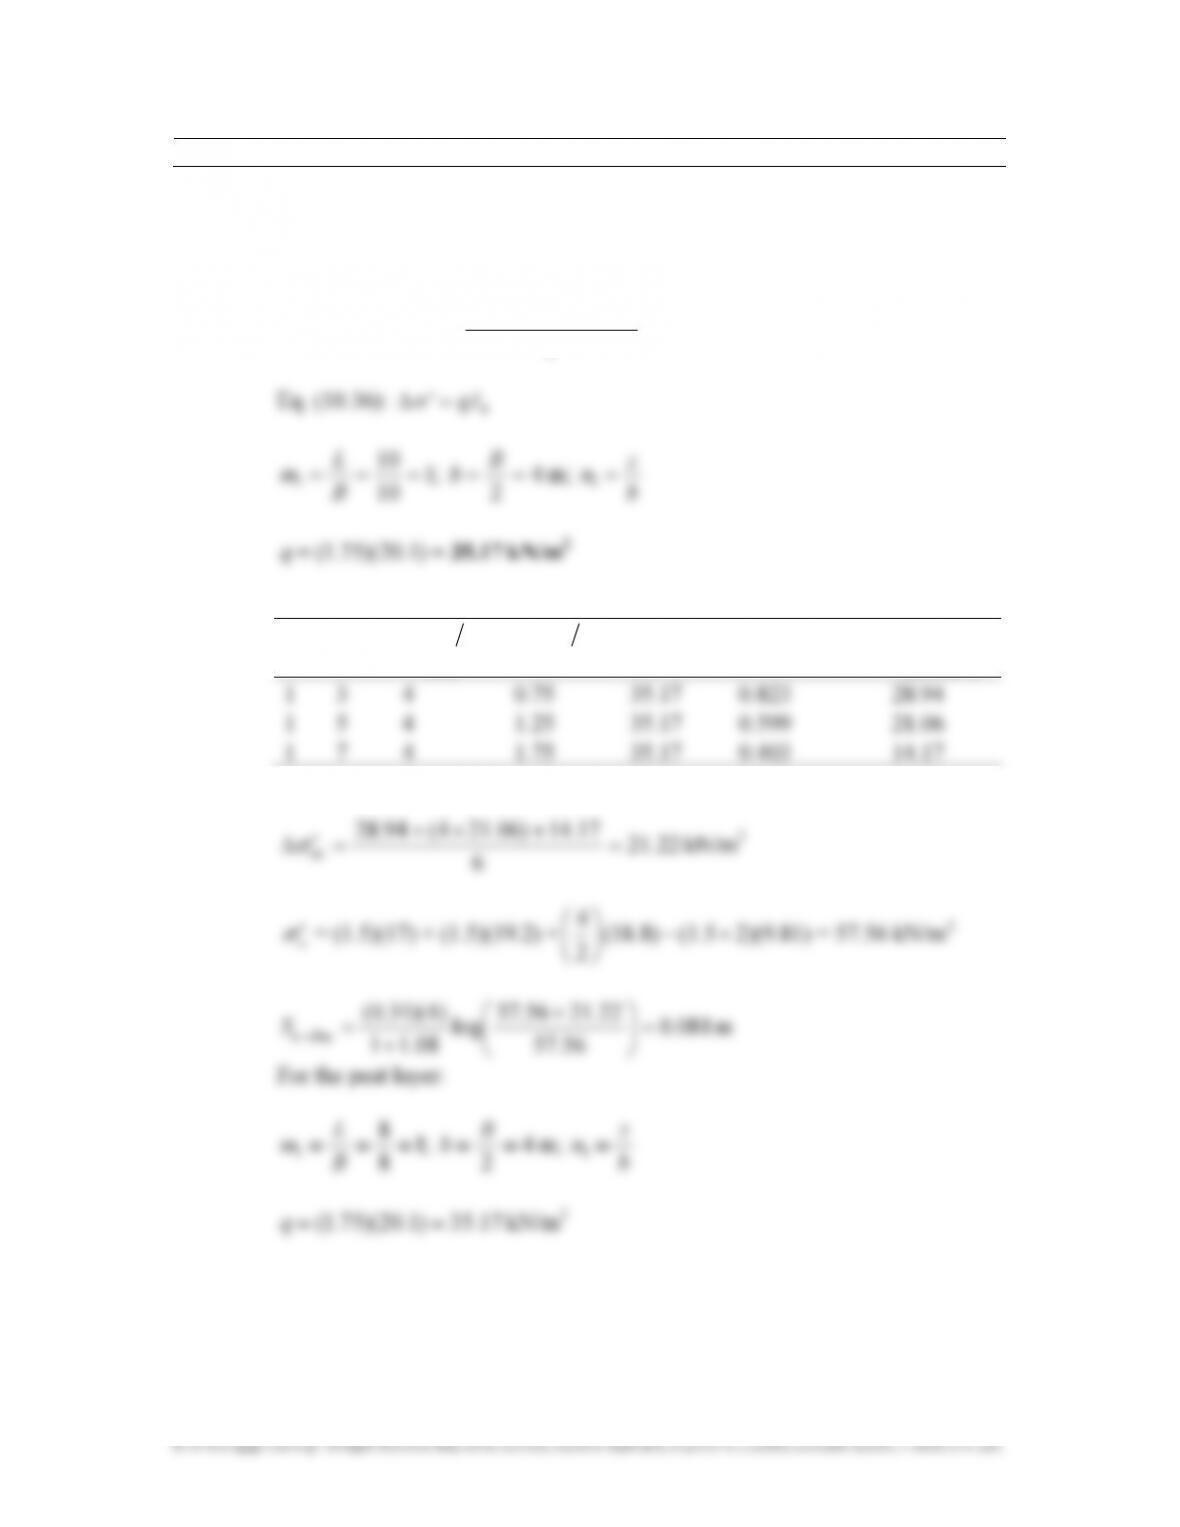
11.C.1 a. For the clay layer:
Eq. (11.75):
6
4
av
bmt
σσσ
σ
′
∆
+
′
∆
+
′
∆
=
′
∆
m
1
z
(m)
2Bb =
(m)
bzn =
1
q
(kN/m
2
)
I
4
(Table 10.11)
4
Iq=
′
∆
σ
(kN/m
2
)
17.14)06.214(94.28 =
+
×
+
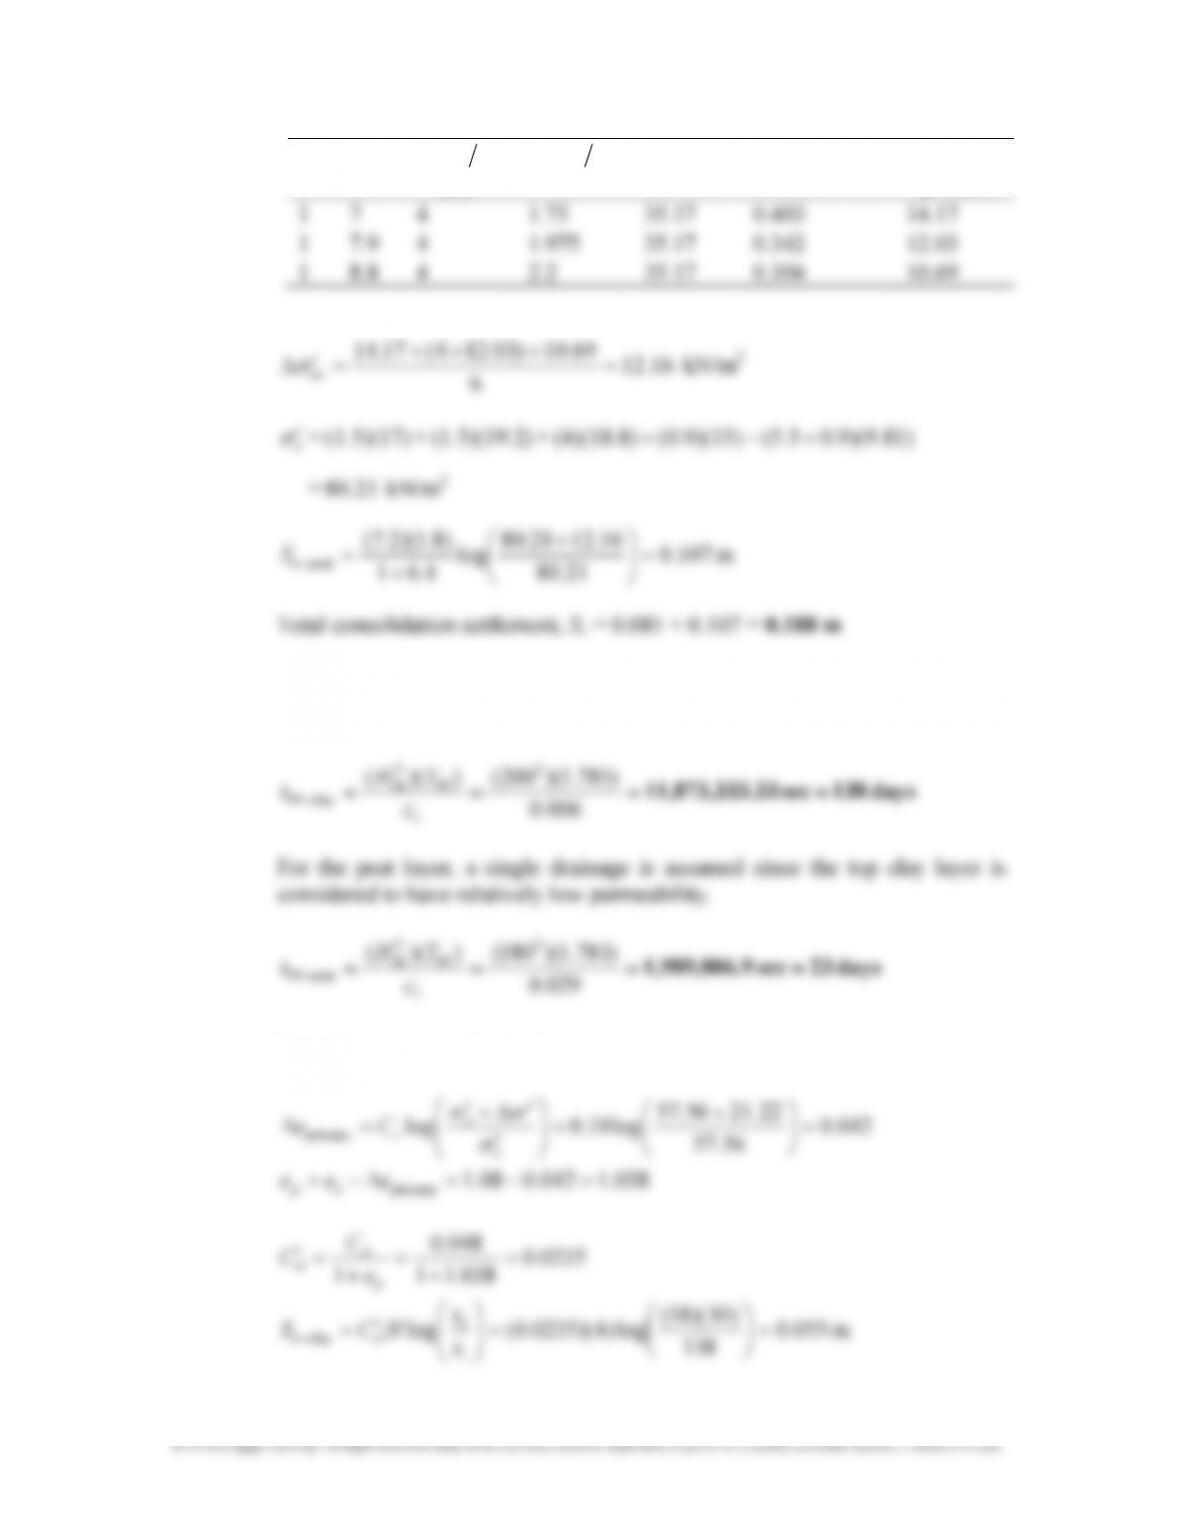
110
m
1
z
(m)
2Bb =
(m)
bzn =
1
q
(kN/m
2
)
I
4
(Table 10.11)
4
Iq=
′
∆
σ
(kN/m
2
)
69.10)03.124(17.14 =
+
×
+
b. For the clay layer, a double drainage condition is assumed since the bottom
peat layer has high void ratio and is considered permeable.
c. Secondary compression in clay:
22.2156.57
+
′
∆+
′
o
σσ
138
1
clays
−
t
α
111
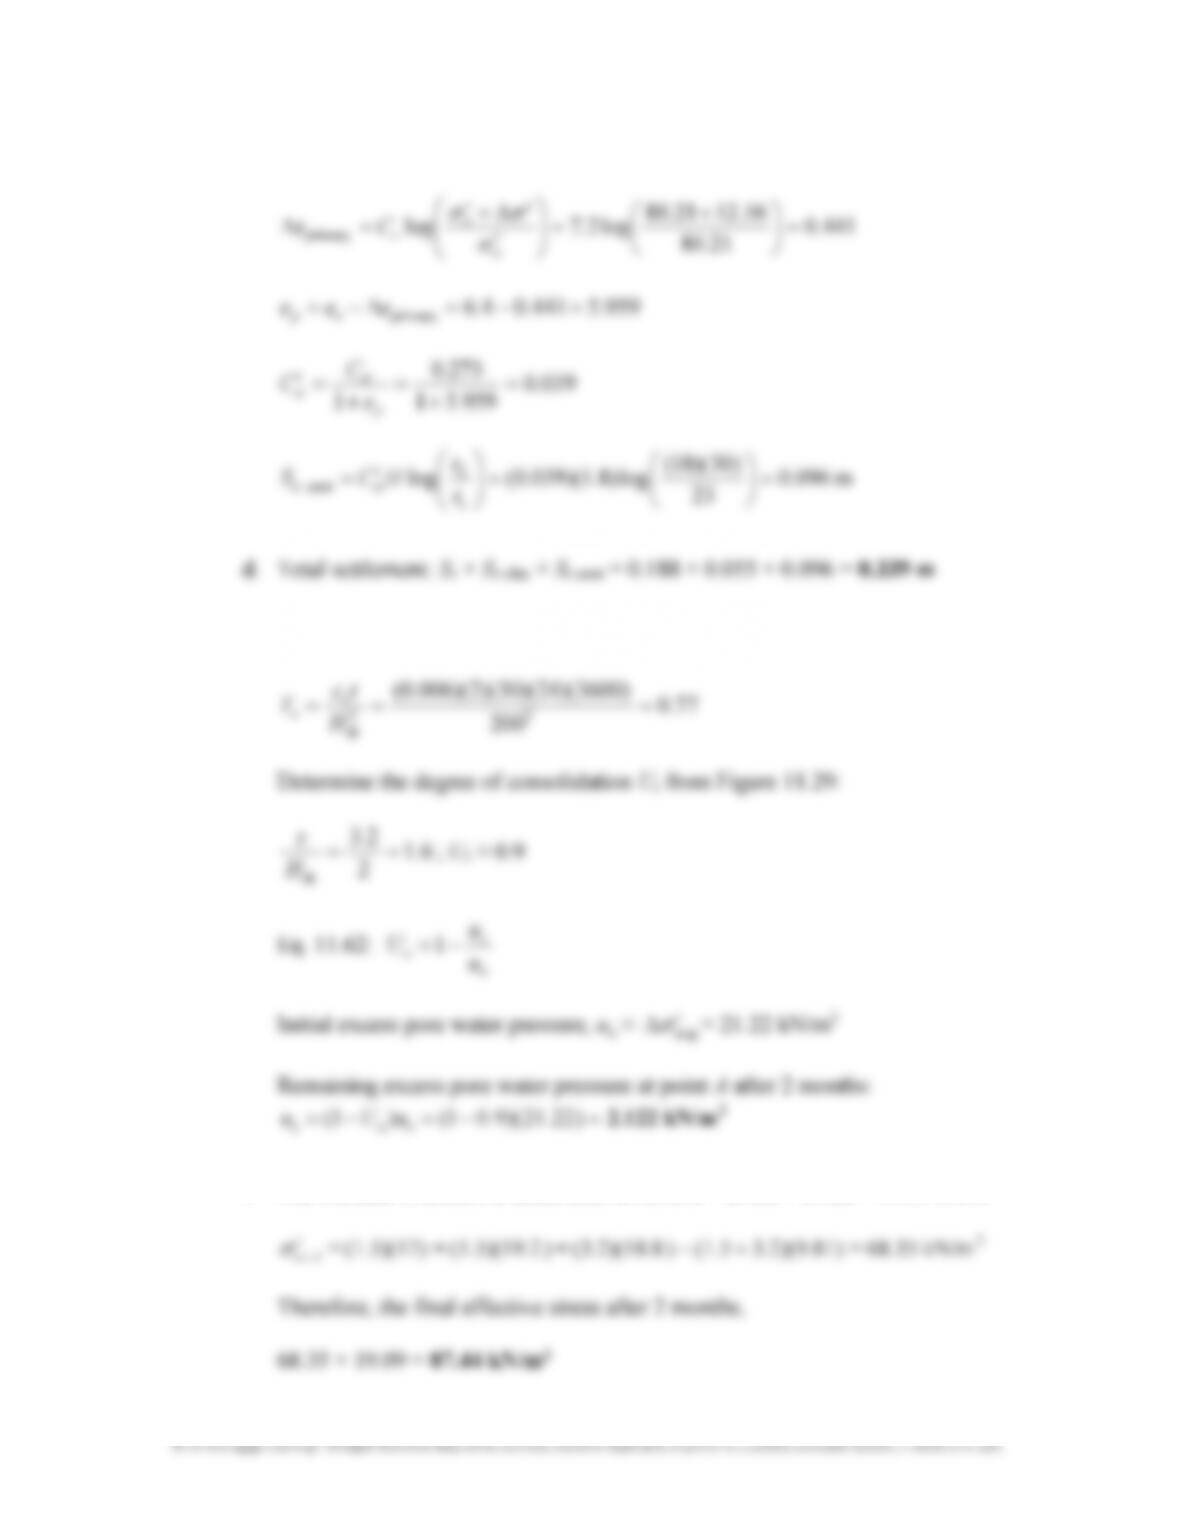
Secondary compression in peat:
23
1
peats
−
t
α
e. Time factor in 2 months:
ozz
f. The increase in effective stress after 2 months = 21.22 – 2.122 = 19.09 kN/m
2

112
© 2018 Cengage Learning®. All Rights Reserved. May not be scanned, copied or duplicated, or posted to a publicly accessible website, in whole or in part.
g. The piezometer reading will be the total pore water pressure at any given time.
Therefore, after 2 months, the piezometer reading should be:
2
kN/m 48.23=++= 122.2)81.9)(2.35.1(
piezometer
u