272
CAPSTONE CASE 2: SPATIAL TECHNOLOGY, INC.
End-of-Case Assignments: Suggested Discussions and Analyses
A. Describe Spatial Technology’s “business model” in terms of revenues, profits,
and cash flows.
Spatial is the originator of a 3D modeling file format (SAT) and object
B. What intellectual property, if any, does Spatial Technology possess?
Spatial’s file format (SAT) and modeling approach are its primary intellectual
C. Describe the experience and expertise characteristics of the management team.
The management team has a founder that is well known in the field with previous
Spatial has adopted a strategy of forward-funding itself by taking large amounts
E. Discuss the competition faced by Spatial Technology in conjunction with 3D
modeling technology in general and specifically with it ACIS product.
Spatial competes with others firms trying to win the adoption race for formats and
Capstone Case 2: Spatial Technology, Inc.
273
F. Describe the four successful rounds of venture financing (A through D) achieved
by Spatial Technology in terms of sources and amounts. What additional
financing sources have been used?
Round A for $1,000,000 was raised from Nazem & Co. shortly after organization.
G. Conduct a ratio analysis of Spatial Technology’s past income statements and
balance sheets. Note any performance strengths and weaknesses and discuss any
ratio trends.
Income Statement 1993 1994 1995 1996 1996 1996
(half year) (Projected) Ratios
Revenue
License fees 3687 50.0% 3087 47.1% 4850 56.2% 2348 4773 51.04%
Royalties 562 7.6% 876 13.4% 1207 14.0% 1228 1831.5 19.59%
Prepaid royalties 1475 20.0% 448 6.8% 0 0.0% 0 0 0.00%
Maintenance and training 1657 22.4% 2137 32.6% 2572 29.8% 1461 2747 29.37%
Total Revenue 7381 100.0% 6548 100.0% 8629 100.0% 5037 9351.5 100.00%
Cost of Sales -1150 -15.6% -705 -10.8% -677 -7.8% -403 -741.5 -7.93%
Gross Profit 6231 84.4% 5843 89.2% 7952 92.2% 4634 8610 92.07%
Operating Expenses
Sales and marketing -3220 -43.6% -2710 -41.4% -2942 -34.1% -1674 -3145 -33.63%
Research and development -3843 -52.1% -3166 -48.4% -3123 -36.2% -1913 -3474.5 -37.15%
General and administrative -1776 -24.1% –950 –14.5% -1210 –14.0% -767 –1372 –14.67%
Severence costs -300 -4.1% 0 0.0% 0 0.0% 0 0 0.00%
Total operating expenses -9139 -123.8% -6826 -104.2% -7275 -84.3% -4354 -7991.5 -85.46%
Earnings (loss) from operations -2908 -39.4% –983 –15.0% 677 7.8% 280 618.5 6.61%
Other expense, net -61 -0.8% -42 -0.6% -115 -1.3% -51 -108.5 -1.16%
Earnings (loss) before taxes and extraordinary item -2969 -40.2% -1025 -15.7% 562 6.5% 229 510 5.45%
Income tax expense -42 -0.6% -137 -2.1% -174 -2.0% -45 -132 -25.88%
Earnings (loss) before extraordinary item -3011 -40.8% -1162 -17.7% 388 4.5% 184 378 4.04%
Extraordinary item 0 0.0% 298 4.6% 0 0.0% 0 0 0.00%
Net earnings (loss) -3011 -40.8% –864 –13.2% 388 4.5% 184 378 4.04%
Earnings growth rate
Noninterest part of “other” -67 -0.9% 16 0.2% -53 –0.6% 1 -25.5 -0.27%
(mid-year) (Projected) Ratios
Current assets
Required Cash 288 4.4% 153 1.8% 390 390 4.2%
Excess Cash 0
Current liabilities
Notes payable 0 0.0% 500 5.8% 0 0 0.0%
Accounts payable 279 4.3% 585 6.8% 410 410 4.4%
Accrued royalties pble. 286 4.4% 455 5.3% 398 398 4.3%
Other accrueds 1130 17.3% 848 9.8% 1231 1231 13.2%
Deferred revenue 1726 26.4% 1220 14.1% 1779 1779 19.0%
Total current liabilities 3421 52.2% 3608 41.8% 3818 3818 40.8%
Noncurrent notes payable (ad hoc about 31%MVEntity) 500 7.6% 0 0.0% 0 0 0.0%
Capstone Case 2: Spatial Technology, Inc.
274
H. Use cash flow statements for Spatial Technology, Inc. to determine whether the
venture has been building or burning cash, as well as possible trends in building
or burning cash.
It is pretty clear that the venture has been burning large amounts of cash in the
I. Discuss possible reasons why the plan by Spatial Technology for an initial public
offering (IPO) of common stock at the end of 1992 was withdrawn.
The primary issues resulting in pulling the 1992 IPO were an insufficiently broad
frustration and complaints.
J. Describe the IPO market conditions in 1996 and discuss possible reasons why the
proposed IPO at a price of about $10 per share planned for October 1996 and
involving Dain Bosworth as lead underwriter failed.
The official reason for the failure was insignificant demand for the shares.
K. Evaluate the compound return on investments made at startup, Round A, Round
B, Round C, and Round D if the acquired shares eventually sell at $10 and $5.
Evaluate the compound return on all investments of each existing investor.
Analyze the incentives of each investor and founder for taking the Cruttenden
Roth offer to execute a $5 IPO.
This exercise can be done in a number of ways depending on how in depth the
instructor wants the students to go. We typically explain the use of the “XIRR”
Capstone Case 2: Spatial Technology, Inc.
275
7/15/86 9/15/86 6/15/89 4/15/91 2/15/93 10/10/96 XIRR
Sowar (2,000.00)$ 1,069,996.50$ (at $5) 84.62%
(2,000.00)$ 2,819,991.50$ (at $10) 102.93%
This analysis treats Sowar’s warrants as part of his return on investment (rather than as compensation) and
treats all options as exercised. As 19,999 of the options have exercise price of $5, the answer will be the
same if one assumes that these are not exercised in the $5 scenario.
L. Using the provided financial statements as a starting point:
1. Prepare and present a DCF valuation and pro forma financials with five
years of explicit forecasts using license fees and royalties growth rates
consistent with recent history (e.g., two to three years) at Spatial.
2. Modify your analysis to consider a more successful scenario where
Spatial’s main revenue sources (combined) grow at 50 percent for five
years and then flatten to a more sustainable growth rate.
3. Prepare and present DCF valuations and pro forma financial statements
(five-year explicit period) that justify a $10 and a $5 share price at the
IPO. Make sure the ratios embedded in your projections conform to
reasonable operating ratio assumptions.
4. In all cases be sure to explain your modeling assumptions on revenue and
costs and provide a summary comparison of the four scenarios.
Income Statement 1996 1996 1996 1997 1998 1999 2000 2001 SS SS+1 Growth
(half year) (Projected) Ratios
Revenue
License fees 2348 4773 51.04%
Royalties 1228 1831.5 19.59%
Prepaid royalties 0 0 0.00%
Maintenance and training 1461 2747 29.37%
Total Revenue 5037 9351.5 100.00% 10,249 11,233 12,312 13,493 14,789 15,676 16,617 6.00%
Cost of Sales -403 -741.5 -7.93% -820 –899 -985 -1,079 -1,183 -1,254 –1,329 6.00%
Gross Profit 4634 8610 92.07% 9,429 10,335 11,327 12,414 13,606 14,422 15,287 6.00%
Operating Expenses
Sales and marketing -1674 -3145 -33.63% -3,382 -3,707 -4,063 -4,453 -4,880 -5,173 -5,484 6.00%
Research and development -1913 –3474.5 -37.15% -3,792 -4,156 -4,555 -4,993 -5,472 -5,800 –6,148 6.00%
General and administrative -767 -1372 -14.67% -1,537 -1,685 -1,847 -2,024 –2,218 -2,351 –2,493 6.00%
Severence costs 0 0 0.00% 0 0 0 0 0 0 0
Total operating expenses -4354 –7991.5 -85.46% -8,712 -9,548 -10,465 -11,469 -12,571 -13,325 -14,124 6.00%
Earnings (loss) from operations 280 618.5 6.61% 717 786 862 945 1,035 1,097 1,163 6.00%
Other expense, net -51 -108.5 -1.16% -28 -24 -22 -21 -23 -255 -270 6.00%
Earnings (loss) before taxes and extraordinary item 229 510 5.45% 690 763 840 923 1,012 842 893 6.00%
Income tax expense -45 -132 -25.88% -172 -191 -210 -231 -253 -211 -223 6.00%
Earnings (loss) before extraordinary item 184 378 4.04% 517 572 630 693 759 632 670 6.00%
Extraordinary item 0 0 0.00% 0 0 0 0 0 0 0
Net earnings (loss) 184 378 4.04% 517 572 630 693 759 632 670 6.00%
Earnings growth rate 10.55% 10.19% 9.90% 9.63% -16.80% 6.00%
Noninterest part of “other” 1 -25.5 -0.27% -28 –30 -33 -36 -40 -42 –45 6.00%
Interest Income 12 22.5 0.24% 0 7 12 15 17 0 0
Interest Expense -64 -105.5 -1.13% 0 0 0 0 0 –213 –225 6.00%
ProForma rate on interest inc.
ProForma rate on interest exp.
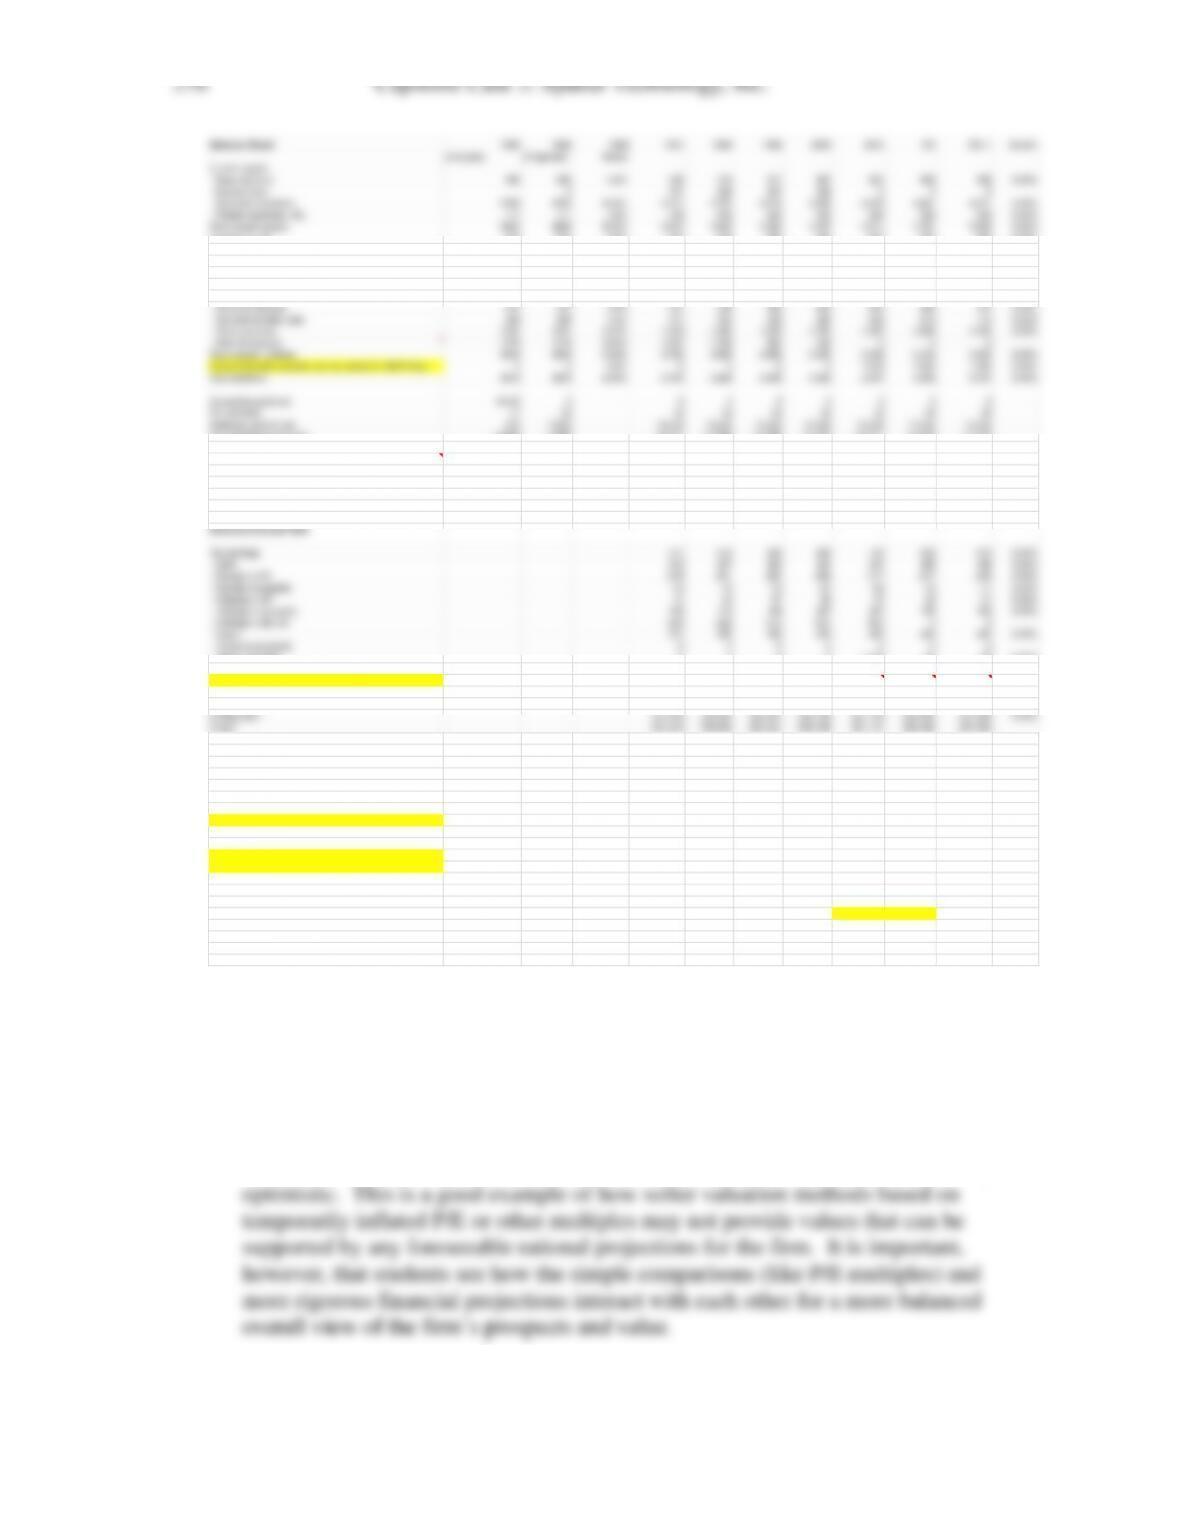
+D&A 243 267 293 321 351 385 408
-Capex -321 -350 -383 -420 -460 –460 -487
-Change in NWC (incl. all cash) -439 -489 -540 -593 -174 -76 -81
-Currency translation losses 0 0 0 0 0 0 0
+Debt Proceeds 0 0 0 0 1,418 85 90
Equity VCF from operations 0 0 0 0 1,894 566 600 6.00%
firms and their multiples. (There are some glimpses of multiples in the case
materials, but you may wish to use some outside reference materials. Please state
Capstone Case 2: Spatial Technology, Inc.
277
N. Prepare an executive summary discussing the events and decisions (technological
and financial) leading to its current situation, the options it currently has, and
your recommendations for Spatial’s near future. Would (could) you have done
anything differently?
Typically, the students’ executive summaries discuss the implausibility of the $10
O. Take a position on whether you would recommend the $5 IPO. Take a position on
whether, as an investor, you would have purchased shares in the $5 IPO.
Answers will vary, but some students will recommend investing at the $5 price.
P. Discuss what you believe will be the strategic (product lines, licensing,
competitors, etc.) outlook for Spatial and what you believe will be the financial
market’s view of a publicly traded Spatial Technology.
In many cases, students will research the post-IPO Spatial, which was publicly
traded for several years before being acquired. The market that Spatial tried to