Capstone Case 1: Eco-Products, Inc.
2008 forecast of $45 million was associated with a decline in economic activity
J. Explain Eco-Products’ supply chain model that existed in early 2008. Describe the
strengths and weaknesses of such a model from an operations viewpoint. What are the
implications of this supply chain model on Eco-Products working capital financing needs
and its cash conversion cycle?
The supply chain model used by Eco-Products resulted in a long inventory cycle (for a
relatively simple production process). Raw materials were often purchased in the U.S. or
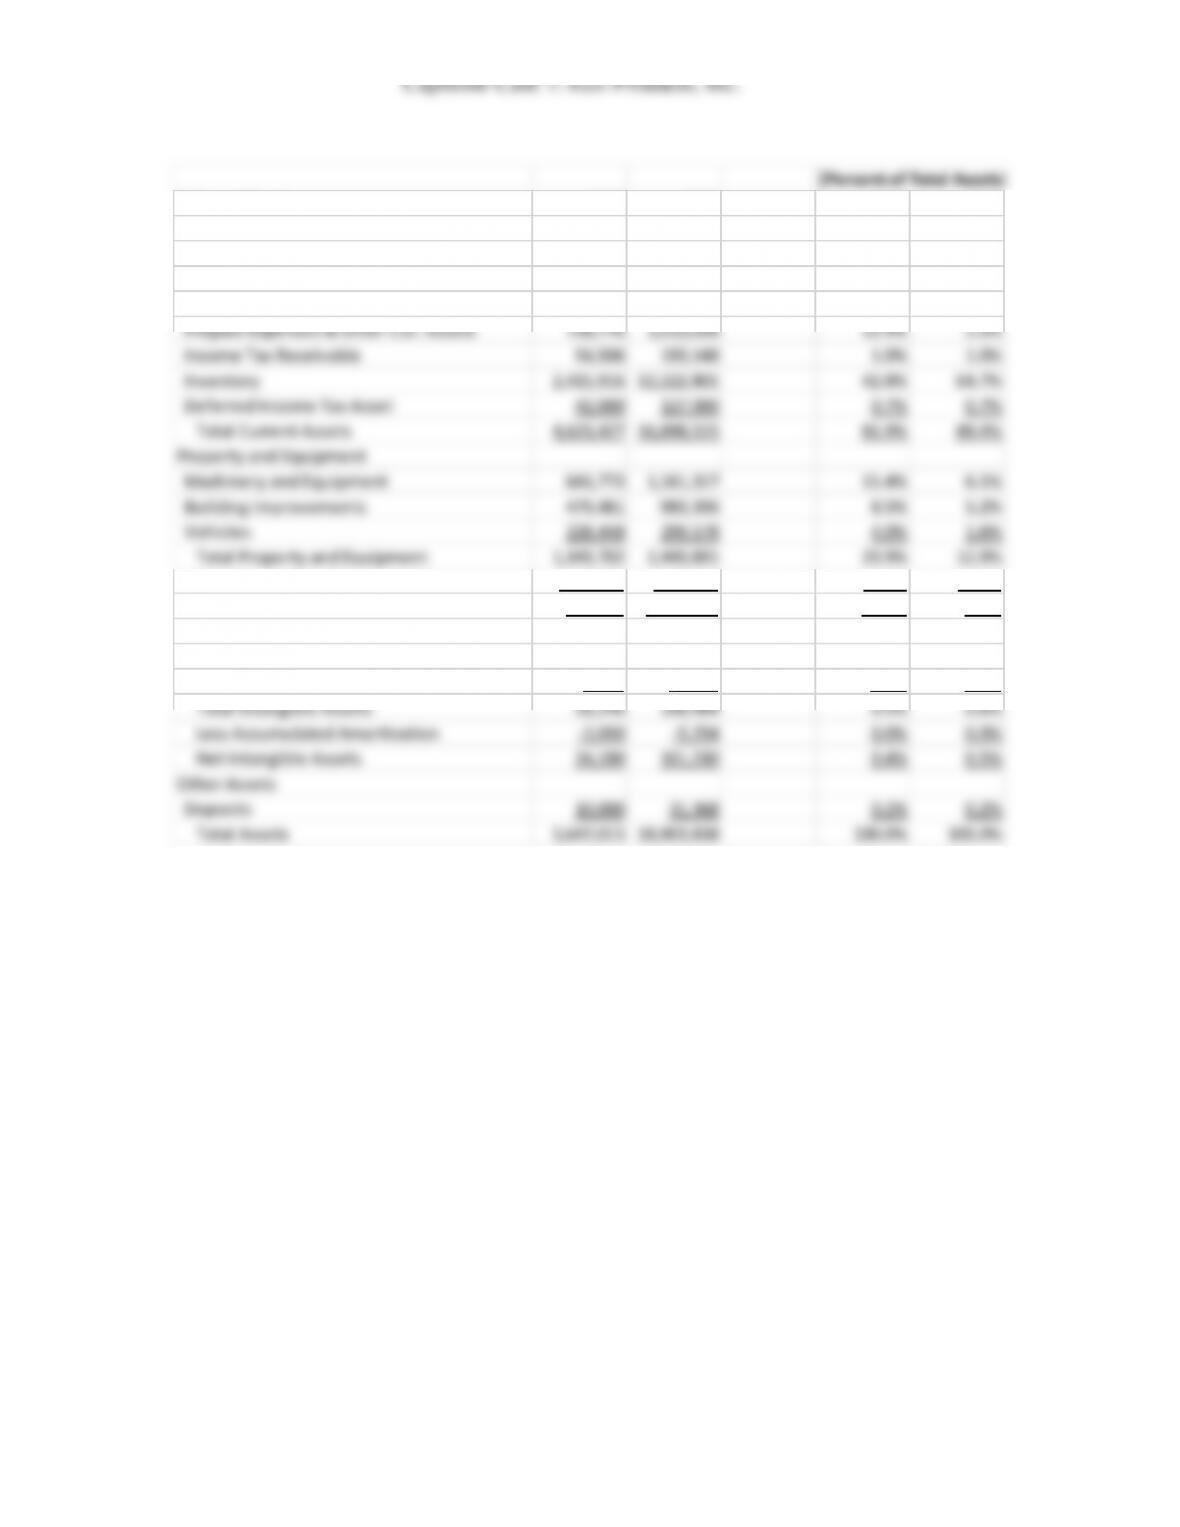
As shown below, both assets to sales and inventory to sales increased dramatically as the
firm changed from a seller of products manufactured by other firms to a business model
whereby Eco-Products became a manufacturer and wholesaler of eco-friendly products.
Actual 2008 Results:
Total assets to sales increased from 52.0% for 2007 to 55.0% in 2008. Of course, the
CCC Calculations:
Capstone Case 1: Eco-Products, Inc.
Inventory-to-Sale Conversion Period (Inv. CP):
Sale-to-Cash Conversion Period (Rec. CP):
Purchase-to-Payment Conversion Period (Pmt. CP):
Cash Conversion Cycle (CCC):
2007 CCC = 114.1 days + 44.7 days – 26.8 days = 132.0 days
The dramatic increase in the cash conversion cycle from 43.9 days in 2005 to 132.0 days
in 2007 reflects the change in the firm’ business model from a seller of products
For reference, the actual CCC calculations for 2008 were as follows:
This further increase in the CCC meant that even more financing was required to support
the actual 2008 sales.
An accompanying Excel spreadsheet provides the following ratio calculations for
2007 and 2008 (data not available until 2009).
Cash Conversion Cycle (in Days): 2007 2008
Inventory-to-Sale Conversion Period 114.1 171.3
Sale–to-Cash Conversion Period 44.7 33.0
Purchase–to-Payment Conversion Period 26.8 53.3
Cash Conversion Cycle 132.0 151.0
Capstone Case 1: Eco-Products, Inc.
K. In mid-2008, Eco-Products management sought to quickly (hopefully) raise an additional
$2 million in external financing through a single private equity investment. The term
sheet prepared by Greenmont Capital is presented in Appendix B.
1. After considering a number of possible private equity investors, Greenmont Capital
was selected by Eco-Products’ management. Discuss the pros and cons of selecting a
small locally-based private equity firm relative to a larger private equity investor?
Large private equity firms have large amounts of funds to invest and will have a
portfolio of several projects being simultaneously financed. Large private equity firms
also usually can move quickly in providing funds to specific ventures and are likely to
2. Review the investment terms presented in Appendix B and comment on any factors in
the term sheet that might be “deal breakers.” If you were representing Eco-Products
top management, which terms might you want deleted or modified from the term
sheet? Now, if you were representing Greenmont Capital, which terms would be
important in protecting its investment capital?
It might be helpful to first review Chapter 11, Figure 11.6 which provides a list of
“Typical Issues Addressed in a Term Sheet.’
A term sheet should summarize the proposed principal terms with respect to a specific
Capstone Case 1: Eco-Products, Inc.
The term sheet also addresses “other matters” that include: confidentiality,
indemnification, legal fees and expenses, and conditions precedent to financing.
A possible “deal breaker” would be the number of warrants being offered to
Greenmont Partners in the term sheet proposal. The July 18, 2008 term sheet
proposal provides for Greenmont to receive 1.5 million shares of Series A
Convertible Preferred Stock initially convertible on a 1:1 basis into shares of Eco–
capital is likely to come from other private equity investors.
3. Some analysts employ a relative value method that uses multiples from comparable
firms to estimate the value of a target venture. Exhibit 9 contains enterprise value-to–
sales information for a number of possible comparable firms for the purpose of
valuing Eco-Products. Estimate the enterprise value of Eco-Products. What portion
of equity ownership should Eco- Products be willing to give up for the $2 million
Greenmont Capital investment?
Although Eco-Products had been in business since 1990, its business model changed
between 2005 and 2007. Eco-Products became a manufacturer and wholesaler of
eco-friendly products at a time when oil prices were at record highs and concern
Capstone Case 1: Eco-Products, Inc.
EBITDA), and/or its bottom line (net income).
Here we concentrate on examining the relative valuation data provided by Greenmont
Capital Partners in Exhibit 9 which included financial information on 7 “possible”
transactions. Five of the transactions occurred While some analysts might argue for
Unfortunately, no information was available for EBITDA (except for the dated
Newspring transaction) or net income multiples.
As noted in the case, sales estimates changed rapidly in the case. Eco-Products
management in mid-2007 had forecasted 2008 sales to be $22 million. By early 2008,
the 2008 sales estimates were revised upwards to $45 million. Trailing twelve
months revenues for the twelve months ended in June, 2008 were $19.7 million.
A range of possible values for Eco-Products using an enterprise value to sales
multiple of 1.55 might be:
Capstone Case 1: Eco-Products, Inc.
total of $3,223,183 or approximately $3.2 million rounded. Thus, the enterprise values
Note: As can be seen from the actual 2008 results, the lines of credit at the end of
2008 amounted to slightly more than $8 million, long-term debt (including the
current portion) was nearly $.5 million, and long-term capital leases (including the
current portion) was nearly $.3 million. Thus, the total interest-bearing debt plus
long-term capital leases amounted to approximately $8.8 million.
Or, using pre-money and post-money shares the calculations would be:
Pre-money shares (fully diluted to account for the employee option pool) =
$29,587,500/$1.50 = 19,725,000 shares
As noted in the following epilogue, Greenmont Partners negotiated a larger
percentage ownership as Eco-Products struggled to meet its revenue targets due to
inventory-related problems and the rapidly slowing economy during the last-half of
2008. According to the 2008 balance sheet, 1,366,666 shares of preferred stock were
actually issued to Greenmont, instead of the previously negotiated 1,333,333 shares
Capstone Case 1: Eco-Products, Inc.
(an increase of 33,333 shares). Adding the 333,333 warrants resulted in Greenmont
Partners having potential 1,699,999 fully-diluted shares.
EPILOGUE: What Happened
Recession. Following the investment, Eco-Products struggled to meet revenue targets.
Prior to the Greenmont deal, Eco-Products had never been accountable to outside
investors for its performance and, at that time, introducing new products impeded
launched a retail product line. In June of 2009, Savage resigned as CEO. The company
replaced its CEO-Founder with an executive accomplished in growing established
companies, the former CEO of Corporate Express who took that company from $50
million to $5 billion in revenue. Savage became Executive Chairman and looked to
planned to conduct another round of private equity financing, this time for $5 million to
three years and more than 54 new jobs had been created since 2006. As for its founder
and former president, Steve Savage remained interested in leading early stage ventures.
He became the majority owner of Ellie’s Eco Home Store, the former building division of
Eco-Products, with plans to open at least one more location and double revenue within
one year. In early 2010, he was also in the early stages of launching a new business to
Bad Debt 141 44,735 0.0% 0.1%
Depreciation and Amortization 87,563 214,066 0.8% 0.6%
Employee Benefits 114,011 106,401 1.0% 0.3%
General and Administrative 494,061 1,957,315 4.5% 5.7%
Payroll Taxes 117,557 269,032 1.1% 0.8%
Net Other Income & (Expenses) –187,918 –242,303 –1.7% –0.7%
Net Income (Loss) Before Taxes –59,475 842,344 –0.5% 2.5%
Provision for Income Taxes
Current Tax Benefit 52,276 0 0.5% 0.0%
Deferred Tax Expense –29,000 –304,000 –0.3% –0.9%
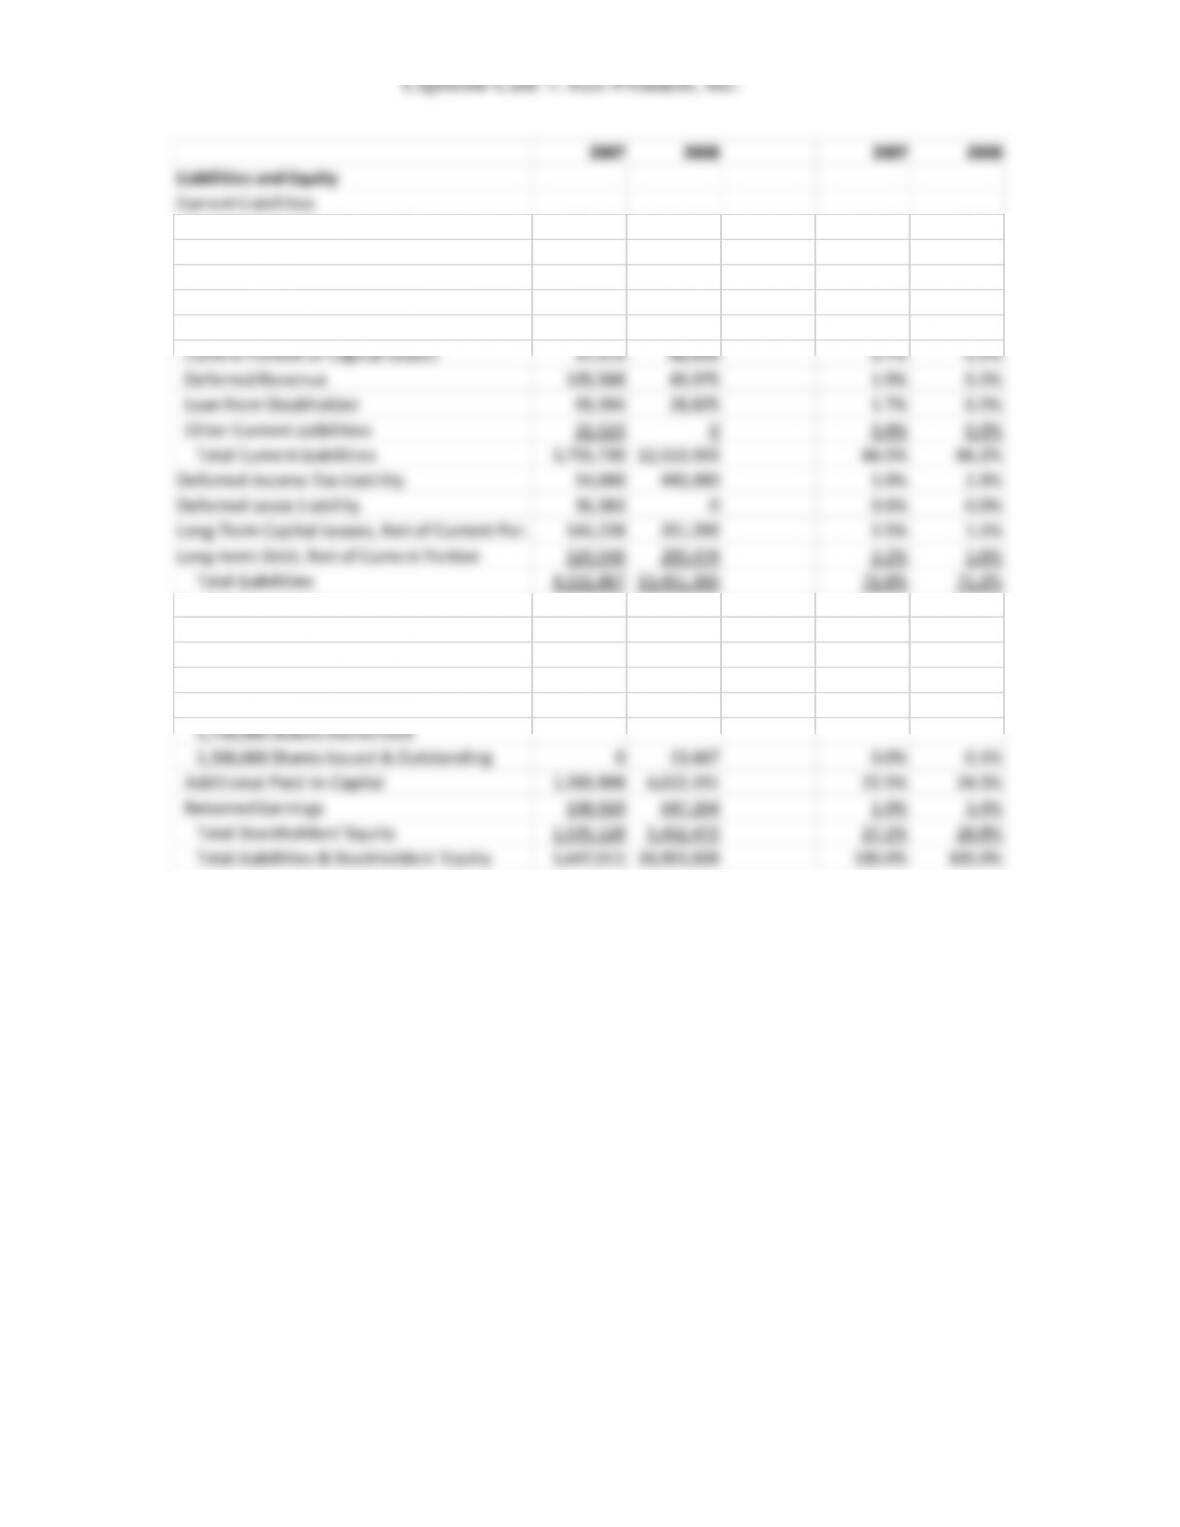
2007 2008 2007 2008
Liabilities and Equity
Current Liabilities
Accounts Payable & Accrued Expenses 568,131 3,804,210 10.1% 20.1%
Accrued Payroll & Payroll Taxes 6,712 253,094 0.1% 1.3%
Accrued Vacation 39,356 84,755 0.7% 0.4%
Lines of Credit 2,843,242 8,043,568 50.3% 42.5%
Current Portion of Long-Term Debt 39,865 166,310 0.7% 0.9%
Current Portion of Capital Leases 37,919 88,856 0.7% 0.5%
Deferred Revenue 105,588 43,975 1.9% 0.2%
Loan from Stockholder 93,394 28,825 1.7% 0.2%
Other Current Liabilities 21,523 00.4% 0.0%
Total Current Liabilities 3,755,730 12,513,593 66.5% 66.2%
Deferred Income Tax Liability 54,000 443,000 1.0% 2.3%
Deferred Lease Liability 36,383 0 0.6% 0.0%
Long-Term Capital Leases, Net of Current Por. 141,228 201,299 2.5% 1.1%
Long-term Debt, Net of Current Portion 124,546 293,474 2.2% 1.6%
Total Liabilities 4,111,887 13,451,366 72.8% 71.2%
Stockholders’ Equity
Common Stock, $.001 Par Value
50,000,000 Shares Authorized
16,935,000 Shares Issued & Outstanding 156,300 169,350 2.8% 0.9%
Preferred Stock, $.001 Par Value
1,750,000 Shares Authorized
1,366,666 Shares Issued & Outstanding 0 13,667 0.0% 0.1%
Additional Paid-In-Capital 1,269,908 4,622,191 22.5% 24.5%