Chapter 6: Managing Cash Flow
105
2015
2016
Accounts payable
300
400
Bank loan
150
250
Accrued liabilities
100
150
Total current liabilities
550
800
Long-term debt
150
150
Common stock
850
1,100
Retained earnings
1,850
2,450
Total liabilities and equity
3,400
4,500
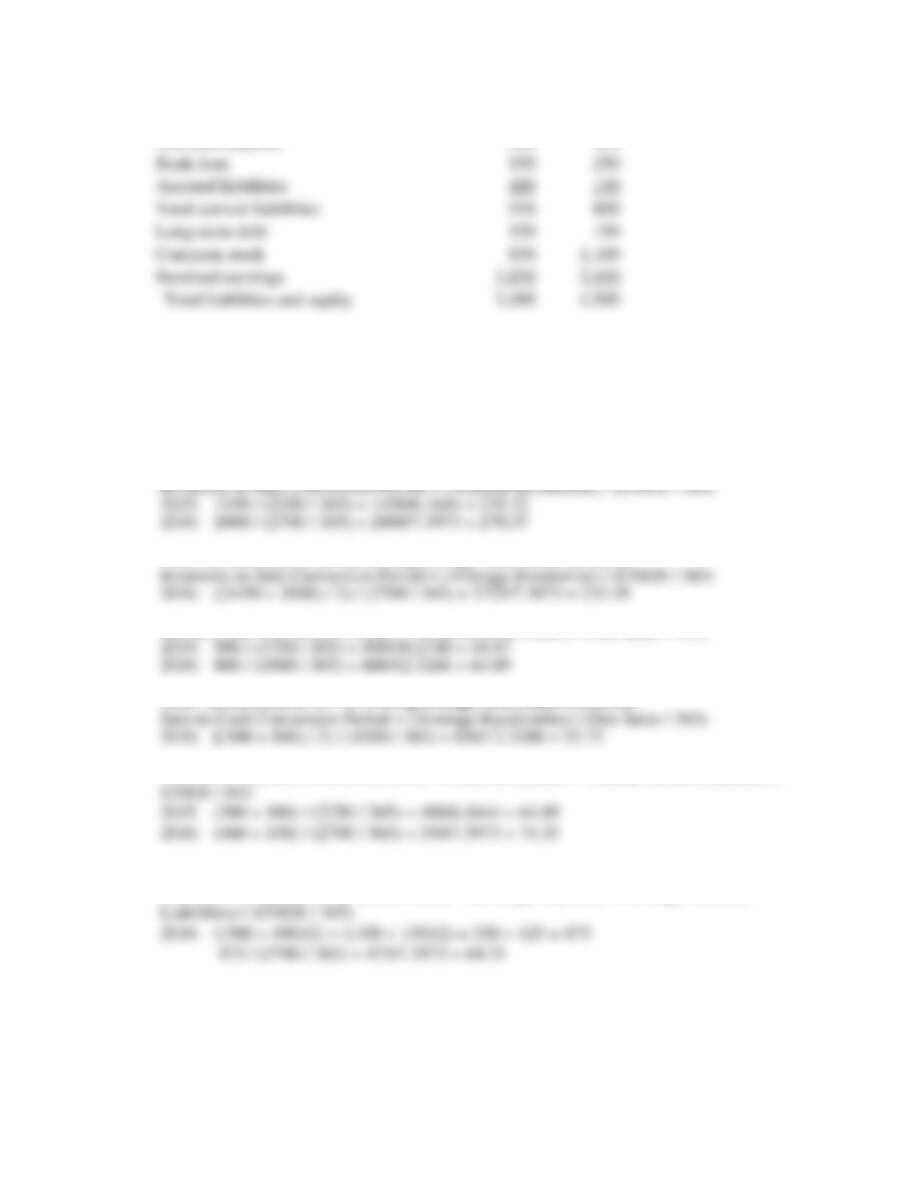
A. Using yearend data, calculate the inventory-to-sale conversion period, the sale-to-cash
conversion period, and the purchase-to-payment conversion period for 2015 and 2016.
Note: because inventories, accounts receivable, accounts payable, and accrued liabilities
are not available for 2014, averages of these accounts cannot be calculated for 2015. So
for 2015 versus 2016 comparative purposes, we use yearend data for these accounts.
Note: the calculation for 2016 using average inventories would be:
Sale-to-Cash Conversion Period = (Yearend Receivables) / (Net Sales / 365)
Note: the calculation for 2016 using average receivables would be:
Purchase-to-Payment Conversion Period = (Yearend Payables + Yearend Accrued Liabilities) /
Note: the calculation for 2016 using average payables and average accruals would be:
Purchase-to-Payment Conversion Period = (Average Payables + Average Accrued
B. Determine the cash conversion cycle for each year and discuss the changes that took
place, if any.
Chapter 6: Managing Cash Flow
106
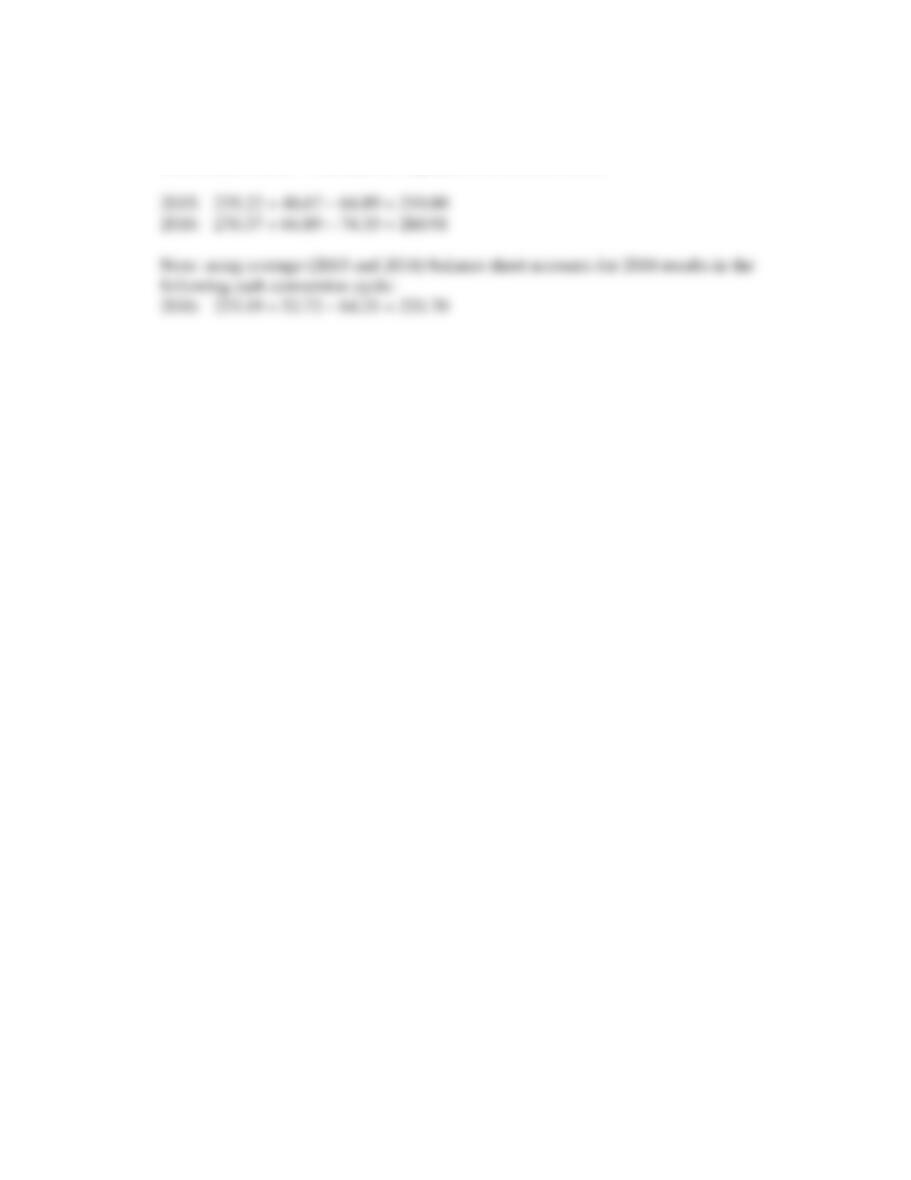
Cash Conversion Cycle = Inventory-to-Sale Conversion Period + Sale-to-Cash
Conversion Period – Purchase-to-Payment Conversion Period
SPREADSHEET EXERCISES/PROBLEMS
[Note: The following activities are for students with spreadsheet software skills.]
11. Short-term financial planning for the PDC Company was described during the early part of
this chapter. Refer to the PDC Company’s projected monthly operating schedules in Table 6.2.
PDC’s monthly sales for the remainder of 2017 are expected to be:
September $80,000
October $100,000
November $130,000
December $160,000
A. Prepare PDC’s sales schedule, purchases schedule, and the wages schedule for each of
the last four months of 2017.
See spreadsheet solution below.
B. Prepare cash budgets for each of the last four months of 2017 for the PDC Company
and describe how the forecast affects the end of month cash balances.
See spreadsheet solution below.
C. Prepare the PDC Company’s projected monthly income statements for the August
through December period.
See spreadsheet solution below.
D. Prepare the PDC Company’s projected monthly balance sheets for the August through
December period.
See spreadsheet solution below.
Chapter 6: Managing Cash Flow
107
E. Prepare the PDC Company’s projected monthly statements of cash flow for the August
through December period.
See spreadsheet solution below.
F. Compare your balance sheet at the end of December with the balance sheet in Table 6.1
in the chapter and apply the balance sheet method to determine cash flows over the
March-December period.
See spreadsheet solution below.
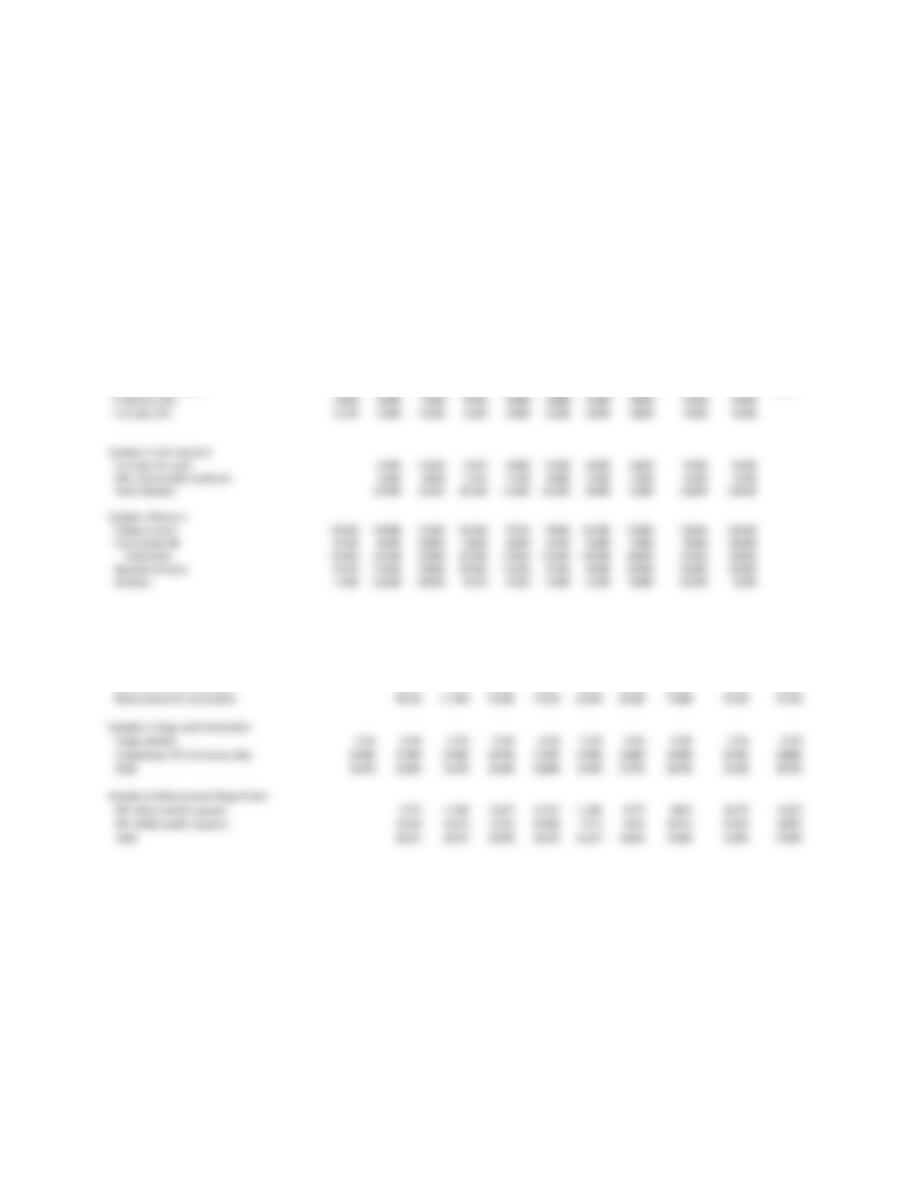
March April May June July Aug. Sept. Oct. Nov. Dec. Jan.
Schedule 1: Sales Forecast 92,000 115,000 184,000 138,000 115,000 92,000 80,000 100,000 130,000 160,000 100,000
Credit sales, 40% 36,800 46,000 73,600 55,200 46,000 36,800 32,000 40,000 52,000 64,000
Cash sales, 60% 55,200 69,000 110,400 82,800 69,000 55,200 48,000 60,000 78,000 96,000
Schedule 2: Cash Collections
Cash sales this month 69,000 110,400 82,800 69,000 55,200 48,000 60,000 78,000 96,000
100% of last month’s credit sales 36,800 46,000 73,600 55,200 46,000 36,800 32,000 40,000 52,000
Total Collections 105,800 156,400 156,400 124,200 101,200 84,800 92,000 118,000 148,000
Schedule 3: Purchases
Ending inventory 110,400 149,040 123,280 110,400 97,520 90,800 102,000 118,800 135,600 102,000
Cost of goods sold 64,400 80,500 128,800 96,600 80,500 64,400 56,000 70,000 91,000 112,000
Total needed 174,800 229,540 252,080 207,000 178,020 155,200 158,000 188,800 226,600 214,000
Beginning Inventory 97,520 110,400 149,040 123,280 110,400 97,520 90,800 102,000 118,800 135,600
Purchases 77,280 119,140 103,040 83,720 67,620 57,680 67,200 86,800 107,800 78,400
Schedule 4: Disbursements for Purchases
50% of last month’s purchases 38,640 59,570 51,520 41,860 33,810 28,840 33,600 43,400 53,900
50% of this month’s purchases 59,570 51,520 41,860 33,810 28,840 33,600 43,400 53,900 39,200
Disbursements for merchandise 98,210 111,090 93,380 75,670 62,650 62,440 77,000 97,300 93,100
Schedule 5: Wages and Commissions
Wages, all fixed 5,750 5,750 5,750 5,750 5,750 5,750 5,750 5,750 5,750 5,750
Commissions (15% of current sales) 13,800 17,250 27,600 20,700 17,250 13,800 12,000 15,000 19,500 24,000
Total 19,550 23,000 33,350 26,450 23,000 19,550 17,750 20,750 25,250 29,750
Schedule 6: Disbursements-Wages/Comm
50% of last month’s expenses 9,775 11,500 16,675 13,225 11,500 9,775 8,875 10,375 12,625
50% of this month’s expenses 11,500 16,675 13,225 11,500 9,775 8,875 10,375 12,625 14,875
Total 21,275 28,175 29,900 24,725 21,275 18,650 19,250 23,000 27,500
Chapter 6: Managing Cash Flow
108
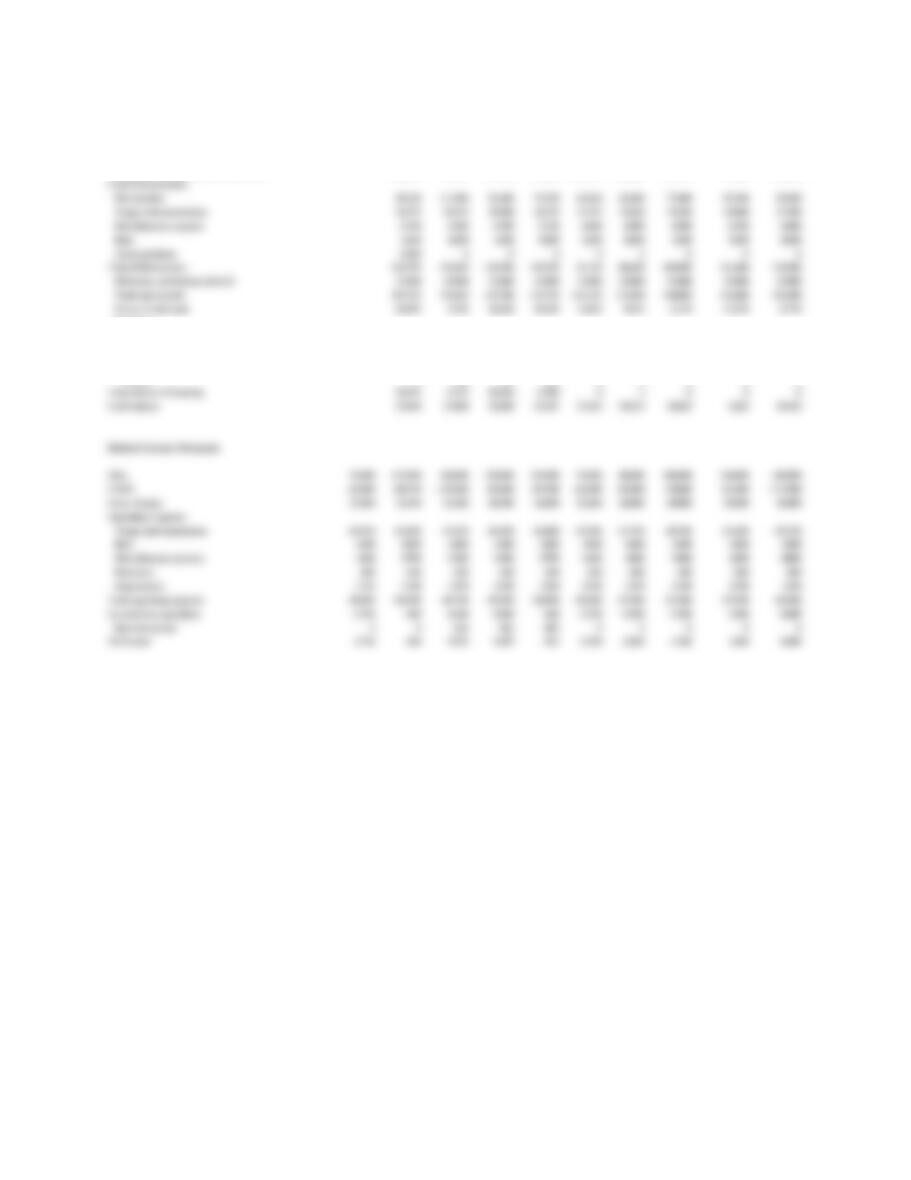
Cash Budget April May June July Aug. Sept. Oct. Nov. Dec.
Beginning cash balance 23,000 23,000 23,000 23,000 29,487 37,562 32,672 18,822 5,422
Cash receipts
Collections from customers 105,800 156,400 156,400 124,200 101,200 84,800 92,000 118,000 148,000
Total cash available for needs, before fin. 128,800 179,400 179,400 147,200 130,687 122,362 124,672 136,822 153,422
Cash disbursements:
Merchandise 98,210 111,090 93,380 75,670 62,650 62,440 77,000 97,300 93,100
Wages and commissions 21,275 28,175 29,900 24,725 21,275 18,650 19,250 23,000 27,500
Miscellaneous expenses 5,750 9,200 6,900 5,750 4,600 4,000 5,000 6,500 8,000
Rent 4,600 4,600 4,600 4,600 4,600 4,600 4,600 4,600 4,600
Truck purchase 6,900 0 0 0 0 0 0 0 0
Total disbursements 136,735 153,065 134,780 110,745 93,125 89,690 105,850 131,400 133,200
Minimum cash balance desired 23,000 23,000 23,000 23,000 23,000 23,000 23,000 23,000 23,000
Total cash needed 159,735 176,065 157,780 133,745 116,125 112,690 128,850 154,400 156,200
Excess of total cash -30,935 3,335 21,620 13,455 14,562 9,672 -4,178 -17,578 -2,778
Financing
New Borrowing 30,935 0 0 0 0 0 0 0 0
Repayments 2,871 21,199 6,865 0 0 0 0 0
Loan balance 30,935 28,064 6,865 0 0 0 0 0 0
Interest 0 464 421 103 0 0 0 0 0
Total effects of financing 30,935 -3,335 -21,620 -6,968 0 0 0 0 0
Cash balance 23,000 23,000 23,000 29,487 37,562 32,672 18,822 5,422 20,222
Budgeted Income Statements
Sales 92,000 115,000 184,000 138,000 115,000 92,000 80,000 100,000 130,000 160,000
COGS -64,400 -80,500 -128,800 -96,600 -80,500 -64,400 -56,000 -70,000 -91,000 -112,000
Gross Margin 27,600 34,500 55,200 41,400 34,500 27,600 24,000 30,000 39,000 48,000
Operating Expenses
Wages and commissions -19,550 -23,000 -33,350 -26,450 -23,000 -19,550 -17,750 -20,750 -25,250 -29,750
Rent -4600 -4600 -4600 -4600 -4600 -4600 -4600 -4600 -4600 -4600
Miscellaneous expenses -4600 -5750 -9200 -6900 -5750 -4600 -4000 -5000 -6500 -8000
Insurance -460 -460 -460 -460 -460 -460 -460 -460 -460 -460
Depreciation -1150 -1150 -1150 -1150 -1150 -1150 -1150 -1150 -1150 -1150
Total operating expenses -30,360 -34,960 -48,760 -39,560 -34,960 -30,360 -27,960 -31,960 -37,960 -43,960
Income from operations -2,760 -460 6,440 1,840 -460 -2,760 -3,960 -1,960 1,040 4,040
Interest expense 0 0 -464 -421 -103 0 0 0 0 0
Net income -2,760 -460 5,976 1,419 -563 -2,760 -3,960 -1,960 1,040 4,040
Chapter 6: Managing Cash Flow
109
Balance Sheets
Current Assets:
Cash 23,000 23,000 23,000 23,000 29,487 37,562 32,672 18,822 5,422 20,222
Accounts receivable 36,800 46,000 73,600 55,200 46,000 36,800 32,000 40,000 52,000 64,000
Merchandise inventory 110,400 149,040 123,280 110,400 97,520 90,800 102,000 118,800 135,600 102,000
Unexpired insurance 4,140 3,680 3,220 2,760 2,300 1,840 1,380 920 460 0
Total Current Assets 174,340 221,720 223,100 191,360 175,307 167,002 168,052 178,542 193,482 186,222
Plant
Equipment, fixtures and other 85,100 92,000 92,000 92,000 92,000 92,000 92,000 92,000 92,000 92,000
Accumulated depreciation -29,440 -30,590 -31,740 -32,890 -34,040 -35,190 -36,340 -37,490 -38,640 -39,790
Net PPE 55,660 61,410 60,260 59,110 57,960 56,810 55,660 54,510 53,360 52,210
Total Assets 230,000 283,130 283,360 250,470 233,267 223,812 223,712 233,052 246,842 238,432
Current Liabilities
Accounts payable 38,640 59,570 51,520 41,860 33,810 28,840 33,600 43,400 53,900 39,200
Accrued wages and commissions payable 9,775 11,500 16,675 13,225 11,500 9,775 8,875 10,375 12,625 14,875
Loan 0 30,935 28,064 6,865 0 0 0 0 0 0
Total Current Liabilities 48,415 102,005 96,259 61,950 45,310 38,615 42,475 53,775 66,525 54,075
Owner’s equity 181,585 181,125 187,101 188,520 187,957 185,197 181,237 179,277 180,317 184,357
Total equities 230,000 283,130 283,360 250,470 233,267 223,812 223,712 233,052 246,842 238,432
Accounting Statement of Cash Flows
Cash Flows From Activities
Net Income -460 5,976 1,419 -563 -2,760 -3,960 -1,960 1,040 4,040
Adjustments to Net Inc for CF
Depreciation Expense 1,150 1,150 1,150 1,150 1,150 1,150 1,150 1,150 1,150
Decrease in Prepaids 460 460 460 460 460 460 460 460 460
Increase in Accrued Liab. 1,725 5,175 -3,450 -1,725 -1,725 -900 1,500 2,250 2,250
Decrease in Inventory -38,640 25,760 12,880 12,880 6,720 -11,200 -16,800 -16,800 33,600
Decrease in A/P 20,930 -8,050 -9,660 -8,050 -4,970 4,760 9,800 10,500 -14,700
Increase in A/R -9,200 -27,600 18,400 9,200 9,200 4,800 -8,000 -12,000 -12,000
Decrease in Def. Inc. Tax 0 0 0 0 0 0 0 0 0
Total Adjustments -23,575 -3,105 19,780 13,915 10,835 -930 -11,890 -14,440 10,760
Net Cash Flow From Opps (Acct.) -24,035 2,871 21,199 13,352 8,075 -4,890 -13,850 -13,400 14,800
Capex -6,900 0 0 0 0 0 0 0 0
Net Cash Used by Ops/Investments -30,935 2,871 21,199 13,352 8,075 -4,890 -13,850 -13,400 14,800
Cash Flows from Financing
Equity Issues 0 0 0 0 0 0 0 0 0
Dividends 0 0 0 0 0 0 0 0 0
Debt Issues 30,935 -2,871 -21,199 -6,865 0 0 0 0 0
Net Cash Flows from Financing 30,935 -2,871 -21,199 -6,865 0 0 0 0 0
Net Decrease in Cash and Cash Equiv. 0 0 0 6,487 8,075 -4,890 -13,850 -13,400 14,800
Beginning Cash Balance 23,000 23,000 23,000 23,000 29,487 37,562 32,672 18,822 5,422
Ending Cash Balance 23,000 23,000 23,000 29,487 37,562 32,672 18,822 5,422 20,222
12. Artero Corporation, discussed in Problem 7, is a retailer of toy products. The firm’s
management team recently extended the monthly sales forecasts that were prepared for the
last three months of 2017 for an additional 6 months in 2018. These forecasts were
presented to Swen Artero, the firm’s president, as follows.
Month Sales Forecasts
October, 2017 $1,000,000
November 1,500,000
December 3,000,000
January, 2018 1,500,000
February 1,000,000
March 700,000
April 700,000
Chapter 6: Managing Cash Flow
110
May 700,000
June 700,000
A. Use the income statement related data and the balance sheet information from Problem 7
to prepare monthly income statements, balance sheets, and statements of cash flow for
October through December of 2017. What is the maximum amount of bank borrowing
that would be needed?
Artero Corporation
Income Statement
(Thousands of Dollars)
Sept. 2017
Oct. 2017
Nov. 2017
Dec. 2017
Sales
$ 700
$ 1,000
$ 1,500
$ 3,000
Cost of Goods Sold
560
800
1,200
2,400
Gross Margin
140
200
300
600
Depreciation
10
10
10
10
Other Expense
49
70
105
210
Interest
12
12
15
18
EBT
69
108
170
362
Taxes (40%)
28
43
68
145
Net Income
41
65
102
217
Balance Sheet
(Thousands of Dollars)
Sept.30, 17
Oct.31, 17
Nov. 30, 17
Dec. 31, 17
Cash
$ 50
$ 80
$ 80
$ 80
Accounts Receivable
700
1,000
1,500
3,000
Inventories
500
500
500
500
Total Currents Assets
1,250
1,580
2,080
3,580
Fixed Assets, Net
750
740
730
720
Total Assets
$ 2,000
$ 2,320
$ 2,810
$ 4,300
Accounts Payable
$ –
$ –
$ –
$ –
Notes Payable
800
800
800
800
Long-term Debt
400
400
400
400
Additional Funds Needed
–
255
643
1,916
Total Liabilities
1,200
1,455
1,843
3,116
Equity
800
865
967
1,184
Total Liabilities & Equity
$ 2,000
$ 2,320
$ 2,810
$ 4,300
Chapter 6: Managing Cash Flow
111
Statement of Cash Flow
(Thousands of Dollars)
10/31/2017
11/30/2017
12/31/2017
Cash Flow From Operations
Net Income
$ 65
$ 102
$ 217
+ Depreciation
10
10
10
– Increase In A/R
300
500
1,500
– Increase In Inventory
0
0
0
Cash Flow From Operations
–225
–388
–1,273
Cash Flow from Investing
0
0
0
Cash Flow from Financing
0
0
0
Total Cash Flow
–225
–388
–1,273
Beginning Cash Balance
50
80
80
Required Balance
80
80
80
Additional Funds Needed
255
388
1,273
Cumulative Funds Needed
255
643
1,916
Ending Cash Balance
80
80
80
As shown in both Balance Sheet and Statement of Cash Flow, $1,916,000 was needed to
support the projected sales in the coming three months.
B. Prepare monthly income statements, balance sheets, and statements of cash flow for the
first six months of 2018. Assume the information and data relationships from Problem 7
will continue to hold for the first six months of 2018. Indicate if, and when, the
additional bank borrowing needed during the last three months of 2017 can be repaid.
Chapter 6: Managing Cash Flow
112
Artero Corporation Pro Forma Statements 2018
Income Statement (Thousands of Dollars)
Jan. 15
Feb. 15
Mar. 15
Apr. 15
May. 15
June. 15
July. 15
Aug. 15
Sep. 15
Oct. 15
Nov. 15
Dec. 15
2018
Sales
$1,500
$ 1,000
$ 700
$ 700
$ 700
$ 700
$ 900
$ 1,100
$ 1,400
$ 1,700
$ 2,800
$ 4,000
$ 17,200
Cost of Goods Sold
1,200
800
560
560
560
560
720
880
1,120
1,360
2,240
3,200
$ 13,760
Gross Margin
300
200
140
140
140
140
180
220
280
340
560
800
3,440
Depreciation
10
10
10
10
10
10
10
12
12
12
12
12
130
Other Expense
105
70
49
49
49
49
63
77
98
119
196
280
1,204
Interest
31
15
12
12
12
12
12
12
12
12
12
20
175
EBT
154
105
69
69
69
69
95
119
158
197
340
488
1,931
Taxes (40%)
62
42
28
28
28
28
38
48
63
79
136
195
773
Net Income
92
63
41
41
41
41
57
71
95
118
204
293
1,159
Balance Sheet 2018 (Thousands of Dollars)
Jan. 15
Feb. 15
Mar. 15
Apr. 15
May. 15
June. 15
July. 15
Aug. 15
Sep. 15
Oct. 15
Nov.15
Dec. 15
Cash Required
$ 80
$ 80
$ 80
$ 80
$ 80
$ 80
$ 80
$ 80
$ 80
$ 80
$ 80
$ 80
Cash Surplus
259
611
662
713
765
532
415
222
52
Total Cash
339
691
742
793
845
612
495
302
132
80
80
Accounts Receivable
1,500
1,000
700
700
700
700
900
1,100
1,400
1,700
2,800
4,000
Inventories
500
500
500
500
500
500
500
500
500
500
500
500
Total Currents Assets
2,080
1,839
1,891
1,942
1,993
2,045
2,012
2,095
2,202
2,332
3,380
4,580
Fixed Assets, Net
710
700
690
680
670
660
750
738
726
714
702
690
Total Assets
$ 2,790
$ 2,539
$ 2,581
$ 2,622
$ 2,663
$ 2,705
$ 2,762
$ 2,833
$ 2,928
$ 3,046
$ 4,082
$ 5,270
Accounts Payable
$ –
$ –
$ –
$ –
$ –
$ –
$ –
$ –
$ –
$ –
$ –
$ –
Notes Payable
800
800
800
800
800
800
800
800
800
800
800
800
Long-term Debt
400
400
400
400
400
400
400
400
400
400
400
400
Additional Funds Needed
314
832
1727
Total Liabilities
1,514
1,200
1,200
1,200
1,200
1,200
1,200
1,200
1,200
1,200
2,032
2,927
Equity
1,276
1,339
1,381
1,422
1,463
1,505
1,562
1,633
1,728
1,846
2,050
2,343
Total Liabilities & Equity
$ 2,790
$ 2,539
$ 2,581
$ 2,622
$ 2,663
$ 2,705
$ 2,762
$ 2,833
$ 2,928
$ 3,046
$ 4,082
$ 5,270
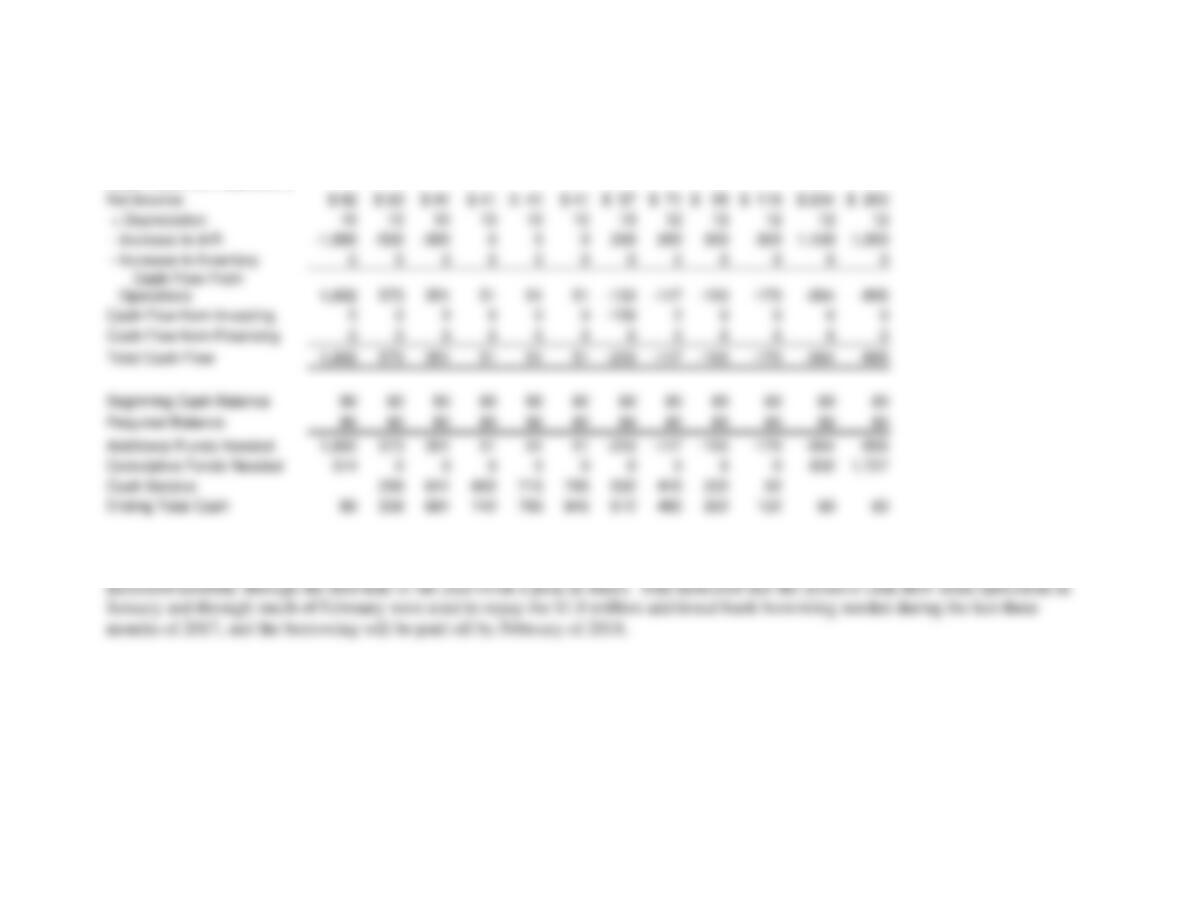
Chapter 6: Managing Cash Flow
113
Statement of Cash Flow (Thousands of Dollars)
1/31/18
2/28/18
3/31/18
4/30/18
5/31/18
6/30/18
7/31/18
8/31/18
9/30/18
10/31/18
11/30/18
12/31/18
Cash Flow From Operations
Net Income
$ 92
$ 63
$ 41
$ 41
$ 41
$ 41
$ 57
$ 71
$ 95
$ 118
$ 204
$ 293
+ Depreciation
10
10
10
10
10
10
10
12
12
12
12
12
– Increase In A/R
–1,500
–500
–300
0
0
0
200
200
300
300
1,100
1,200
– Increase In Inventory
0
0
0
0
0
0
0
0
0
0
0
0
Cash Flow From
Operations
1,602
573
351
51
51
51
–133
–117
–193
–170
–884
–895
Cash Flow from Investing
0
0
0
0
0
0
–100
0
0
0
0
0
Cash Flow from Financing
0
0
0
0
0
0
0
0
0
0
0
0
Total Cash Flow
1,602
573
351
51
51
51
–233
–117
–193
–170
–884
–895
Beginning Cash Balance
80
80
80
80
80
80
80
80
80
80
80
80
Required Balance
80
80
80
80
80
80
80
80
80
80
80
80
Additional Funds Needed
1,602
573
351
51
51
51
–233
–117
–193
–170
–884
–895
Cumulative Funds Needed
314
0
0
0
0
0
0
0
0
0
832
1,727
Cash Surplus
259
611
662
713
765
532
415
222
52
Ending Total Cash
80
339
691
742
793
845
612
495
302
132
80
80
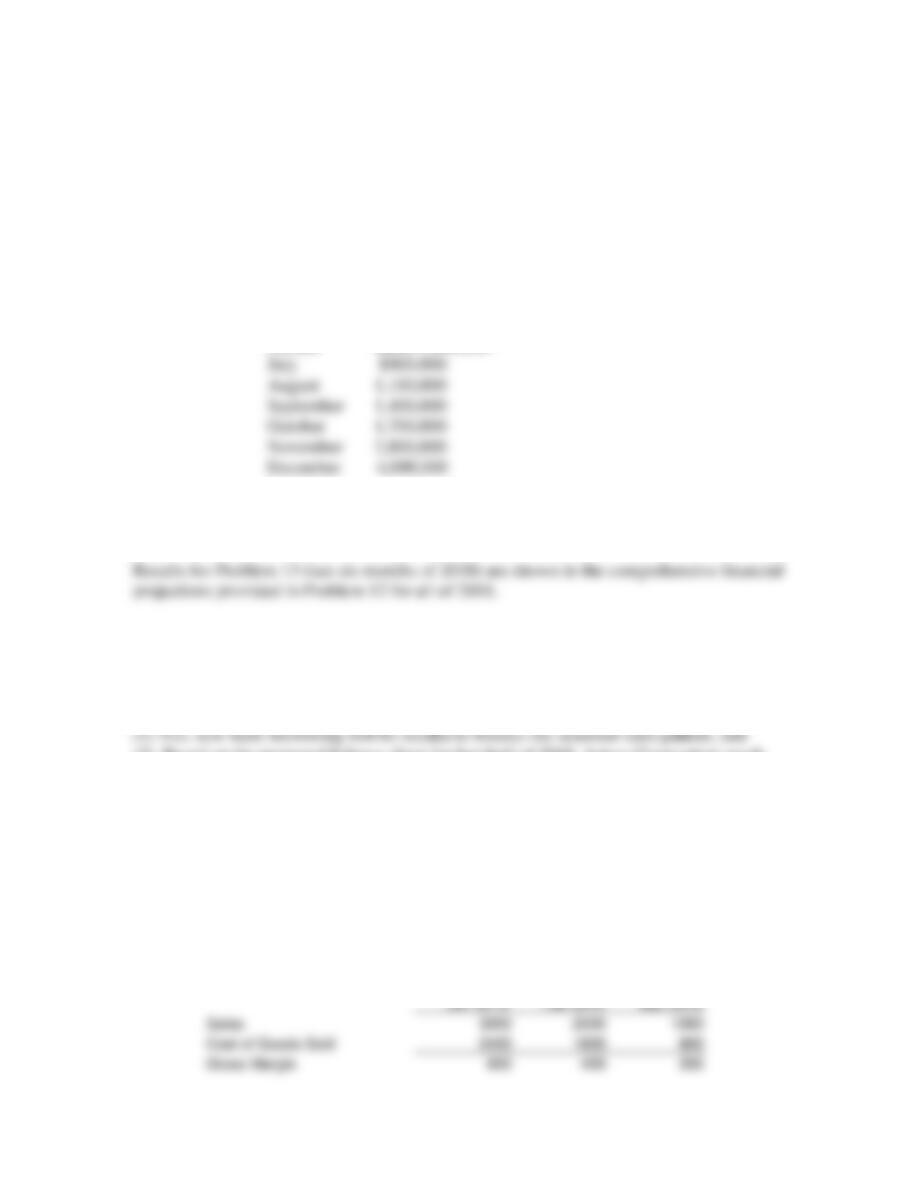
As shown on the company’s balance sheet and statement of cash flow, started from February of 2018, the cash surplus account
Chapter 6: Managing Cash Flow
114
C. Based on your financial statement projections for the first six months of 2018, indicate
whether new bank borrowing will be needed.
As previously noted, surplus cash continues to rise through June, 2018. Thus, no new bank
borrowing will be needed during the first half of 2018.
13. Artero Corporation, discussed in Problems 7 and 12, is a retailer of toy products. This is a
continuation of Problem 12. The firm’s management team recently extended the monthly sales
forecasts through the last six months of 2018. Artero expects to spend $100,000 on fixed assets
in July 2018 and depreciation charges will increase to $12,000 per month beginning in August
2018.
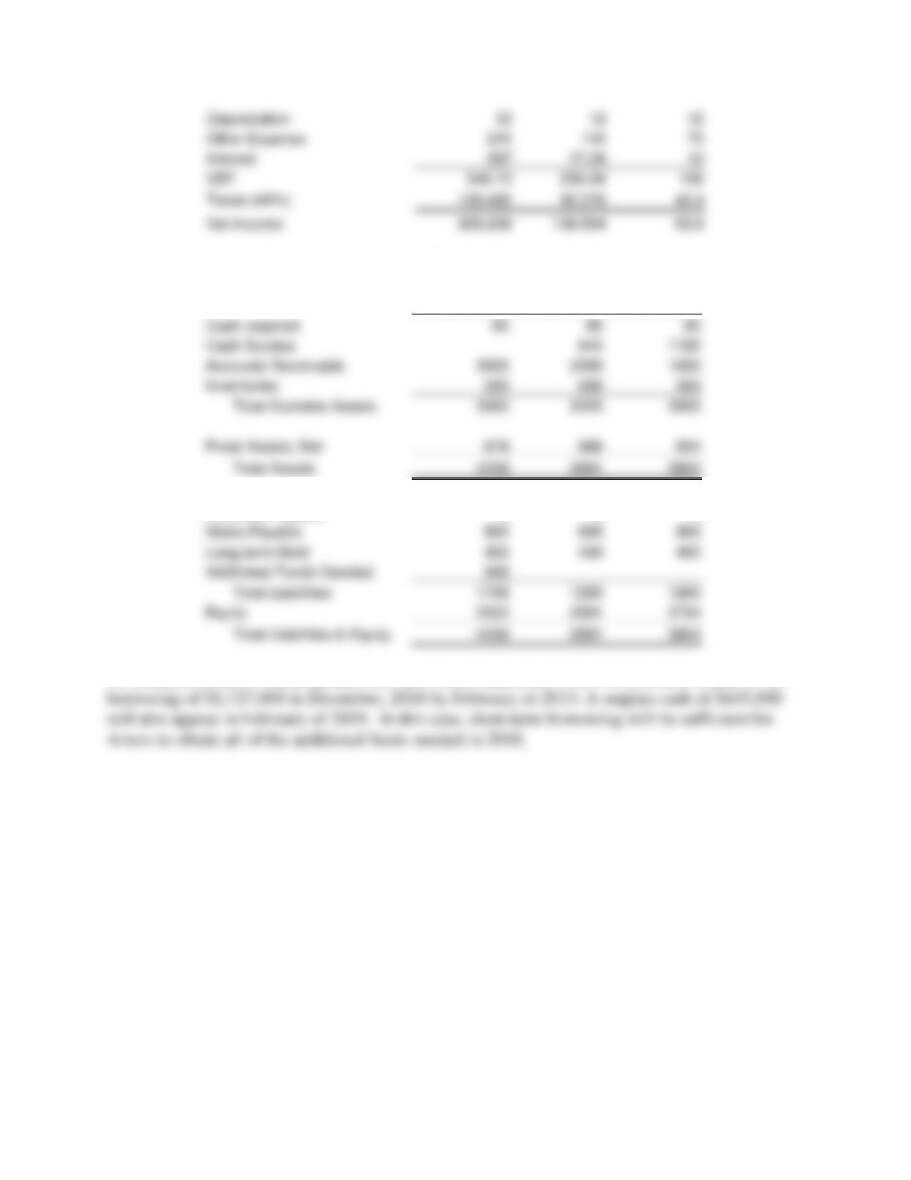
Month Sales Forecasts
A. Prepare monthly income statements, balance sheets, and statements of cash flow for the last
six months of 2018.
B. Based on your financial statement projections for the last six months of 2018 indicate (1)
whether new bank borrowing will be needed to finance the seasonal sales pattern and (2) if a
loan is needed, when does the need start occurring and what is the maximum amount
needed?
(2) Based on the projected balance sheet for last-half of 2018, Artero Corporation needs
seasonal bank borrowing beginning in November of 2018 ($832,000) with a maximum
cumulative need of $1,727,000 in December.
C. Assume that sales are forecasted for the first three months of 2019 as follows: January = $3
million, February = $2 million, and March = $1 million. Will Artero be able to pay off any
bank borrowing that is needed in 2018? Based on your analyses, what type(s), if any, of bank
loan(s) are needed in 2018?
Artero Corporation
Pro Forma Income Statement 2019 (Thousands of Dollars)
Jan 2019
Feb 2019
Mar.2019
Sales
3000
2000
1000
Cost of Goods Sold
2400
1600
800
Gross Margin
600
400
200
Chapter 6: Managing Cash Flow
115
Depreciation
12
12
12
Other Expense
210
140
70
Interest
297
17.06
12
EBT
348.73
230.94
106
Taxes (40%)
139.492
92.376
42.4
Net Income
209.238
138.564
63.6
Pro Forma Balance Sheet (Thousands of Dollars)
Jan. 2019
Feb. 2019
Mar. 2019
Cash required
80
80
80
Cash Surplus
645
1720
Accounts Receivable
3000
2000
1000
Inventories
500
500
500
Total Currents Assets
3580
3225
3300
Fixed Assets, Net
678
666
654
Total Assets
4258
3891
3954
Accounts Payable
0
0
0
Notes Payable
800
800
800
Long-term Debt
400
400
400
Additional Funds Needed
506
Total Liabilities
1706
1200
1200
Equity
2552
2691
2754
Total Liabilities & Equity
4258
3891
3954
As indicated above in the projected 2019 pro forma statement, Artero will be able to pay off all
MINI CASE: SCANDI HOME FURNISHINGS, INC.
Kaj Rasmussen founded Scandi Home Furnishings as a corporation during mid-2013. Sales
during the first full year (2014) of operation reached $1.3 million. Sales increased by 15 percent
in 2015 and another 20 percent in 2016. However, profits after increasing in 2015 over 2014 fell
sharply in 2016 causing Kaj to wonder what was happening to his “pride and joy” business
venture. After all, Kaj has continued to work as close as possible to a 24/7 pace beginning with
the startup of Scandi and through the first three full years of operation.
Scandi Home Furnishings, located in eastern North Carolina, designs, manufactures, and
sells Scandinavian-designed furniture and accessories to home furnishings retailers. The modern
Scandinavian design has a streamlined and uncluttered look. While this furniture style is
primarily associated with Denmark, both Norway and Sweden designers have contributed to the

Chapter 6: Managing Cash Flow
116
allure of Scandinavian home furnishings. Some say that the inspiration for the Scandinavian
design can be traced to the “elegant curves” of art nouveau from which designers were able to
produce aesthetically pleasing, structurally strong modern furniture. Danish furnishings and the
home furnishings produced by the other Scandinavian countries—Sweden, Norway, and
Finland—are made using wood (primarily oak, maple, and ash), aluminum, steel, and high-grade
plastics.
Kaj grew up in Copenhagen, Denmark and received a college degree from a technical
university in Sweden. As is typically in Europe, Kaj began his business career as an apprentice
at a major home furnishings manufacturer in Copenhagen. After “learning the trade,” he quickly
moved into a management position in the firm. However, after a few years, Kaj realized that
what he really wanted to do was to start and operate his own Scandinavian home furnishings
business. At the same time, after traveling throughout the world including the U.S., he was sure
that he wanted to be an entrepreneur in the United States. Thus, while it was hard to give up the
Tivoli Gardens with its many entertainment and dining activities, as well as the other attractions
in Copenhagen, Kaj moved to the U.S. in early 2013. With $140,000 of his personal assets, and
$210,000 from venture investors, he began operations in mid-2013. Kaj, with a 40 percent
ownership interest and industry-related management expertise, was allowed to operate the
venture in a way that he thought was best for Scandi. Four years later, Kaj is sure he did the
right thing.
Following are the three years of income statements and balance sheets for the Scandi
Home Furnishings Corporation. Kaj has felt that in order to maintain a competitive advantage
that he would need to continue to expand sales. After first concentrating on selling Scandinavian
home furnishings in the northeast in 2014 and 2015, he decided to enter the west coast market.
An increase in expenses associated with identifying, contacting, and selling to home furnishings
retailers in California, Oregon, and Washington. Kaj Rasmussen was hoping that you could help
him better understand what has been happening to Scandi Home Furnishings both from operating
and financial standpoints.
SCANDI HOME FURNISHINGS, INC.
Income Statements
2014 2015 2016
Net Sales $1,300,000 $1,500,000 $1,800,000
Cost of Goods Sold 780,000 900,000 1,260,000
Gross Profit 520,000 600,000 540,000
Marketing 130,000 150,000 200,000
General & Administrative 150,000 150,000 200,000
Depreciation 40,000 53,000 60,000
EBIT 200,000 247,000 80,000
Interest 45,000 57,000 70,000
Earnings Before Taxes 155,000 190,000 10,000
Income Taxes (40%) 62,000 76,000 4,000
Net Income $93,000 $114,000 $6,000
Cash Dividends $0 $74,000 $0
Chapter 6: Managing Cash Flow
117
SCANDI HOME FURNISHINGS, INC.
Balance Sheets
2014 2015 2016
Cash $50,000 $40,000 $10,000
Accounts Receivables 200,000 260,000 360,000
Inventories 450,000 500,000 600,000
Total Current Assets 700,000 800,000 970,000
Fixed Assets, Net 300,000 400,000 500,000
Total Assets $1,000,000 $1,200,000 $1,470,000
Accounts Payable $130,000 $170,000 $180,000
Accruals 50,000 70,000 80,000
Bank Loan 90,000 90,000 184,000
Total Current Liabilities 270,000 330,000 444,000
Long-Term Debt 300,000 400,000 550,000
Common Stock ($10 par)* 300,000 300,000 300,000
Capital Surplus 50,000 50,000 50,000
Retained Earnings 80,000 120,000 126,000
Total Liab. & Equity $1,000,000 $1,200,000 $1,470,000
Note: 30,000 shares of common stock were issued to Kaj Rasmussen and the venture investors
when Scandi Home Furnishings was incorporated in mid-2013.
A. An analysis of the cash conversion cycle should also help Kaj understand what has been
happening to the operations of Scandi. Prepare an analysis of the average conversion
periods for the three components of the cash conversion cycle for 2014-2015 and 2015-
2016. Explain was has happened in terms of each component of the cycle.
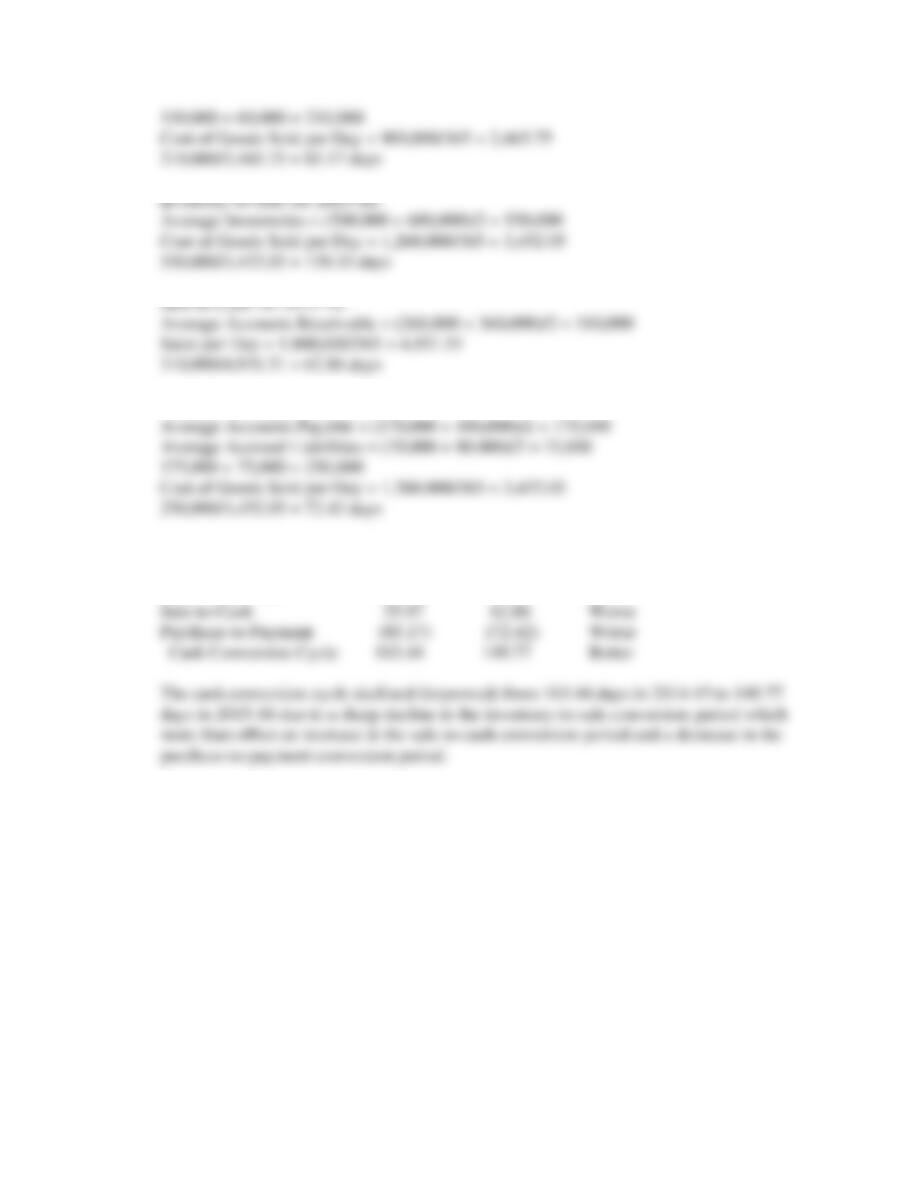
Inventory-to-Sale for 2014-15:
Sale-to-Cash for 2014-15:
Purchase-to-Payment for 2014-15:
Chapter 6: Managing Cash Flow
118
Purchase-to-Payment for 2015-16:
Cash Conversion Cycle (in Days):
2014-15 2015-16 Change
Inventory-to-Sale 192.64 159.33 Better
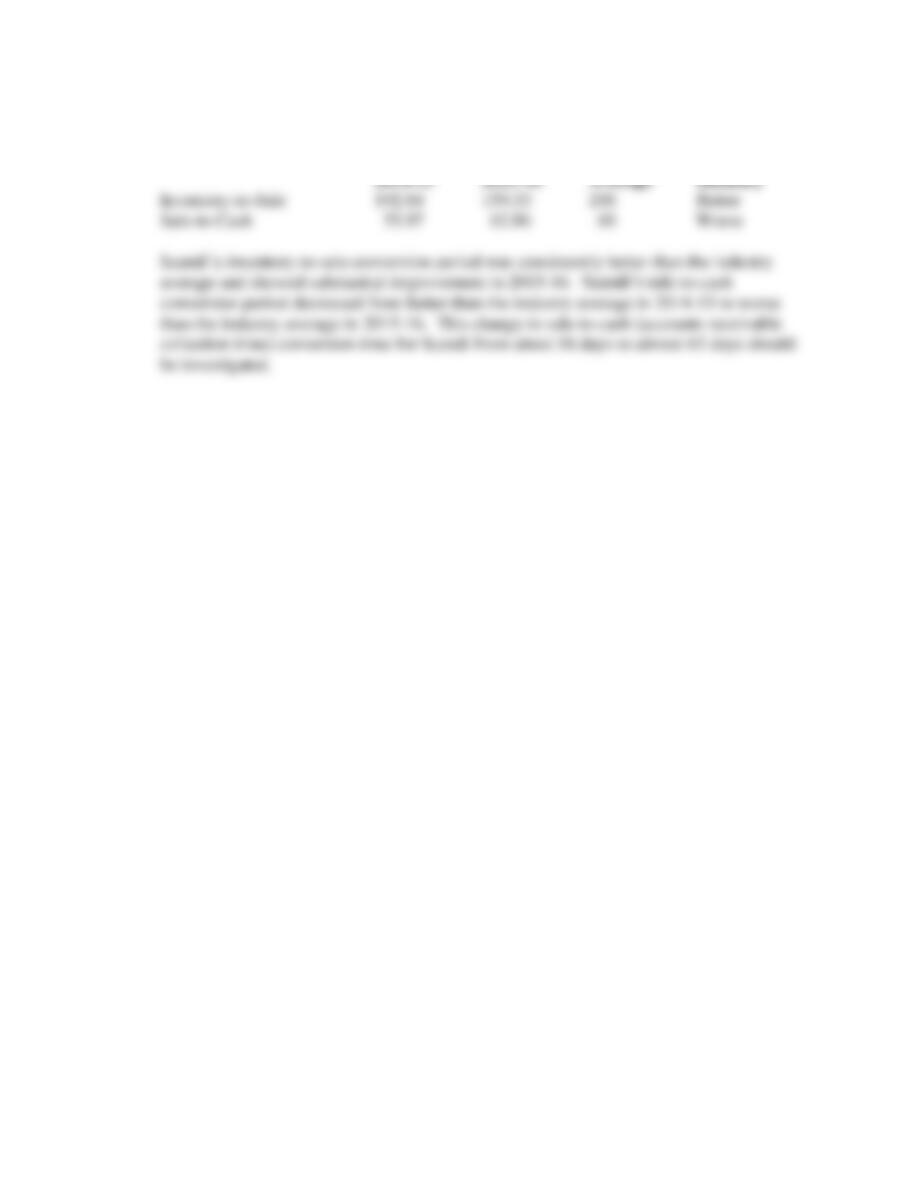
B. Kaj has been able to obtain some industry ratio data from the home furnishings industry
trade association of which he is a member. The industry association collects proprietary
financial information from members of the association, compiles averages to protect the
proprietary nature of the information, and provides averages for use by individual trade
association members. Over the 2014-2015 and 2015-2016 periods, the inventory-to-sale
conversion period has averaged 200 days, while the sale-to-cash conversion period (days
of sales outstanding) for the industry has averaged 60 days. How did Scandi’s operations
compare with these industry averages in terms of these two components of the cash
conversion cycle?
Chapter 6: Managing Cash Flow
119
Conversion Periods (in Days):
Scandi
Scandi Corporation Industry Compared to