89
Chapter 6
MANAGING CASH FLOW
FOCUS
In this chapter, we focus on short-term financial planning involving projecting monthly financial
statements for one year or less. The availability of cash is what drives the entrepreneurial
venture. Inadequate cash often constrains the venture’s ability to grow, is a primary cause of
financial distress, and can result in bankruptcy even though the venture may be profitable in an
accounting sense. The process of preparing short-term projected financial statements also helps
the entrepreneur anticipate and estimate additional external financial capital needed to support
the business plan during the next year. We also cover a venture’s operating cycle and its cash
conversion cycle and their importance in managing cash flow.
LEARNING OBJECTIVES
1. Construct a cash budget and determine the timing and amount of any monthly cash needs.
2. Describe how short-term projected statements of cash flows relate to cash budgets.
3. Explain why short-term projected statements of cash flow are important to the entrepreneur.
4. Identify and describe the use and value of conversion period ratios to the entrepreneur.
CHAPTER OUTLINE
6.1 FINANCIAL PLANNING THROUGHOUT THE VENTURE’S LIFE CYCLE
6.2 SURVIVING IN THE SHORT RUN
6.3 SHORT-TERM CASH-PLANNING TOOLS
6.4 PROJECTED MONTHLY FINANCIAL STATEMENTS
6.5 CASH PLANNING FROM A PROJECTED MONTHLY BALANCE SHEET
6.6 CONVERSION PERIOD RATIOS
A. Measuring Conversion Times
B. Interpreting Changes in Conversion Times
SUMMARY
DISCUSSION QUESTIONS AND ANSWERS
1. What does short-term financial planning involve?
2. Provide a description of the financing cost implications associated with a venture’s need for
additional funds.
Chapter 6: Managing Cash Flow
90
The cost of obtaining additional funds may be explicit, such as additional interest expense
3. What is meant by a cash budget? Describe how a cash budget is prepared.
4. Besides the cash budget, what additional financial statements are projected monthly in
conjunction with short-term financial planning?
5. What is meant by a venture’s operating cycle?
6. Describe the cash conversion cycle (C3).
7. What are the three components of the cash conversion cycle (C3)? How is each component
calculated?
The three components of the cash conversion cycle are inventory-to–sale conversion period, sales-to–
8. Briefly explain how changes in the conversion times of the components of the C3 can be interpreted.
A lengthening of the inventory-to–sale conversion period indicates less efficient inventory
Chapter 6: Managing Cash Flow
92
March $80,000 $110,000
April $100,000 $150,000
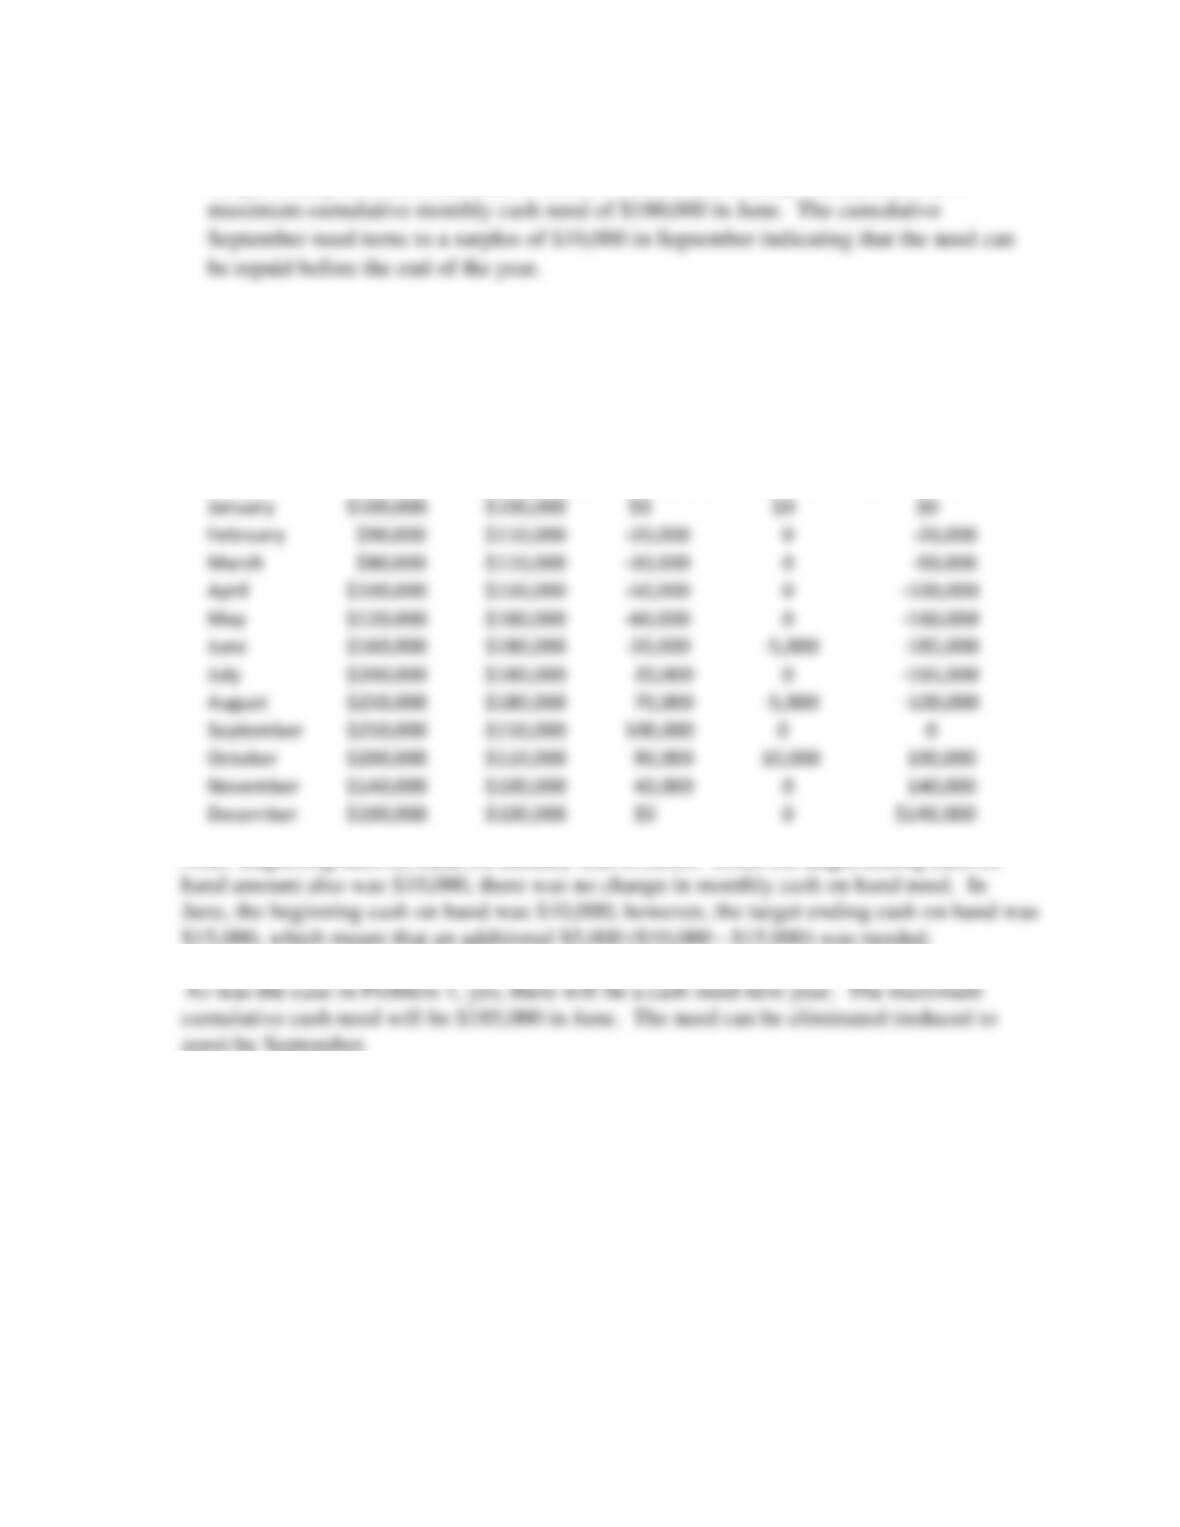
A. Determine whether Itsar Products will have a cash need during the next year.
Cash Cash Monthly Cumulative
Month Receipts Disbursements Rec – Disb Amount
Note: the January beginning cash on hand is $10,000. Since the minimum end of cash
month
B. If Itsar Products has a cash need, indicate the month when the need will begin and
determine the month and amount when the maximum need will occur.
C. Determine whether the cash need (if any) can be repaid within the next year.
Chapter 6: Managing Cash Flow
93
As previously noted, a cash need of $20,000 occurs in February and increases to a
2. Rework Problem 1 assuming minimum cash on hand requirements are $10,000 a month
through May, increase to $15,000 in June and July, increase further to $20,000 in August
and September, and return to the $10,000 per month level beginning in October.
Beg Min Cash
Cash Cash Monthly Minus Cumulative
Month Receipts Disbursements Rec – Disb End Min Cash Amount
Note: Beginning cash on hand for January was $10,000. Since the target ending cash on
$15,000, which meant that an additional $5,000 ($10,000 – $15,000) was needed.
3. [Short-Term Financial Planning] The PDC Company was described during the early part of
this chapter. Refer to the PDC Company’s projected monthly operating schedules in Table
6.2. PDC’s sales are projected to be $80,000 in September 2017.
[Note: An Excel spreadsheet for the PDC Company is available on the authors’ Web
site for use by instructors.]
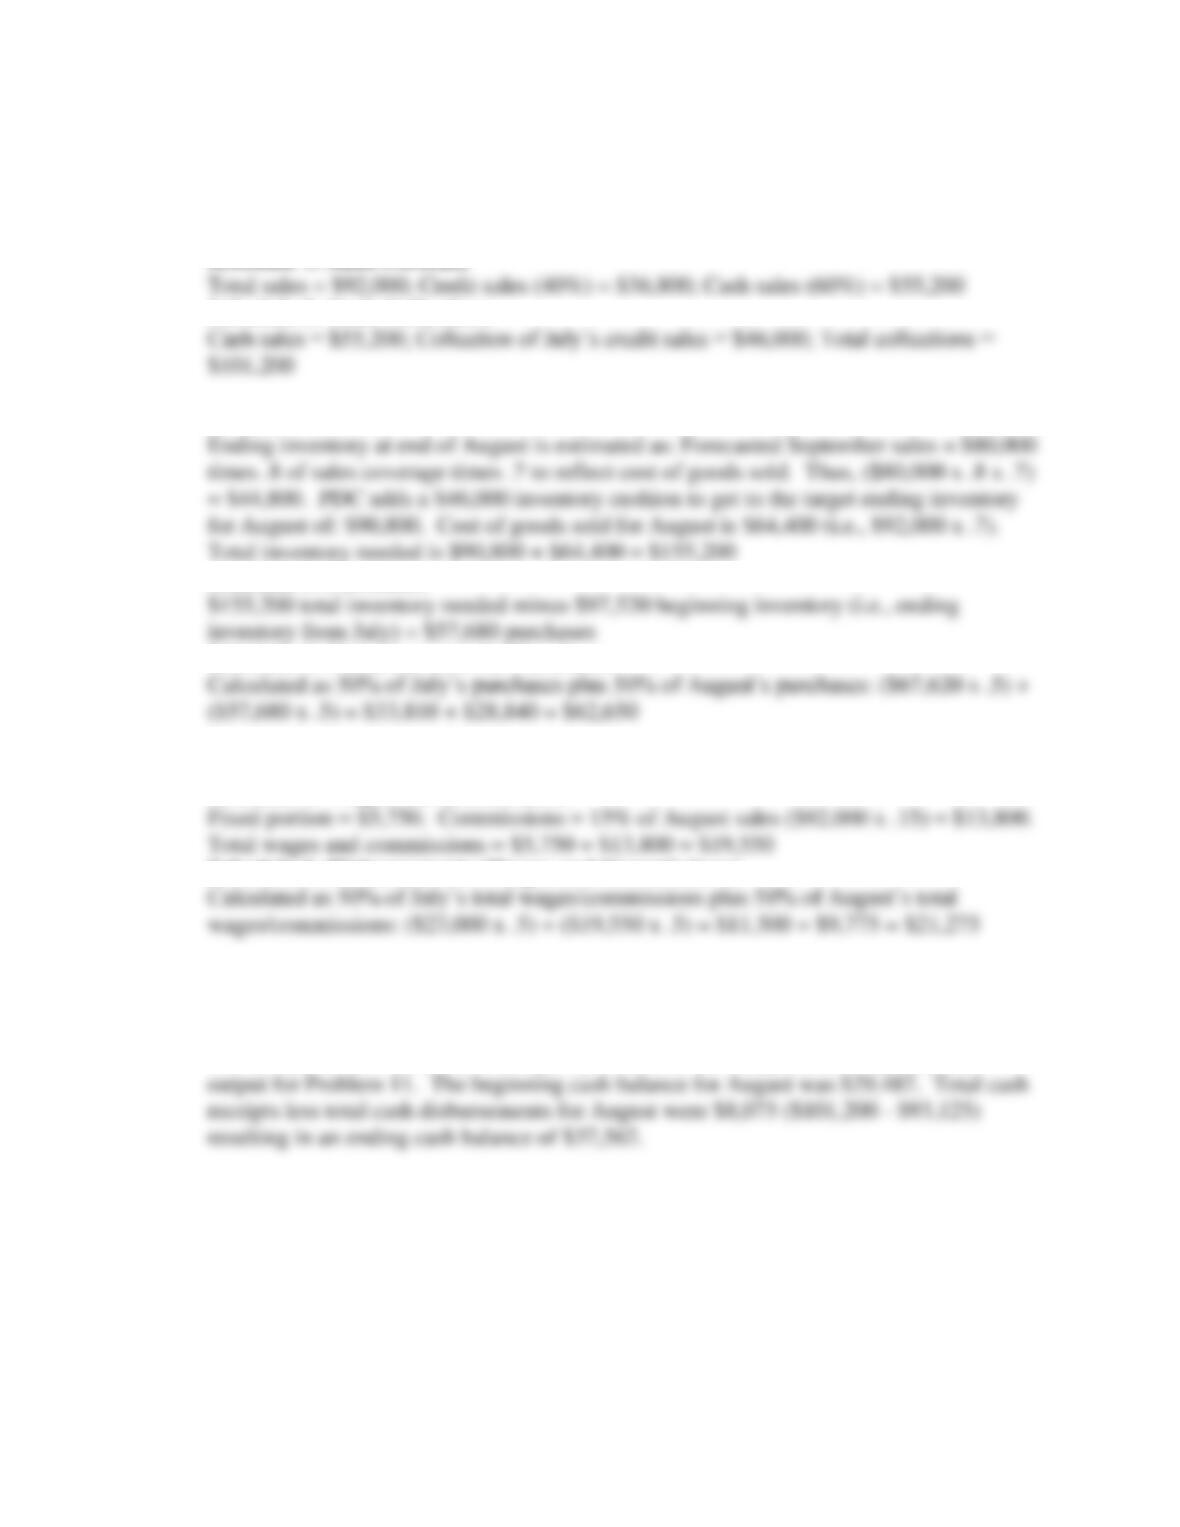
A. Prepare PDC’s sales schedule, purchases schedule, and the wages schedule for August
2017.
Chapter 6: Managing Cash Flow
94
See the spreadsheet solution for Problem 11. Here we are focusing just on projecting the
month of August.
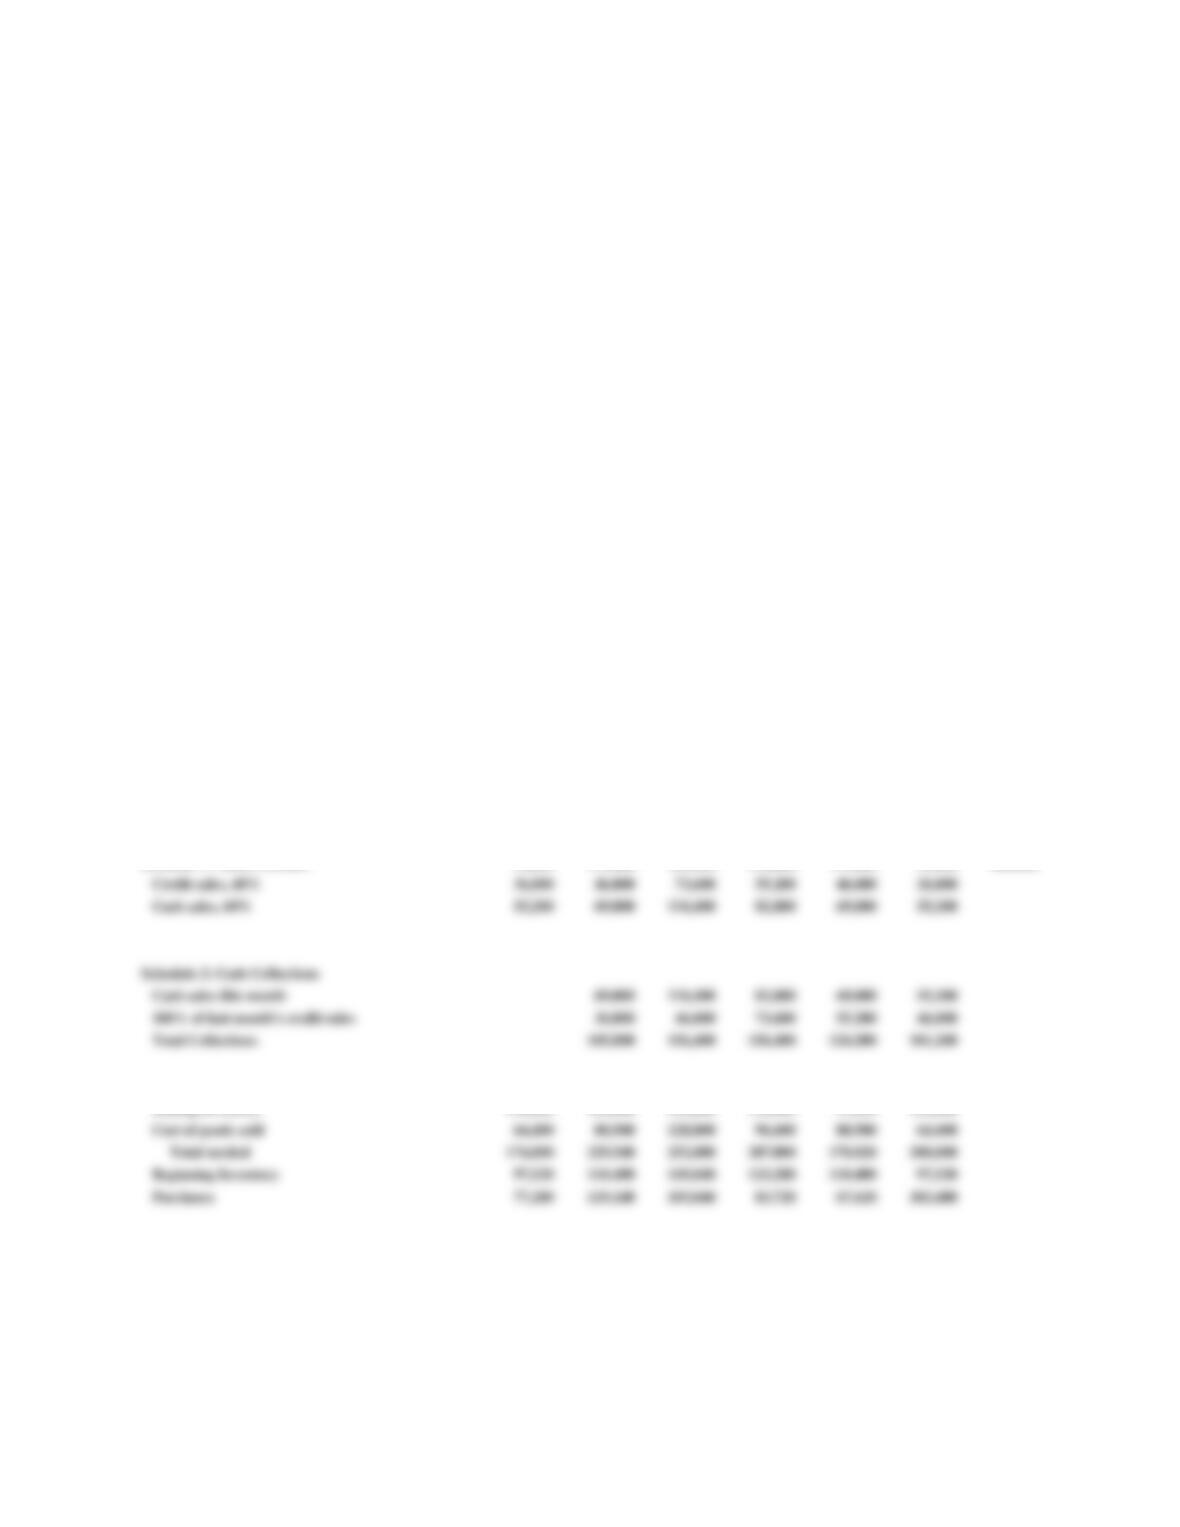
Sales Schedule:
Schedule 1: Sales Forecast
Schedule 2: Cash Collections
Purchases Schedule:
Schedule 3: Purchases
Schedule 4: Disbursements for Purchases
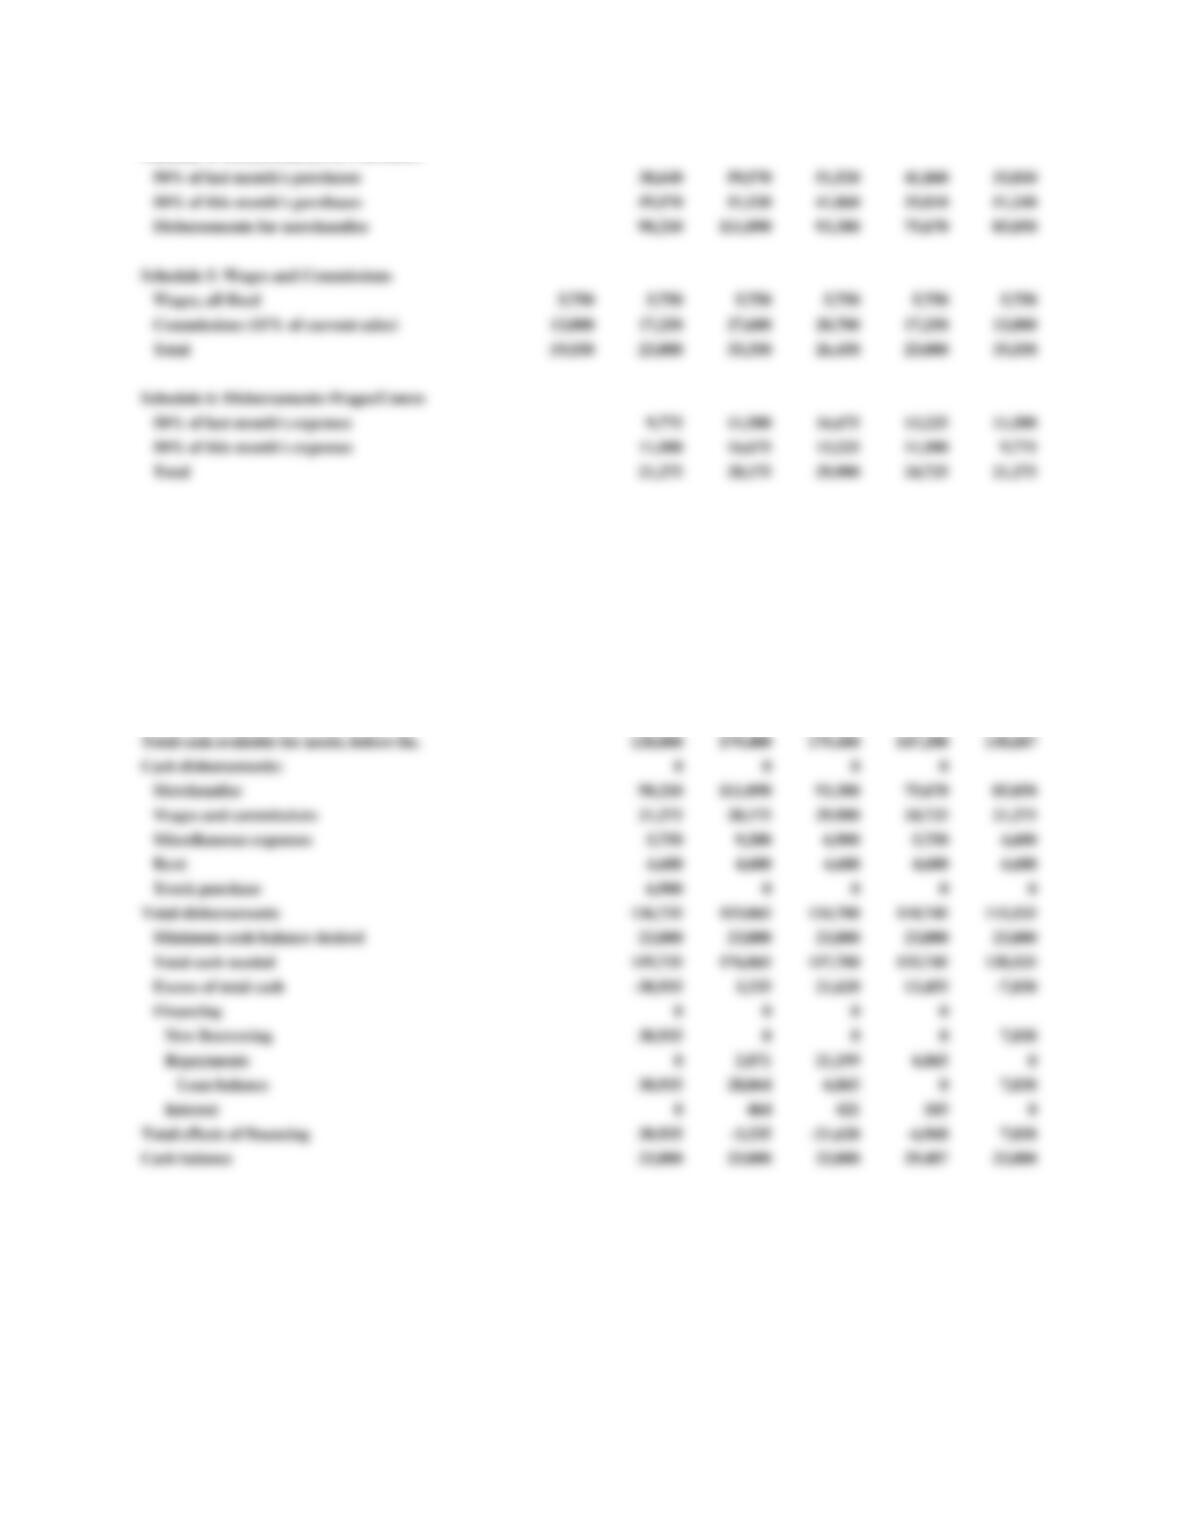
Wages and Commissions Schedule:
Schedule 5: Wages and Commissions
Schedule 6: Disbursements (Wages and Commissions)
B. Prepare a cash budget for August 2017 for the PDC Company and describe how the
forecast affects the end-of-month cash balance.
See the spreadsheet solution for August provided in the comprehensive spreadsheet
4. [Short-Term Financial Planning] The PDC Company was described during the early
part of this chapter. Refer to the PDC Company’s projected monthly operating schedules
in Table 6.2. PDC’s sales are projected to be $80,000 in September 2017.
A. Prepare the PDC Company’s projected income statement for August.
Chapter 6: Managing Cash Flow
95
See the spreadsheet solution for August provided in the comprehensive spreadsheet
output provided in Problem 11.
B. Prepare the PDC Company’s projected balance sheet for August.
See the spreadsheet solution for August provided in the comprehensive spreadsheet
output provided in Problem 11.
C. Prepare the PDC Company’s projected statement of cash flow for August.
See the spreadsheet solution for August provided in the comprehensive spreadsheet
output provided in Problem 11.
D. Compare your balance sheet at the end of August with the balance sheet in Table 6.1 in
the chapter and apply the balance sheet method to determine cash flows over the March-
August time period.
See the spreadsheet solution for August provided in the comprehensive spreadsheet
output provided in Problem 11.
5. [Short-Term Financial Planning] Rework Problem 3 based on the assumption that, because
of an unexpected order, the PDC Company’s sales are forecasted to be $160,000 for
September 2017.
March April May June July Aug. Sept.
Schedule 1: Sales Forecast 92,000 115,000 184,000 138,000 115,000 92,000 160,000
Credit sales, 40% 36,800 46,000 73,600 55,200 46,000 36,800
Cash sales, 60% 55,200 69,000 110,400 82,800 69,000 55,200
Schedule 2: Cash Collections
Cash sales this month 69,000 110,400 82,800 69,000 55,200
100% of last month’s credit sales 36,800 46,000 73,600 55,200 46,000
Total Collections 105,800 156,400 156,400 124,200 101,200
Ending inventory 110,400 149,040 123,280 110,400 97,520 135,600
Cost of goods sold 64,400 80,500 128,800 96,600 80,500 64,400
Total needed 174,800 229,540 252,080 207,000 178,020 200,000
Beginning Inventory 97,520 110,400 149,040 123,280 110,400 97,520
Purchases 77,280 119,140 103,040 83,720 67,620 102,480
Chapter 6: Managing Cash Flow
96
Schedule 4: Disbursements for Purchases
50% of last month’s purchases 38,640 59,570 51,520 41,860 33,810
50% of this month’s purchases 59,570 51,520 41,860 33,810 51,240
Disbursements for merchandise 98,210 111,090 93,380 75,670 85,050
Schedule 5: Wages and Commissions
Wages, all fixed 5,750 5,750 5,750 5,750 5,750 5,750
Commissions (15% of current sales) 13,800 17,250 27,600 20,700 17,250 13,800
Total 19,550 23,000 33,350 26,450 23,000 19,550
Schedule 6: Disbursements-Wages/Comm
50% of last month’s expenses 9,775 11,500 16,675 13,225 11,500
50% of this month’s expenses 11,500 16,675 13,225 11,500 9,775
Total 21,275 28,175 29,900 24,725 21,275
Miscellaneous expenses 5,750 9,200 6,900 5,750 4,600
Rent 4,600 4,600 4,600 4,600 4,600
Truck purchase 6,900 0 0 0 0
Total disbursements 136,735 153,065 134,780 110,745 115,525
Minimum cash balance desired 23,000 23,000 23,000 23,000 23,000
Total cash needed 159,735 176,065 157,780 133,745 138,525
Excess of total cash -30,935 3,335 21,620 13,455 -7,838
Financing 0 0 0 0
New Borrowing 30,935 0 0 0 7,838
Repayments 0 2,871 21,199 6,865 0
Loan balance 30,935 28,064 6,865 0 7,838
Chapter 6: Managing Cash Flow
98
Accounting Statement of Cash Flows
Cash Flows From Activities
Net Income -460 5,976 1,419 -563 -2,760
Adjustments to Net Inc for CF
Depreciation Expense 1,150 1,150 1,150 1,150 1,150
Decrease in Prepaids 460 460 460 460 460
Increase in Accrued Liab. 1,725 5,175 -3,450 -1,725 -1,725
Decrease in Inventory -38,640 25,760 12,880 12,880 -38,080
Decrease in A/P 20,930 -8,050 -9,660 -8,050 17,430
Increase in A/R -9,200 -27,600 18,400 9,200 9,200
Decrease in Def. Inc. Tax 0 0 0 0 0
Total Adjustments -23,575 -3,105 19,780 13,915 -11,565
Net Cash Flow From Opps (Acct.) -24,035 2,871 21,199 13,352 -14,325
Cash Flows From Investing
Capex -6,900 0 0 0 0
Net Cash Used by Ops/Investments -30,935 2,871 21,199 13,352 -14,325
Cash Flows from Financing
Equity Issues 0 0 0 0 0
Dividends 0 0 0 0 0
Debt Issues 30,935 -2,871 -21,199 -6,865 7,838
Net Cash Flows from Financing 30,935 -2,871 -21,199 -6,865 7,838
Net Decrease in Cash and Cash Equiv. 0 0 0 6,487 -6,487
Beginning Cash Balance 23,000 23,000 23,000 23,000 29,487
Ending Cash Balance 23,000 23,000 23,000 29,487 23,000
Month Sales Forecast
__________________________________________________($000)_____________
October 2017 $1,000
November 1,500
December 3,000
____________________________________________________________________
Chapter 6: Managing Cash Flow
100
B. Prepare monthly pro forma balance sheets at the end of October, November, and
December, 2017.
Balance Sheets Sept. 2017 Oct. Nov. Dec.
Required Cash 50.0 80.0 80.0 80.0
Surplus Cash 0.0 0.0 0.0 0.0
Accounts Receivable 700.0 1000.0 1500.0 3000.0
Inventories 500.0 500.0 500.0 500.0
Current Assets 1250.0 1580.0 2080.0 3580.0
Fixed Assets, Net 750.0 740.0 730.0 720.0
Total Assets 2000.0 2320.0 2810.0 4300.0
Accounts Payable 0.0 0.0 0.0 0.0
Notes Payable 800.0 800.0 800.0 800.0
New Bank Loans (total amounts) 0.0 255.2 642.9 1916.0
Current Liabilities 800.0 1055.2 1442.9 2716.0
Long-Term Debt 400.0 400.0 400.0 400.0
Equity 800.0 864.8 967.1 1184.0
Total Liab. & Equity 2000.0 2320.0 2810.0 4300.0
C. Prepare both a monthly cash budget and pro forma statements of cash flows for October,
November, and December 2017.
Cash Budget Sept. 2017 Oct. Nov. Dec.
Collection of Receivables 700.0 1000.0 1500.0
Purchases –800.0 -1200.0 -2400.0
Other Cash Costs (7% of Sales) –70.0 –105.0 –210.0
Payment of Interest –12.0 -14.6 –18.4
Payment of Taxes –43.2 -68.2 -144.6
Investment in Fixed Assets 0.0 0.0 0.0
Net Monthly Cash Flow -225.2 -387.7 –1273.1
Beginning Cash 50.0 80.0 80.0
Less: Target Cash Amount 80.0 80.0 80.0
Ending Cash Before Borrowing -255.2 -387.7 –1273.1
Chapter 6: Managing Cash Flow
101
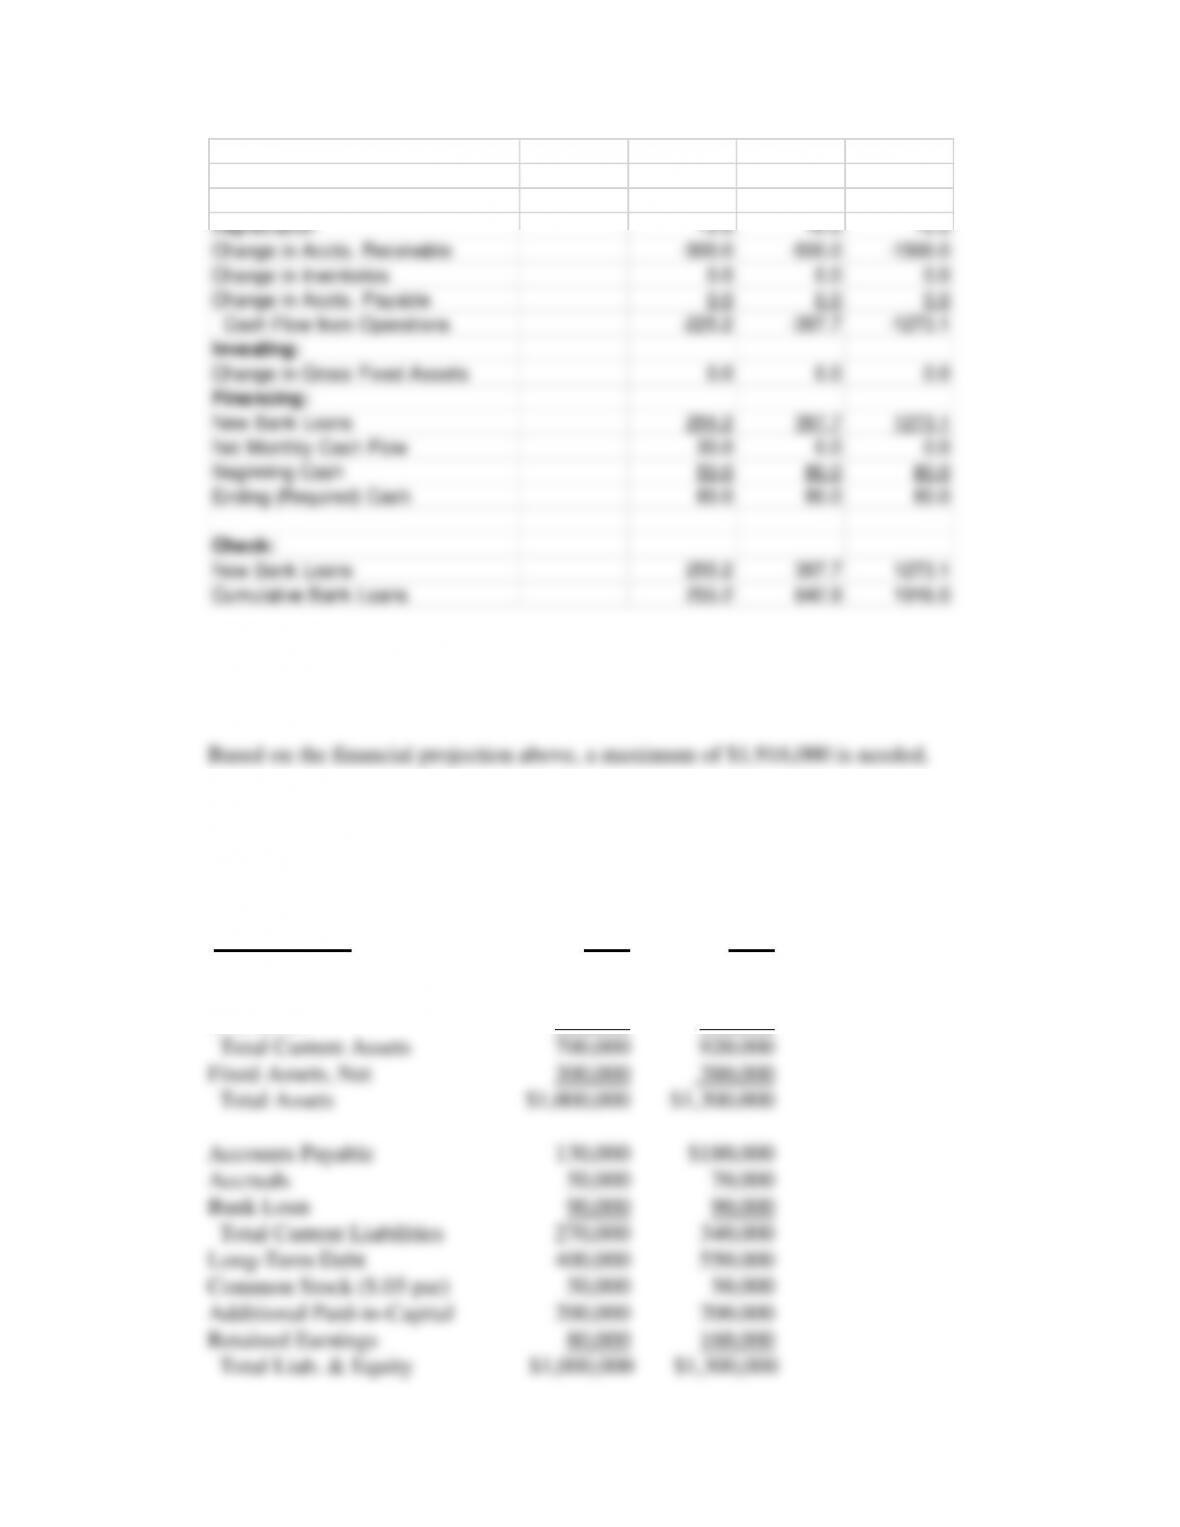
Statement of Cash Flows Sept. 2017 Oct. Nov. Dec.
Operating:
Net Income 64.8 102.3 216.9
Depreciation 10.0 10.0 10.0
Change in Accts. Receivable –300.0 -500.0 –1500.0
Change in Inventories 0.0 0.0 0.0
Change in Accts. Payable 0.0 0.0 0.0
Cash Flow from Operations –225.2 -387.7 –1273.1
Investing:
Change in Gross Fixed Assets 0.0 0.0 0.0
Financing:
New Bank Loans 255.2 387.7 1273.1
Net Monthly Cash Flow 30.0 0.0 0.0
Beginning Cash 50.0 80.0 80.0
Ending (Required) Cash 80.0 80.0 80.0
Check:
New Bank Loans 255.2 387.7 1273.1
Cumulative Bank Loans 255.2 642.9 1916.0
D. Describe your findings and indicate the maximum amount of bank borrowing that is
needed.
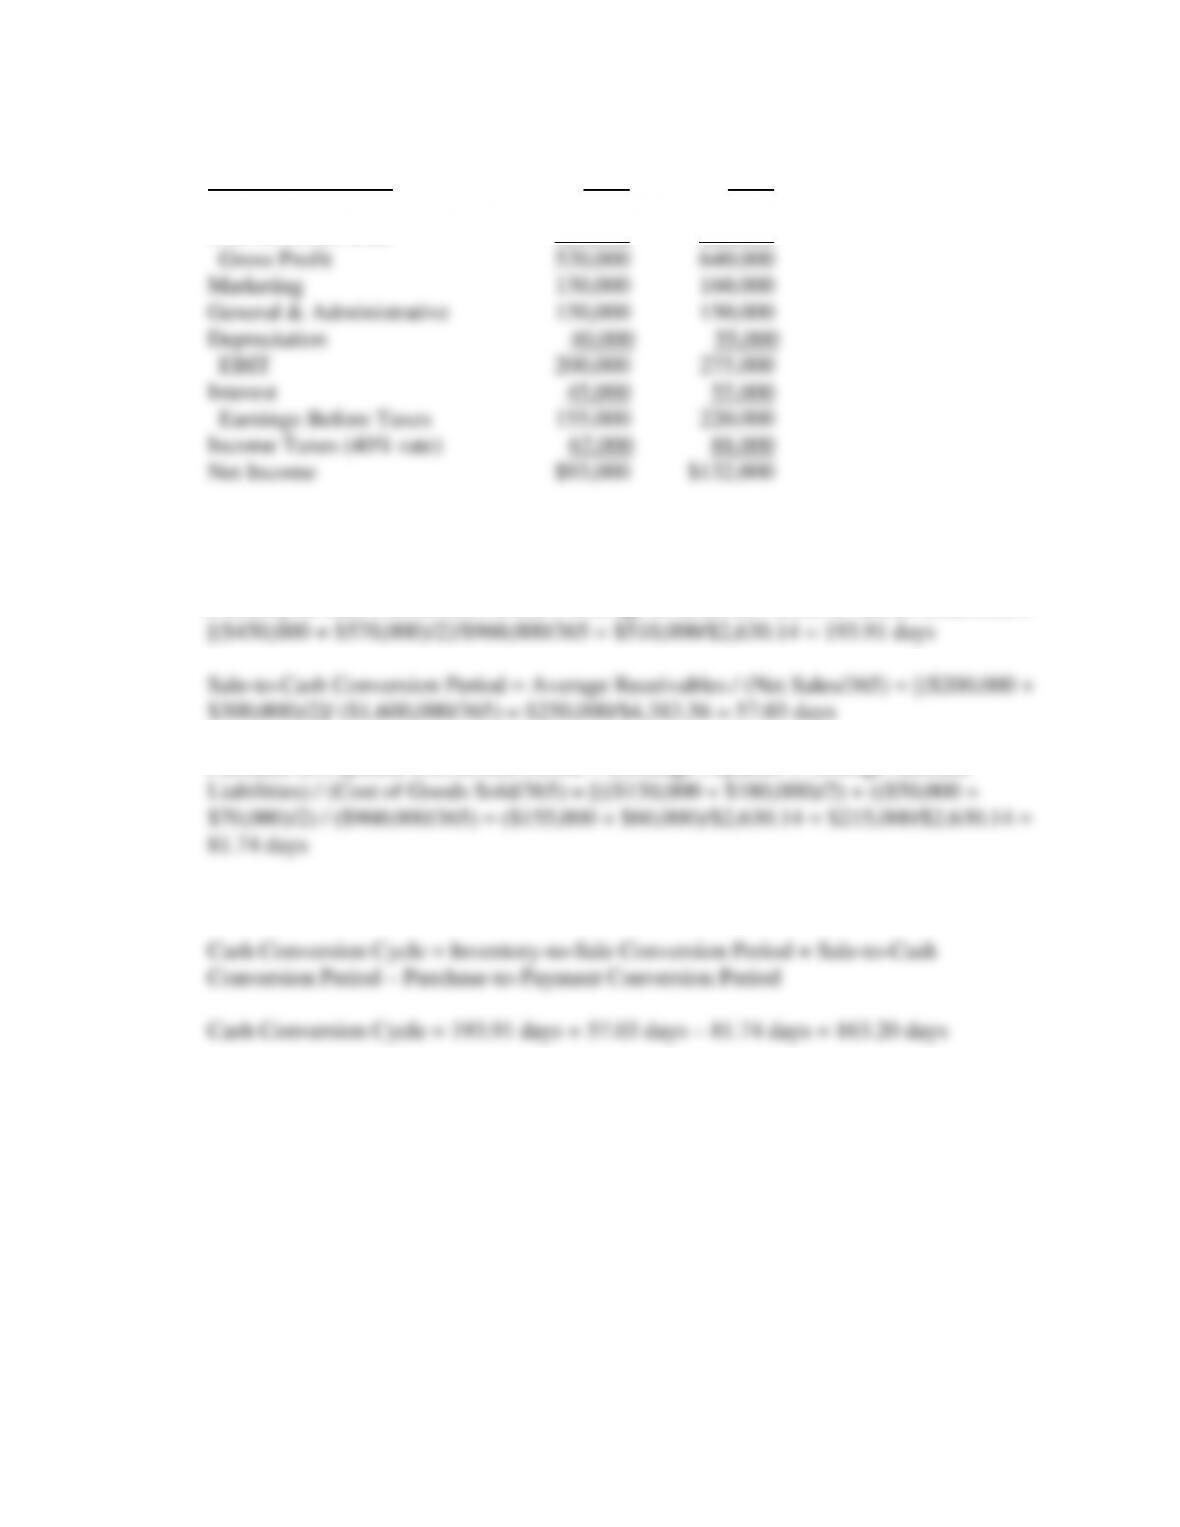
8. Cash Conversion Cycle] Two years of financial statement data for the Munich Export
Corporation are shown below.
MUNICH EXPORTS CORPORATION
Balance Sheet 2015 2016
Cash $50,000 $50,000
Accounts Receivables 200,000 300,000
Inventories 450,000 570,000
Chapter 6: Managing Cash Flow
102
Income Statement 2015 2016
Net Sales $1,300,000 $1,600,000
Cost of Goods Sold 780,000 960,000
A. Calculate the inventory-to-sale, sale-to-cash, and purchase-to-payment conversion
periods for Munich Exports for 2016.
Inventory-to-Sale Conversion Period = Average Inventories / (Cost of Goods Sold/365) =
Purchase-to-Payment Conversion Period = (Average Payables + Average Accrued
B. Calculate the length of Munich Exports’ cash conversion cycle for 2016.
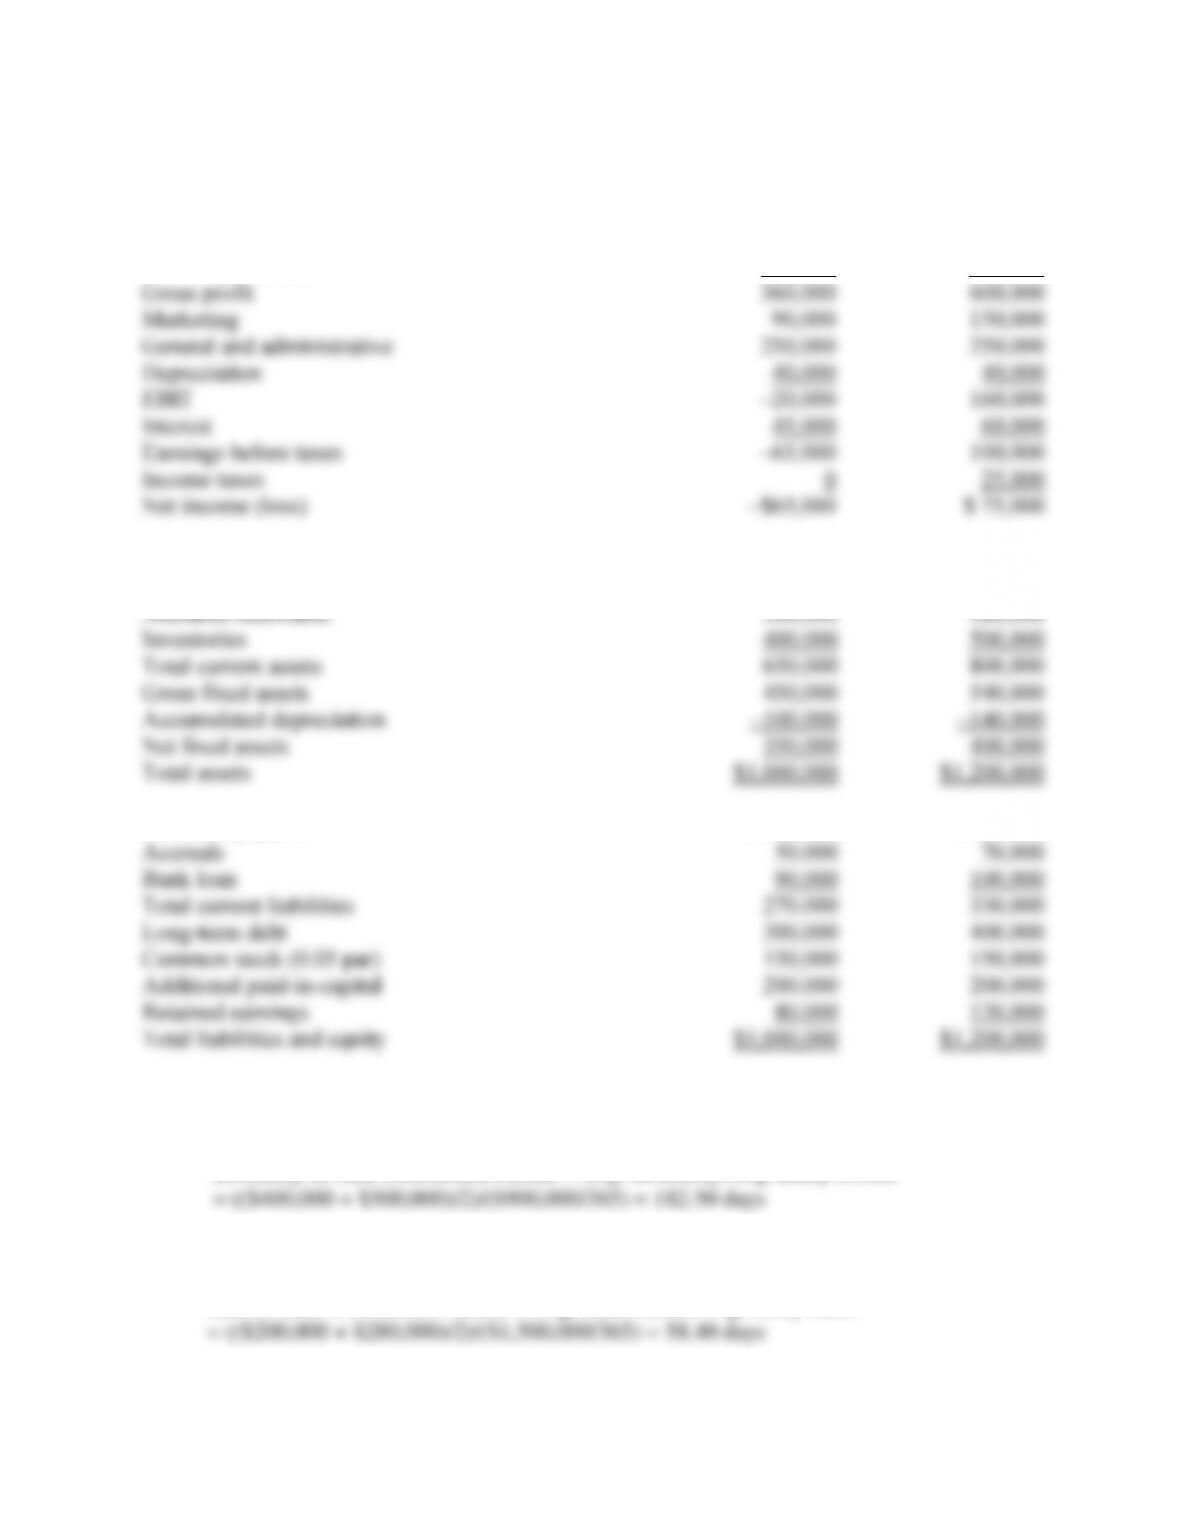
9. [Cash Conversion Cycle] Castillo Products Company improved its operations from a net loss
in 2015 to a net profit in 2016. While the founders, Cindy and Rob Castillo, are happy about
these developments, they are concerned with trying to understand how long the firm takes to
complete its cash conversion cycle in 2016. Use the following financial statements to make
your calculations. Balance sheet items should reflect the averages of the 2015 and 2016
accounts.
Chapter 6: Managing Cash Flow
103
CASTILLO PRODUCTS COMPANY
INCOME STATEMENT
2015
2016
Net sales
$900,000
$1,500,000
Cost of goods sold
540,000
900,000
Gross profit
360,000
600,000
Marketing
90,000
150,000
General and administrative
250,000
250,000
Depreciation
40,000
40,000
EBIT
–20,000
160,000
Interest
45,000
60,000
Earnings before taxes
–65,000
100,000
Income taxes
0
25,000
Net income (loss)
–$65,000
$ 75,000
BALANCE SHEET
2015
2016
Cash
$ 50,000
$ 20,000
Accounts receivable
200,000
280,000
Inventories
400,000
500,000
Total current assets
650,000
800,000
Gross fixed assets
450,000
540,000
Accumulated depreciation
–100,000
–140,000
Net fixed assets
350,000
400,000
Total assets
$1,000,000
$1,200,000
Accounts payable
$ 130,000
$160,000
Accruals
50,000
70,000
Bank loan
90,000
100,000
Total current liabilities
270,000
330,000
Long-term debt
300,000
400,000
Common stock (0.05 par)
150,000
150,000
Additional paid-in-capital
200,000
200,000
Retained earnings
80,000
120,000
Total liabilities and equity
$1,000,000
$1,200,000
A. Calculate the inventory-to-sale conversion period for 2016.
Inventory-to-Sale Conversion Period = Avg. Inventory/Avg. Daily COGS
B. Calculate the sale-to-cash conversion period for 2016.
Sale-to-Cash Conversion Period = Avg. Receivables/Avg. Daily Sales