Chapter 5: Evaluating Operating and Financial Performance
83
Balance Sheet 2015 2016
Accounts Payable $130,000 $160,000
A. Use year-end data to calculate the current ratio, the quick ratio, and the net working
capital (NWC) to total assets ratio for 2015 and 2016 for the Castillo Company. What
changes occurred?
Current Ratio = Current Asset/Current Liabilities
Quick Ratio = (CA – Inventories)/CL
NWC to Total Assets Ratio = (CA – CL)/Assets
B. Use Castillo’s complete income statement data and the changes in balance sheet items
between 2015 and 2016 to determine the firm’s cash build and cash burn for 2016. Did
Castillo have a net cash build or net cash burn for 2016?
Chapter 5: Evaluating Operating and Financial Performance
84
Cash Build = Sales – Change in Accounts Receivable
Cash Burn = Inventory-Related Purchases + Administrative Expenses + Marketing
Expenses + Interest Expense – (Change in Accrued Liabilities +
Change in Payables) + Capital Investments + Taxes
Net Cash Burn or Build = Cash Build – Cash Burn
= -$105,000 = $105,000 Cash Burn
C. Convert the annual cash build and cash burn amounts calculated in Part B to monthly
cash build and cash burn rates. Also indicate the amount of the net monthly cash build
or cash burn rate.
Chapter 5: Evaluating Operating and Financial Performance
85
2015 2016
Net sales 100.00% 100.00%
The decline in general and administrative expenses as a percentage of sales (i.e., the
spreading of fixed costs) was the major contributor to Castillo becoming profitable. The
decline in depreciation expenses and in interest expenses as percentages of sales also
contributed to the move to profitability. However, increased taxes on profits reduced some
of the profitability gains.
8. [ROE Component Ratios and Model] Refer to the financial statement data provided below for
Safety-First, Inc.
SAFETY-FIRST, INC.
Income Statements (in $ Thousands)
2015
2016
Net sales
3,750
4,500
Cost of goods sold
2,250
2,700
Gross profit
1,500
1,800
Operating expenses
670
860
Interest
30
40
Income before taxes
800
900
Income taxes
250
300
Net income
550
600
Balance Sheets (in $ Thousands)
2015
2016
Cash
400
150
Accounts receivable
500
800
Inventories
1,450
2,000
Total current assets
2,350
2,950
Gross fixed assets
2,000
2,800
Less accumulated depreciation
-950
-1,250
Chapter 5: Evaluating Operating and Financial Performance
86
Net fixed assets
1,050
1,550
Total assets
3,400
4,500
2015
2016
Accounts payable
300
400
Bank loan
150
250
Accrued liabilities
100
150
Total current liabilities
550
800
Long-term debt
150
150
Common stock
850
1,100
Retained earnings
1,850
2,450
Total liabilities and equity
3,400
4,500
A. Calculate the net profit margin, the sales-to-total-assets ratio, and the equity multiplier for
both 2015 and 2016 using year-end (rather than average) balance sheet data.
Net Profit Margin = Net Profit / Net Sales
Sales-to-Total Assets = Net Sales / Total Assets
Equity Multiplier = Total Assets / Common Equity
B. Use the results from Part A to calculate the venture’s return on equity in each year.
Return on Equity = Net Profit Margin x Asset Turnover x Equity Multiplier
C. Describe what happened in terms of the financial performance of the Safety-First, Inc.
between 2015 and 2016.
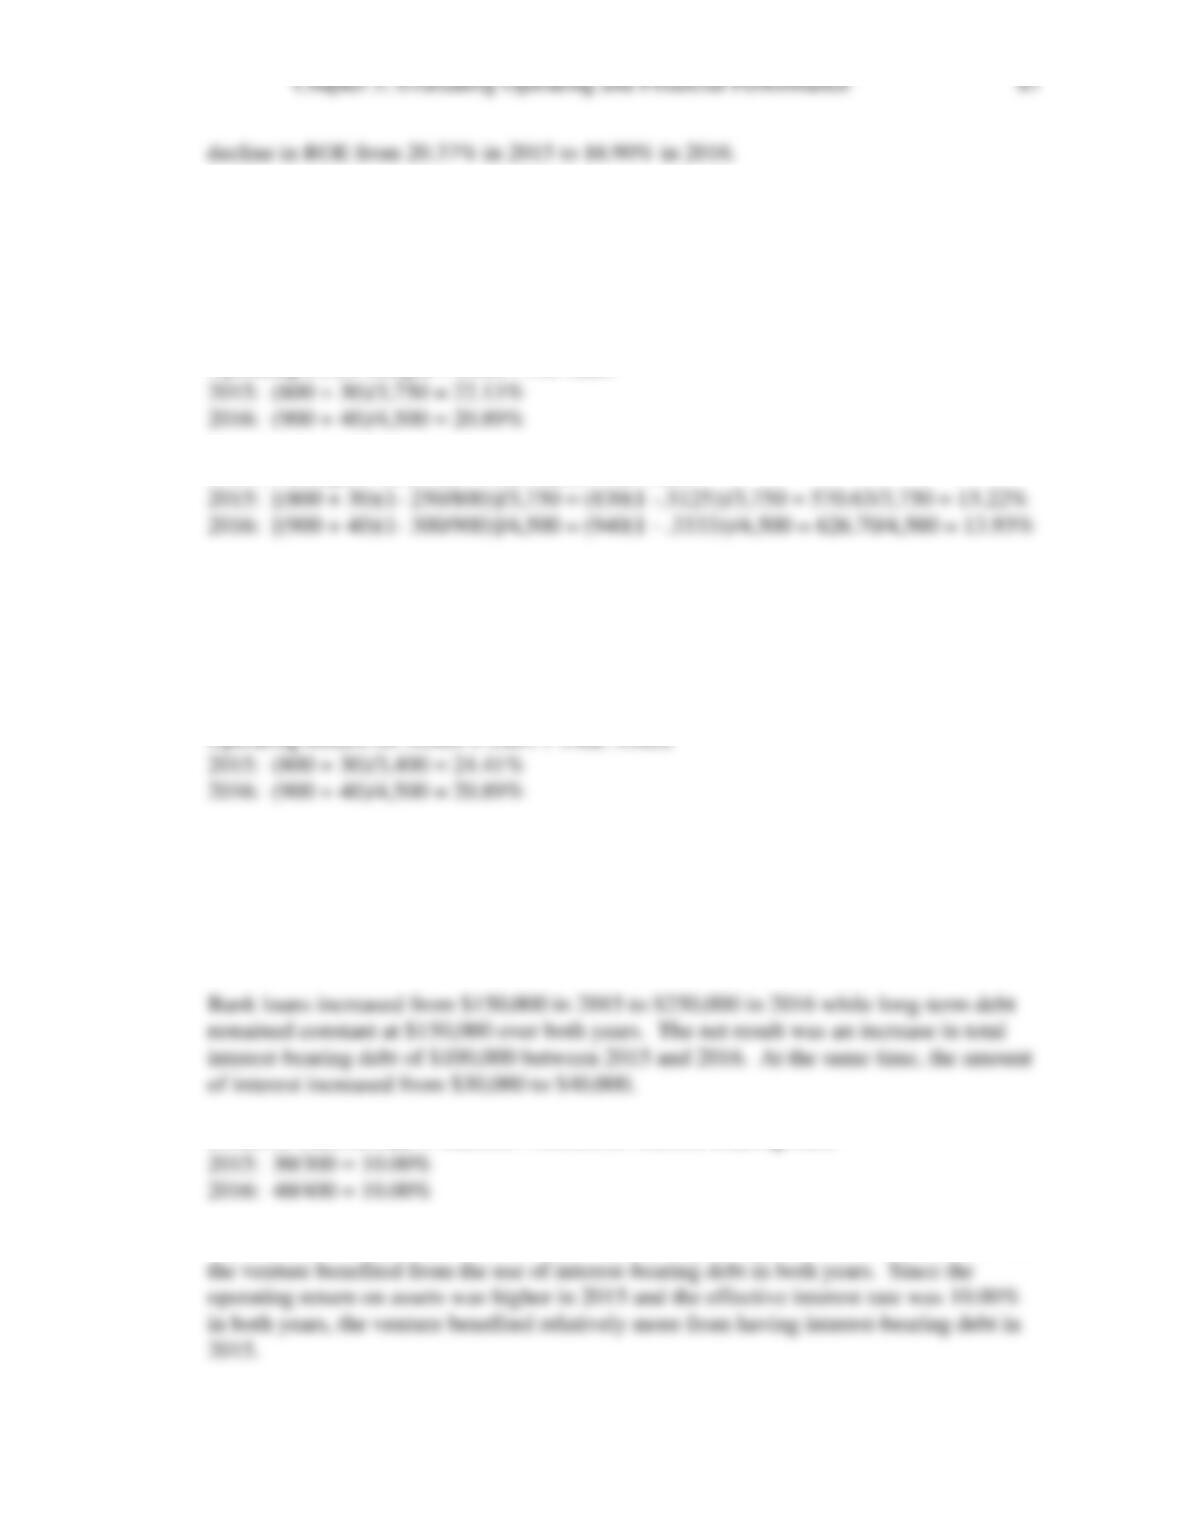
The net profit margin declined as did the asset turnover causing the return on assets
9. [Profitability Ratios] Make use of the financial statements data provided in Problem 8 for
Safety-First, Inc.
A. Calculate the operating profit margins and the NOPAT margins in 2015 and 2016 for
Safety-First, Inc. What changes occurred?
Operating Profit Margin = EBIT / Net Sales
NOPAT Margin = (EBIT(1 – Tax Rate)) / Net Sales
Both profit margin measures declined indicated less efficient control of expenses.
B. Calculate the operating return on assets (or the venture’s basic earning power) using
year-end balance sheet information for both 2015 and 2016. Describe what happened in
terms of operating return performance.
Operating Return on Assets = EBIT / Total Assets
The operating return on assets declined as did the operating profit margin calculated in
Part A.
C. Did the venture benefit from using interest-bearing debt in the form of bank loans and
long-term debt in 2015 and 2016?
Effective Interest Rate = Interest / Amount of Interest-Bearing Debt
Since the effective interest rate was lower than the operating return on assets (see Part B),

Chapter 5: Evaluating Operating and Financial Performance
88
MINI CASE: SCANDI HOME FURNISHINGS, INC.
Kaj Rasmussen founded Scandi Home Furnishings as a corporation during mid-2013. Sales
during the first full year (2014) of operation reached $1.3 million. Sales increased by 15 percent
in 2015 and another 20 percent in 2016. However, profits after increasing in 2015 over 2014 fell
sharply in 2016 causing Kaj to wonder what was happening to his “pride and joy” business
venture. After all, Kaj has continued to work as close as possible to a 24/7 pace beginning with
the startup of Scandi and through the first three full years of operation.
Scandi Home Furnishings, located in eastern North Carolina, designs, manufactures, and
sells Scandinavian-designed furniture and accessories to home furnishings retailers. The modern
Scandinavian design has a streamlined and uncluttered look. While this furniture style is
primarily associated with Denmark, both Norway and Sweden designers have contributed to the
allure of Scandinavian home furnishings. Some say that the inspiration for the Scandinavian
design can be traced to the “elegant curves” of art nouveau from which designers were able to
produce aesthetically pleasing, structurally strong modern furniture. Danish furnishings and the
home furnishings produced by the other Scandinavian countries—Sweden, Norway, and
Finland—are made using wood (primarily oak, maple, and ash), aluminum, steel, and high-grade
plastics.
Kaj grew up in Copenhagen, Denmark and received a college degree from a technical
university in Sweden. As is typically in Europe, Kaj began his business career as an apprentice
at a major home furnishings manufacturer in Copenhagen. After “learning the trade,” he quickly
moved into a management position in the firm. However, after a few years, Kaj realized that
what he really wanted to do was to start and operate his own Scandinavian home furnishings
business. At the same time, after traveling throughout the world including the U.S., he was sure
that he wanted to be an entrepreneur in the United States. Thus, while it was hard to give up the
Tivoli Gardens with its many entertainment and dining activities, as well as the other attractions
in Copenhagen, Kaj moved to the U.S. in early 2013. With $140,000 of his personal assets, and
$210,000 from venture investors, he began operations in mid-2013. Kaj, with a 40 percent
ownership interest and industry-related management expertise, was allowed to operate the
venture in a way that he thought was best for Scandi. Four years later, Kaj is sure he did the
right thing.
Following are the three years of income statements and balance sheets for the Scandi
Home Furnishings Corporation. Kaj has felt that in order to maintain a competitive advantage
that he would need to continue to expand sales. After first concentrating on selling Scandinavian
home furnishings in the northeast in 2014 and 2015, he decided to enter the west coast market.
An increase in expenses associated with identifying, contacting, and selling to home furnishings
retailers in California, Oregon, and Washington. Kaj Rasmussen was hoping that you could help
him better understand what has been happening to Scandi Home Furnishings both from operating
and financial standpoints.
SCANDI HOME FURNISHINGS, INC.
Income Statements
2014 2015 2016

Chapter 5: Evaluating Operating and Financial Performance
89
Net Sales $1,300,000 $1,500,000 $1,800,000
Cost of Goods Sold 780,000 900,000 1,260,000
Gross Profit 520,000 600,000 540,000
Marketing 130,000 150,000 200,000
General & Administrative 150,000 150,000 200,000
Depreciation 40,000 53,000 60,000
EBIT 200,000 247,000 80,000
Interest 45,000 57,000 70,000
Earnings Before Taxes 155,000 190,000 10,000
Income Taxes (40%) 62,000 76,000 4,000
Net Income $93,000 $114,000 $6,000
Cash Dividends $0 $74,000 $0
SCANDI HOME FURNISHINGS, INC.
Balance Sheets
2014 2015 2016
Cash $50,000 $40,000 $10,000
Accounts Receivables 200,000 260,000 360,000
Inventories 450,000 500,000 600,000
Total Current Assets 700,000 800,000 970,000
Fixed Assets, Net 300,000 400,000 500,000
Total Assets $1,000,000 $1,200,000 $1,470,000
Accounts Payable $130,000 $170,000 $180,000
Accruals 50,000 70,000 80,000
Bank Loan 90,000 90,000 184,000
Total Current Liabilities 270,000 330,000 444,000
Long-Term Debt 300,000 400,000 550,000
Common Stock ($10 par)* 300,000 300,000 300,000
Capital Surplus 50,000 50,000 50,000
Retained Earnings 80,000 120,000 126,000
Total Liab. & Equity $1,000,000 $1,200,000 $1,470,000
Note: 30,000 shares of common stock were issued to Kaj Rasmussen and the venture investors
when Scandi Home Furnishings was incorporated in mid-2013.
Part A
Your first challenge is to advise Kaj on what has been happening with Scandi Home Furnishings
from a liquidity perspective.
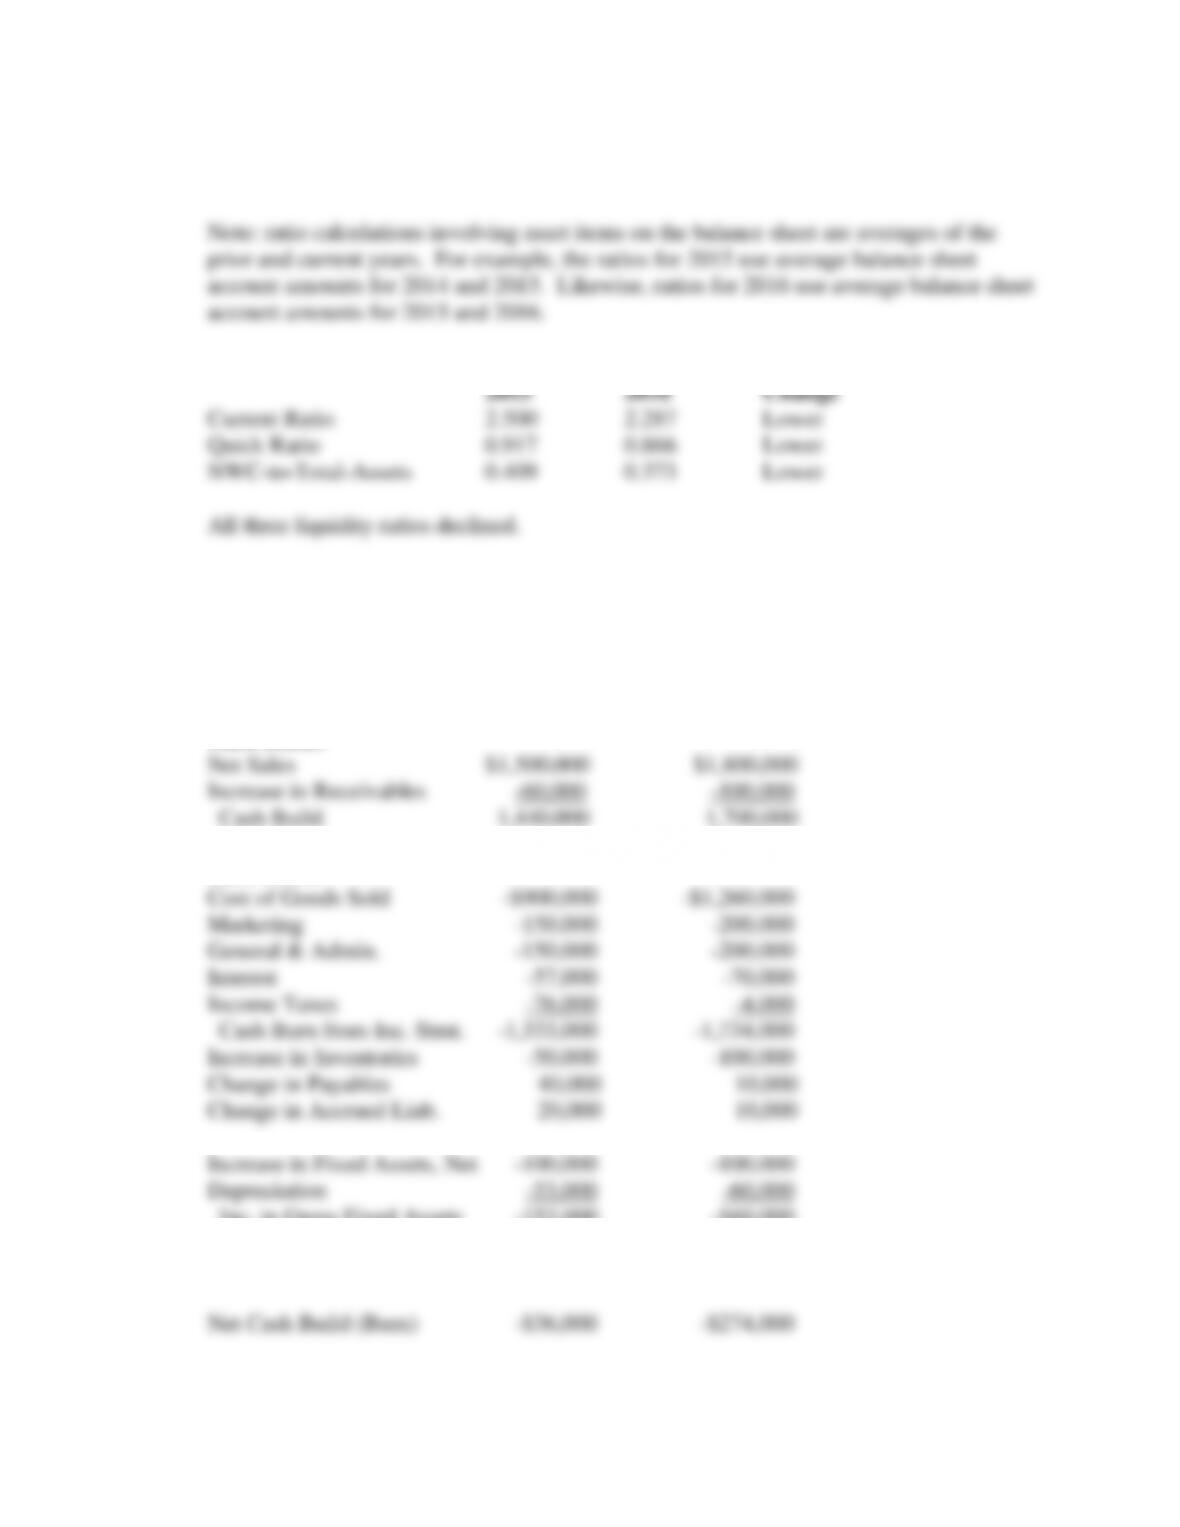
A. Kaj was particularly concerned by the drop in cash from $50,000 in 2014 to $10,000 in
2016. Calculate the average current ratio, the quick ratio, and the networking capital to
Chapter 5: Evaluating Operating and Financial Performance
90
total assets ratio for 2014-2015 and 2015-2016. What has happened to Scandi’s liquidity
position?
Liquidity Ratios:
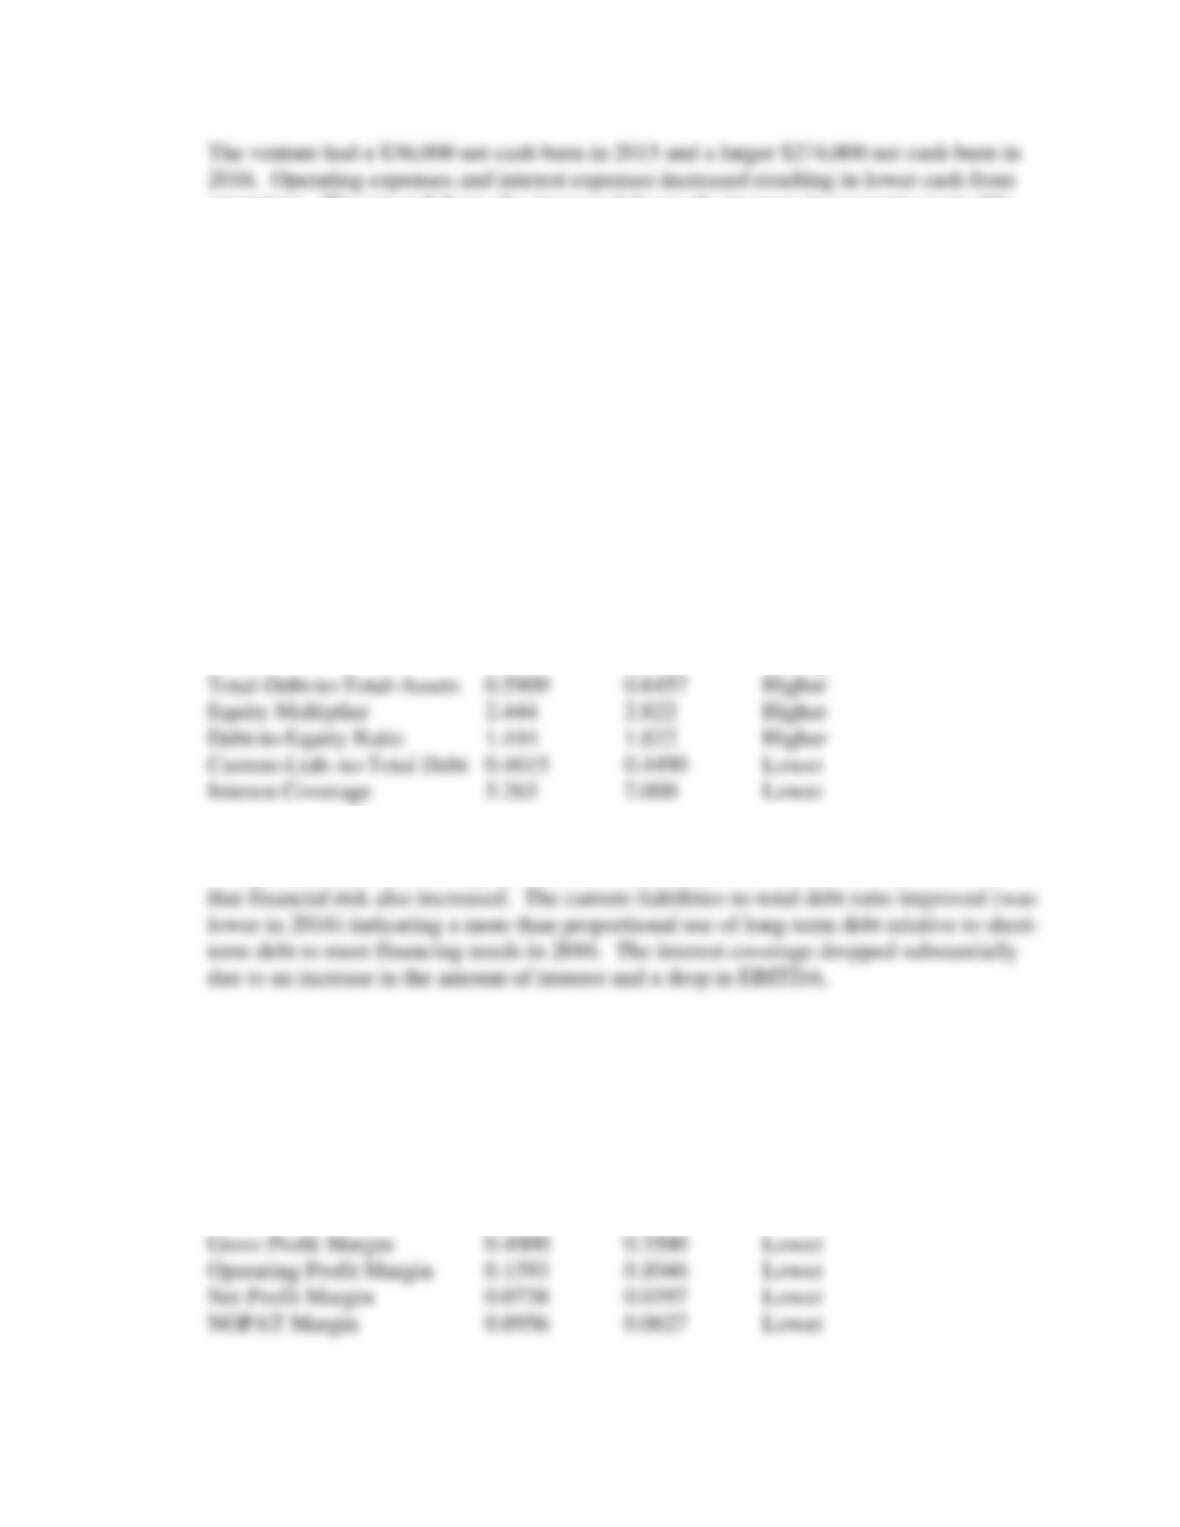
B. Kaj should be interested in knowing whether Scandi has been building or burning cash.
Compare the cash build, cash burn, and the net cash build/burn positions for 2015 and
2016. What, if any, changes have occurred?
Cash Build Versus Cash Burn:
2015 2016
Cash Build:
Cash Burn:
Inc. in Gross Fixed Assets -153,000 -160,000
Cash Burn -$1,476,000 -$1,974,000
Chapter 5: Evaluating Operating and Financial Performance
91
operations. The net cash burn also increased due to the increase in accounts receivable
and in inventories.
Part B
Your second challenge is to advise Kaj on what has been happening to Scandi from a financial
leverage, profitability, and efficiency perspective.
C. Creditors, as well as management, are also concerned about the ability of the venture to
meet its debt obligations as they come due, the proportion of current liabilities to total
debt, the availability of assets to meet debt obligations in the event of financial distress,
and the relative size of equity investments to debt levels. Calculate average ratios in each
of these areas for the 2014-2015 and 2015-2016 periods. Interpret your results and
explain what has happened to Scandi.
Financial Leverage:
2015 2016 Change
Financial leverage (as measured by the total-debt-to-total-assets ratio, the equity
multiplier, and the debt-to-equity ratio) increased in 2016 versus 2015. This indicates
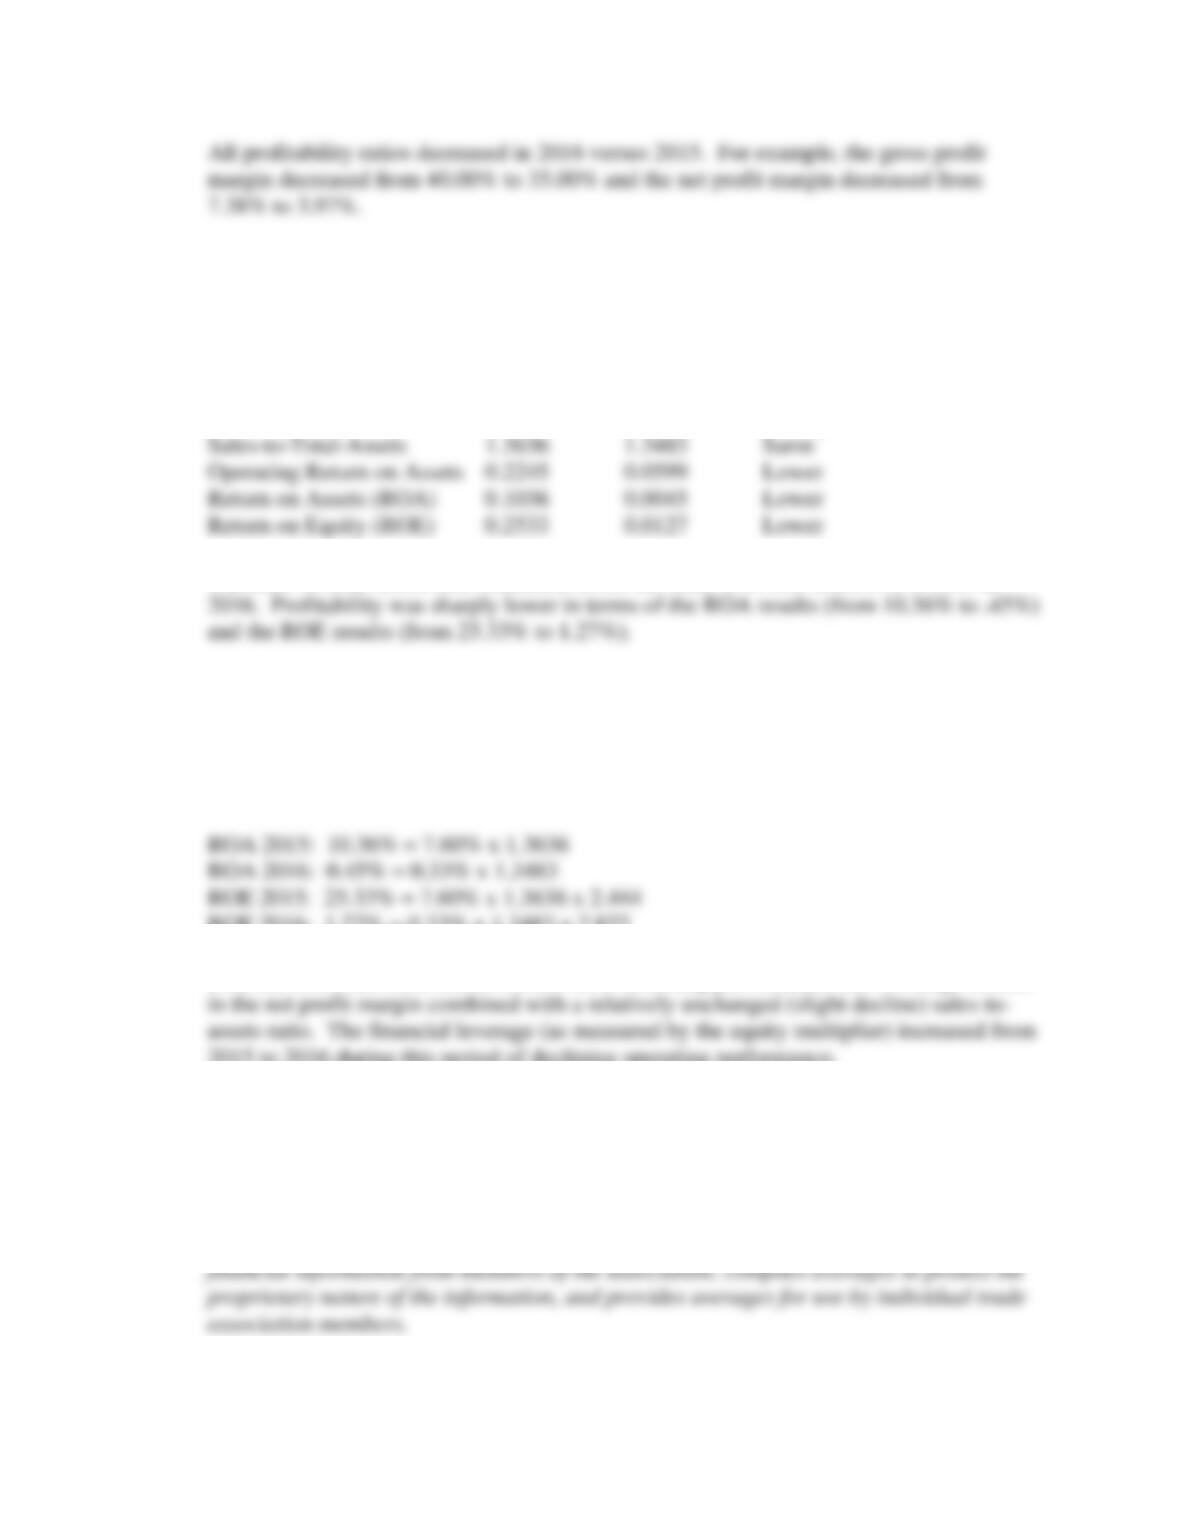
D. Of importance to Kaj and the venture investors is the efficiency of the operations of the
venture. Several profit margin ratios relating to the income statement are available to
help analyze Scandi’s performance. Calculate average profit margin ratios for 2014-
2015 and 2015-2016 and describe what is happening to the profitability of Scandi Home
Furnishings.
Profitability Ratios:
2015 2016 Change
Chapter 5: Evaluating Operating and Financial Performance
92
E. Kaj and the venture investors are also interested in how efficiently Scandi is able to
convert their equity investment, as well as the venture’s total assets, into sales. Calculate
several ratios that combine data from the income statements and balance sheets and
compare what has happened between the 2014-2015 and 2015-2016 periods.
Efficiency and Return Ratios:
2015 2016 Change
The sales-to-total-assets ratio remained about the same at 1.3636 in 2015 to 1.3483 in
F. A ROA model consisting of the product of two ratios provides an overview of a venture’s
efficiency and profitability at the same time. A ROE model consists of the product of
three ratios and simultaneously shows an overview of a venture’s efficiency, profitability,
and leverage performance. Calculate ROA and ROE models for the 2014-2015 and
2015-2016 periods. Provide an interpretation of your findings.
ROE 2016: 1.27% = 0.33% x 1.3483 x 2.822
Both the ROA and ROE model results show declining performance due to a large decline
2015 to 2016 during this period of declining operating performance.
Part C
Your third challenge is to advise Kaj on what has been happening to Scandi relative to financial
developments in the home furnishings industry.
G. Kaj has been able to obtain some industry ratio data from the home furnishings industry
trade association of which he is a member. The industry association collects proprietary
Chapter 5: Evaluating Operating and Financial Performance
93
Trade association data for the home furnishings industry shows an average net profit
margin of 6.5 percent, a sales-to-assets ratio of 1.3 times, and a total-debt-to-total-assets
ratio of 55 percent over the 2014-2015 and 2015-2016 time periods. Compare and
contrast Scandi’s results with the industry average in terms of the ROA and ROE models.
Make sure you compare the components of each model as well as the product of the
components.
From Part G:
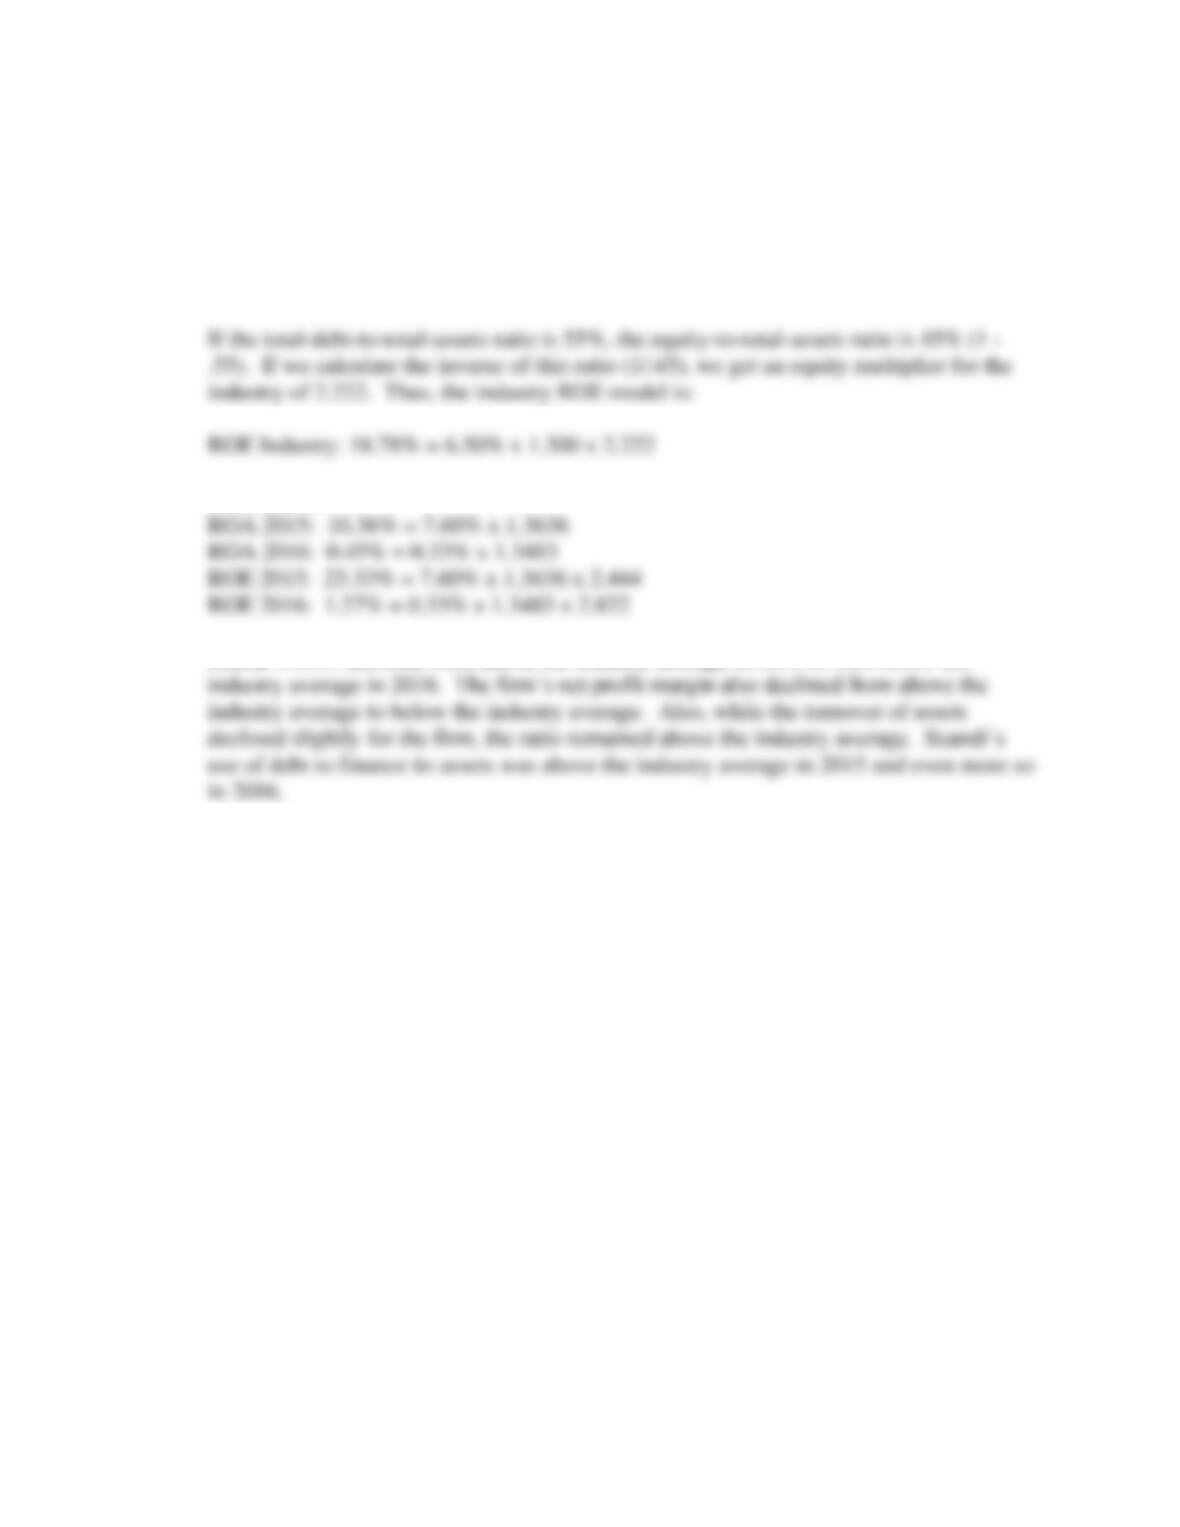
Scandi’s ROE declined from above the industry average in 2015 to well below the