71
Chapter 5
EVALUATING OPERATING AND FINANCIAL PERFORMANCE
FOCUS
In this chapter, we focus on identifying and understanding the financial ratios used to evaluate the
venture’s financial performance over time. Venture performance and efficiency is important to a variety
of constituencies including lenders and creditors, equity investors, and the entrepreneur. Lenders and
creditors want to be repaid in full and on time; investors want a sufficient return on their investments as
compensation for the risks they are taking; the entrepreneur initially wants to survive and then build value
in the venture.
LEARNING OBJECTIVES
1. Understand important financial performance measures and their users by life cycle stage.
2. Describe how financial ratios are used to monitor a venture’s performance.
3. Identify specific cash burn rate measures and liquidity ratios and explain how they are calculated and
used by the entrepreneur.
4. Identify specific leverage ratios and explain their usage by lenders and creditors
5. Identify and describe measures of profitability and efficiency that are important to the entrepreneur
and equity investors.
6. Describe limitations when using financial ratios.
CHAPTER OUTLINE
5.1 USERS OF FINANCIAL PERFORMANCE MEASURES BY LIFE CYCLE STAGE
5.2 USING FINANCIAL RATIOS
5.3 CASH BURN RATES AND LIQUIDITY RATIOS
A. Measuring Venture Cash Burn and Build Amounts and Rates
B. Beyond Burn: Traditional Measures of Liquidity
C. Interpreting Cash-Related and Liquidity-Related Trends
5.4 LEVERAGE RATIOS
A. Measuring Financial Leverage
B. Interpreting Changes in Financial Leverage
5.5 PROFITABILITY AND EFFICIENCY RATIOS
A. Income Statement Measures of Profitability
B. Efficiency and Return Measures
C. Interpreting Changes in Profitability and Efficiency
5.6 INDUSTRY COMPARABLE RATIO ANALYSIS
5.7 A HITCHHIKER’S GUIDE TO FINANCIAL ANALYSIS
SUMMARY
DISCUSSION QUESTIONS AND ANSWERS
1. Identify the types of financing typically used during each life cycle stage of the successful
entrepreneurial venture.
Chapter 5: Evaluating Operating and Financial Performance
72
Refer to Figure 5.1.
Development and Startup Stages:
Type of Financing:
2. Describe the types of financial ratios and other financial performance measures that are used during
a venture’s successful life cycle. Who are the users of financial performance measures?
Refer to Figure 5.1.
Development and Startup Stages:
Financial Ratios and Measures:
Survival Stage:
Rapid-Growth Stage:
3. What are financial ratios and why are they useful?
4. What are the three types of comparisons that can be made when conducting ratio analyses?
5. What are the meanings of the terms “cash build” and “cash burn”? How do we calculate net cash
burn rates?
6. How is the current ratio calculated and what does it measure? How does the quick ratio differ from
the current ratio?
7. Describe how a firm’s net working capital (NWC) is measured and how the NWC-to-total- assets
ratio is calculated. What does this ratio measure?
8. What is the meaning of leverage ratios? What are typical ratios used for relating total debt to a
venture’s assets and/or its equity?
9. What is the importance of the relationship between a venture’s current liabilities and its total debt?
10. Describe the two types of “coverage” ratios that are typically calculated when trying to assess a
venture’s ability to meet its interest payments and other financing-related obligations?
The two types of coverage ratios used are the interest coverage ratio and the fixed charges coverage
Chapter 5: Evaluating Operating and Financial Performance
75
INTERNET ACTIVITIES
1. Go to the Hoovers business online Web site at http://www.hoovers.com and click on
“Companies A-Z.” Identify a firm such as Google, Inc. (ticker symbol: GOOG) or
Applebee’s International, Inc. (ticker symbol: APPB).
A. Obtain the most recent three years of income statements and balance sheets. Analyze the
changes in operating and financial performance, if any, by applying the ratio analyses
covered in the chapter.
Web-researched results vary due to constant updating of the related web sits.
B. Identify the industry that the firm being studied resides in and the major competitors.
Obtain financial statement information for one or more competitors and conduct a ratios
analysis of each competitor analyzed.
Web-researched results vary due to constant updating of the related web sits.
EXERCISES/PROBLEMS AND ANSWERS
Note: for readers who were introduced to financial statements for the first time in Chapter 4, you
may want to first work the “Supplemental Exercises/Problems” presented at the end of Chapters
1, 2, and 3 which were intended for readers who had a previous understanding of financial
statements.
1. [ROA and ROE models and Ratio Components] The Salza Technology Corporation
successfully increased its “top line” sales from $375,000 in 2015 to $450,000 in 2016. Net
income also increased as did the venture’s total assets. You have been asked to compare the
financial performance between the two years.
SALZA TECHNOLOGY CORPORATION
ANNUAL INCOME STATEMENTS (IN $ THOUSANDS)
2015
2016
Net sales
$375
$450
Less: Cost of goods sold
-225
-270
Gross profit
150
180
Less: Operating expenses
-46
-46
Less: Depreciation
-25
-30
Less: Interest
-4
-4
Income before taxes
75
100
Less: Income taxes
-20
-30
Net income
$ 55
$70
Chapter 5: Evaluating Operating and Financial Performance
76
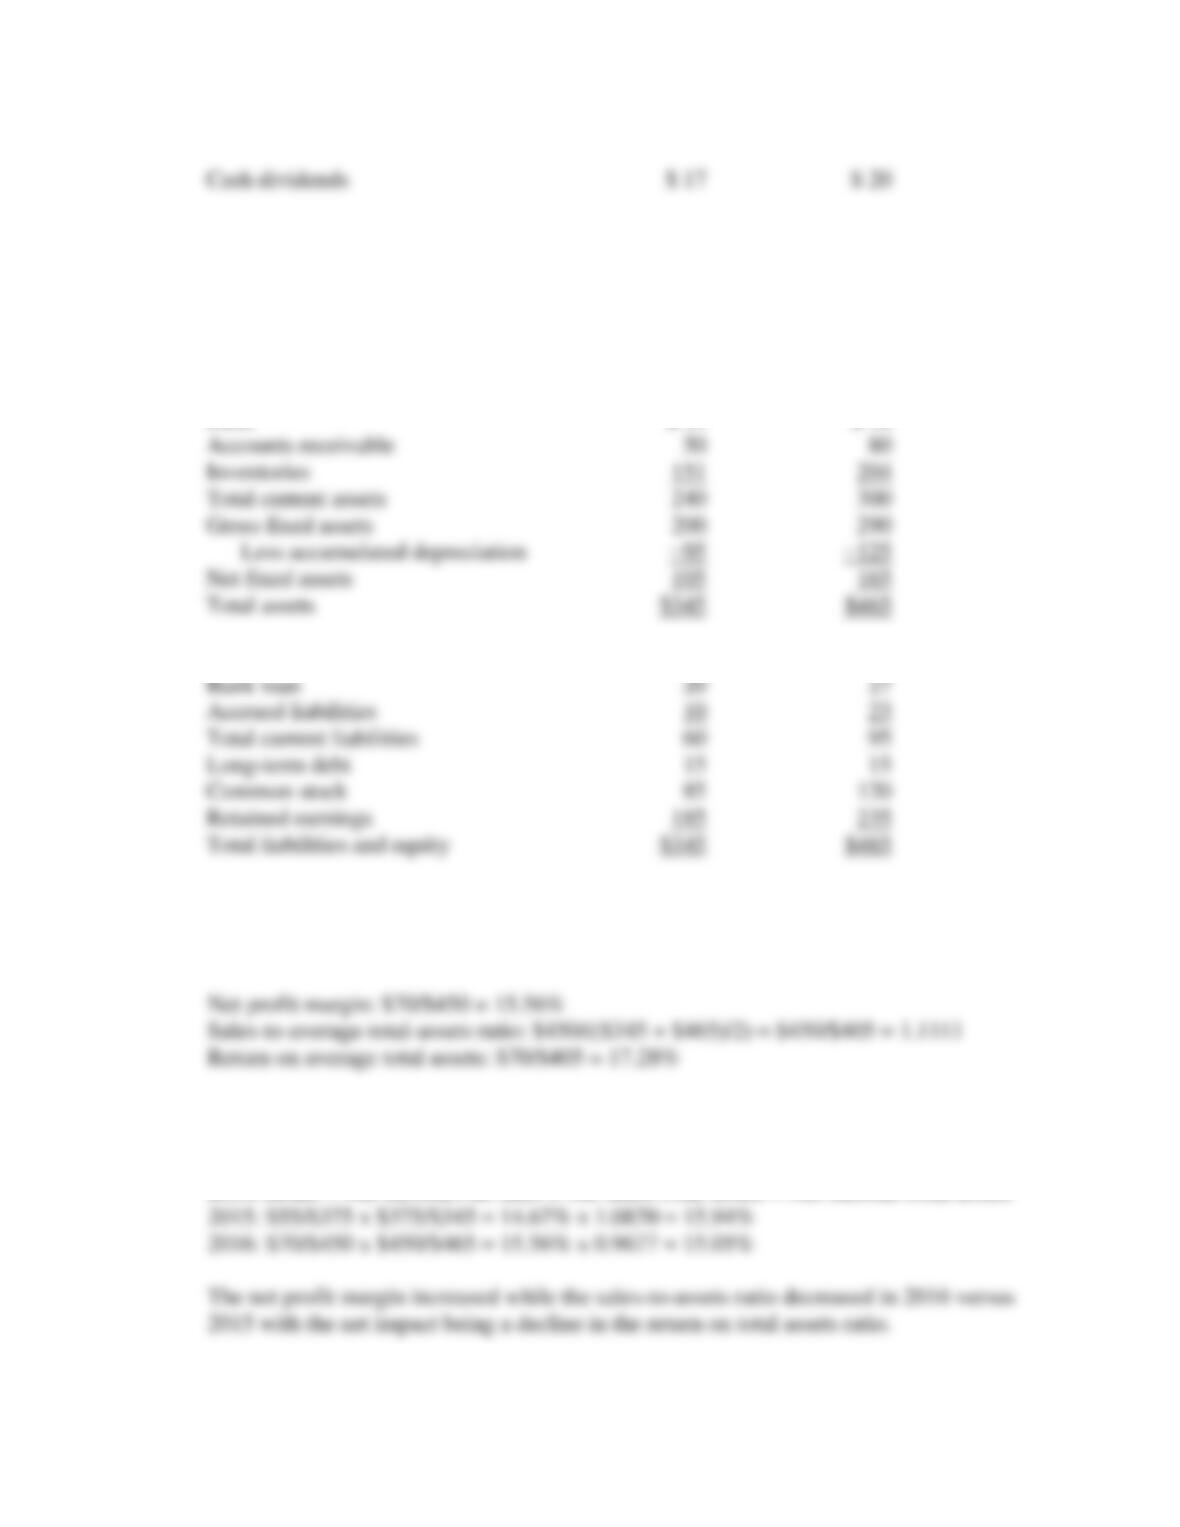
Cash dividends
$ 17
$ 20
BALANCE SHEETS AS OF DECEMBER 31 (IN $ THOUSANDS)
2015
2016
Cash
$ 39
$ 16
Accounts receivable
50
80
Inventories
151
204
Total current assets
240
300
Gross fixed assets
200
290
Less accumulated depreciation
−95
−125
Net fixed assets
105
165
Total assets
$345
$465
Accounts payable
$ 30
$ 45
Bank loan
20
27
Accrued liabilities
10
23
Total current liabilities
60
95
Long-term debt
15
15
Common stock
85
120
Retained earnings
185
235
Total liabilities and equity
$345
$465
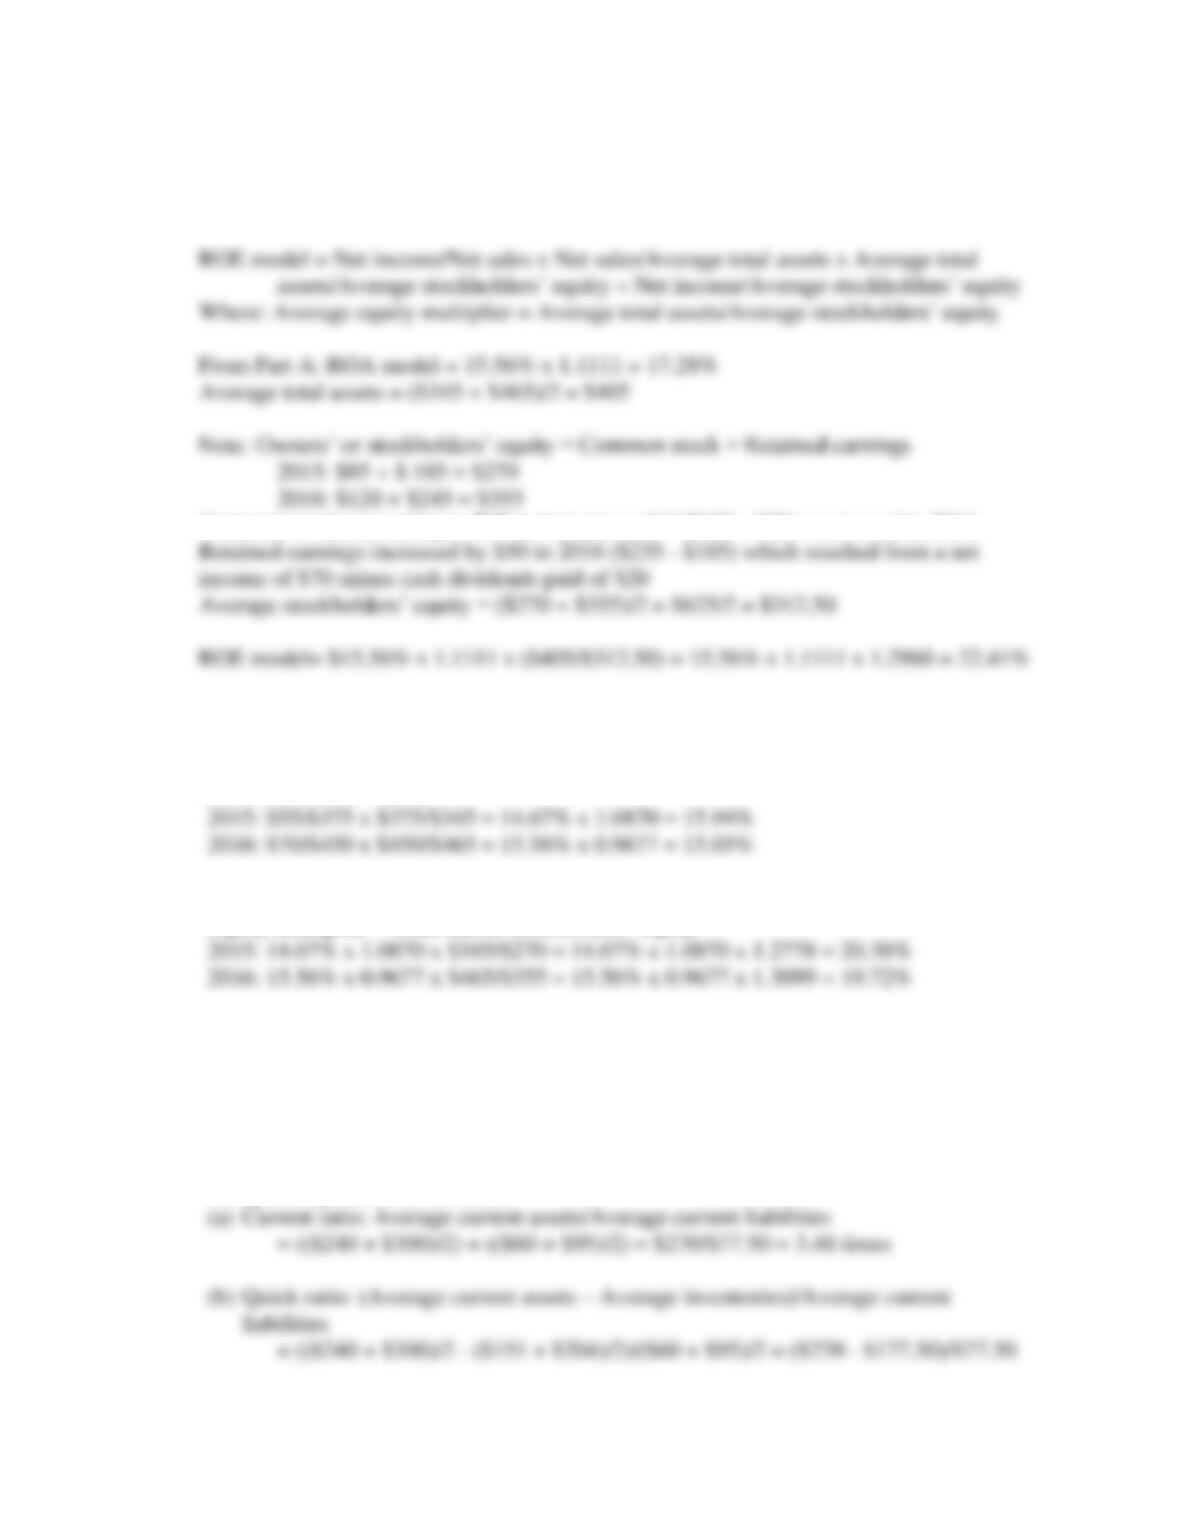
A. Calculate the net profit margin and the sales-to-total assets ratio for Salza for 2016 using
average total assets. Also calculate the return on total assets in 2016 using average total
assets.
B. Calculate the ratios in the ROA model for both 2015 and 2016 using year-end total assets.
Comment on any financial ratio differences.
ROA model = Net income/Net sales x Net sales/Total assets = Net income/Total assets
Chapter 5: Evaluating Operating and Financial Performance
77
C. Expand the 2016 ROA model discussed in Part A into an ROE model that includes
financial leverage as measured by the equity multiplier. Use average owners’ or
stockholders’ equity in your calculation.
Common stock amounting to $35 in “net proceeds” ($120 – $85) was issued in 2016
D. Expand the 2015 and 2016 ROA model calculations in Part B into ROE models based on
year-end owners’ or stockholders’ equity amounts.
ROA model from Part B:
ROE model:
Equity multiplier = Total assets/Stockholders’ equity
2. [Liquidity and Financial Leverage Ratios] Refer to the Salza Technology Corporation in
Problem 1.
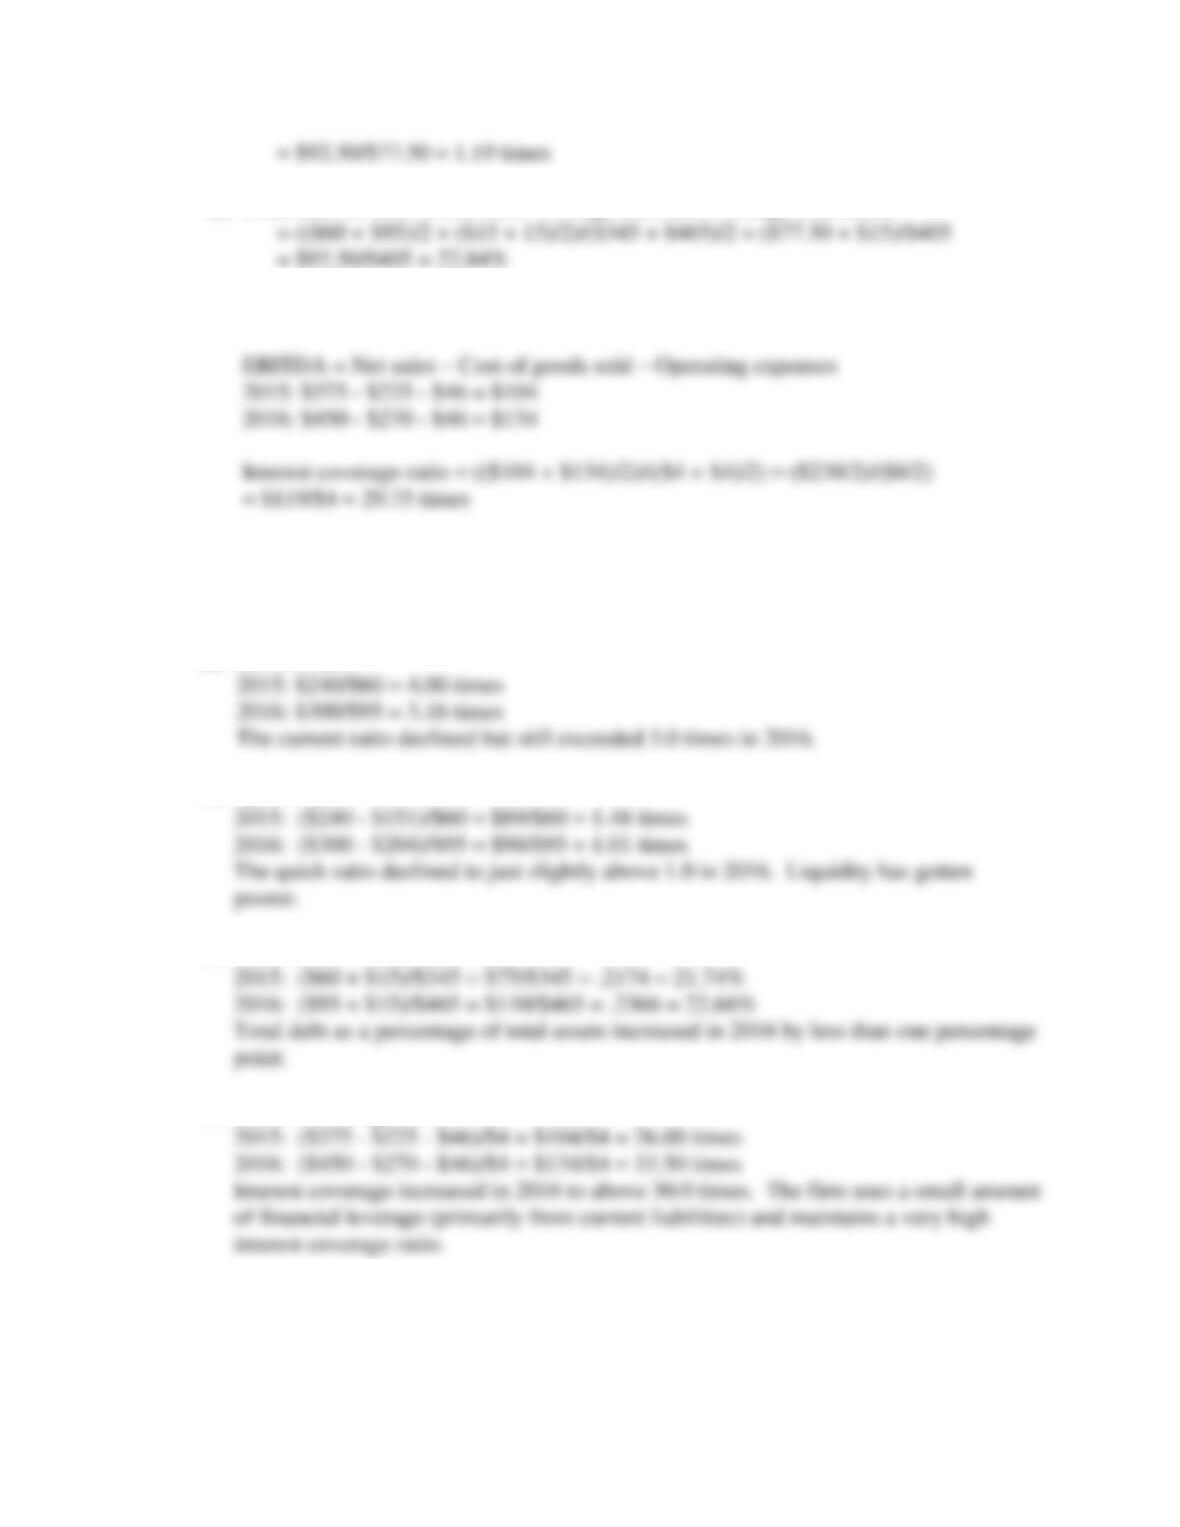
A. Using average balance sheet account data, calculate the (a) current ratio, (b) quick ratio,
(c) total-debt-to-total-assets ratio, and (d) the interest coverage ratio for 2016.
Using average account balances:
Chapter 5: Evaluating Operating and Financial Performance
78
(c) Total-debt-to-total-assets ratio: Average total debt/Average total assets
(d) Interest coverage ratio: Average EBITDA/Average interest
B. Repeat the ratio calculations requested in Part A separately for 2015 and 2016 using
year-end balance sheet account data. What changes, if any, have occurred in terms of
liquidity and financial leverage?
(a) Current ratio:
(b) Quick ratio:
(c) Total-debt-to-total-assets ratio:
(d) Interest coverage ratio:
3. [Financial Statements and Ratios] Bike-With-Us Corporation, a specialty bicycle parts
replacement venture, was started last year by two former professional bicycle riders who had
substantial competitive racing experience including competing in the Tour de France. The
Chapter 5: Evaluating Operating and Financial Performance
79
two entrepreneurs borrowed $50,000 from members of their families and each put up
$30,000 in equity capital. Retail space was rented and $60,000 was spent for fixtures and
store equipment. Following are the abbreviated income statement and balance sheet
information for the Bike-With-Us Corporation after one complete year of operation.
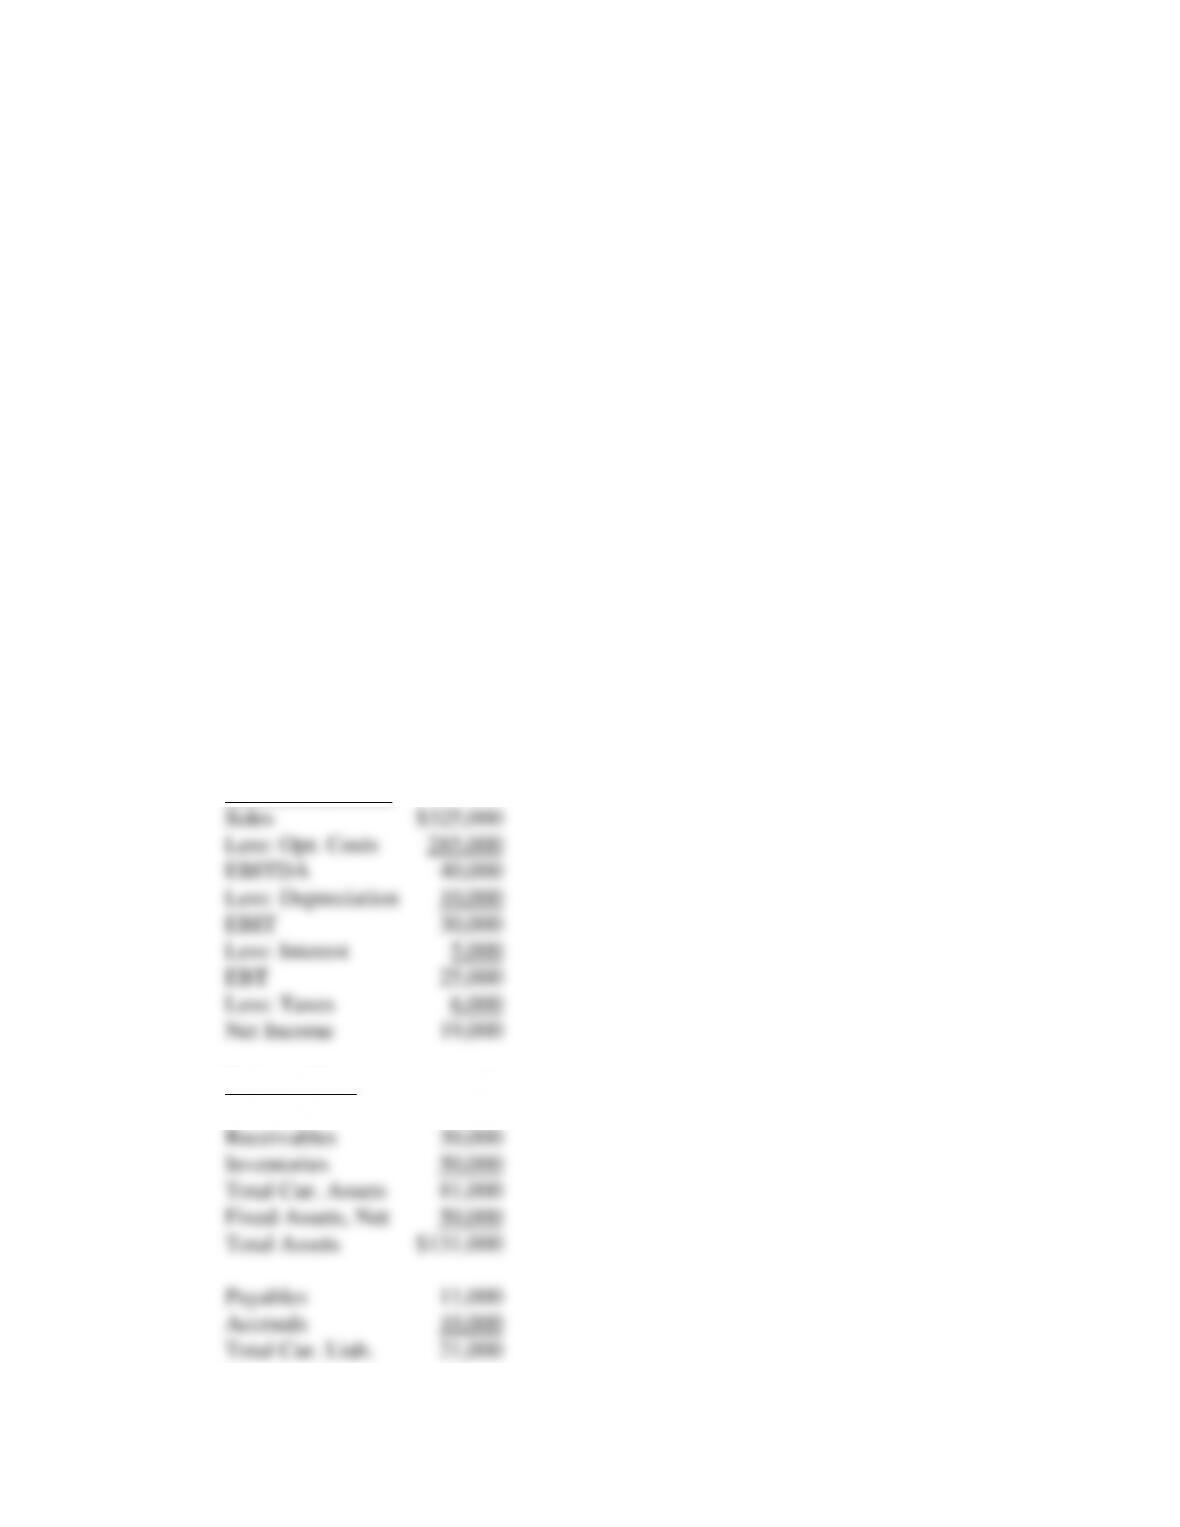
BIKE-WITH-US CORPORATION
Sales $325,000
Operating Costs 285,000
Depreciation 10,000
Interest 5,000
Taxes 6,000
Cash $1,000
Receivables 30,000
Inventories 50,000
Fixed Assets, Net 50,000
Payables 11,000
Accruals 10,000
Long-Term Loan 50,000
Common Equity 60,000
A. Prepare an income statement and a balance sheet for the Bike-With-Us Corporation
using only the information provided above.
Income Statement
Balance Sheet
Cash $1,000
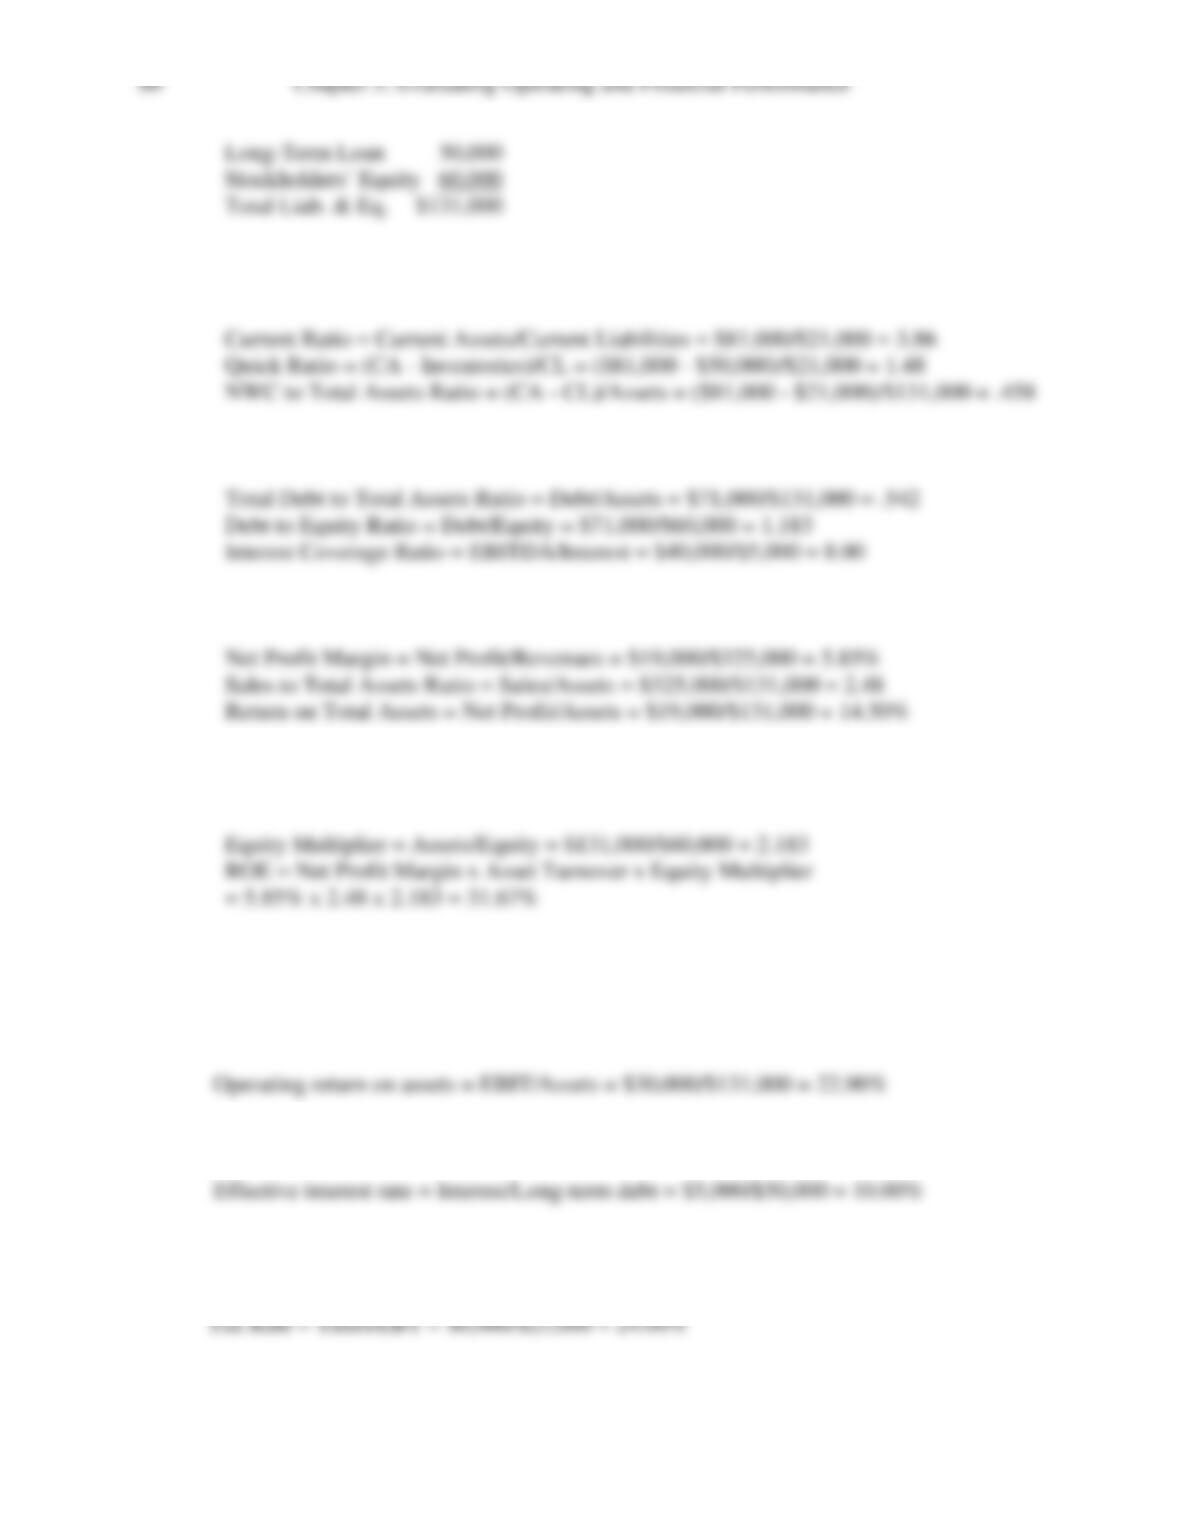
B. Calculate the current ratio, quick ratio, and NWC-to-total-assets ratio.
C. Calculate the total-debt-to-total-assets ratio, debt-to-equity ratio, and interest coverage
D. Calculate the net profit margin, sales-to-total-assets ratio, and the return on total assets.
E. Calculate the equity multiplier. Combine this calculation with the calculations in Part D
to show the ROE model with its three components.
4. [Financial Ratios] Use the financial statements data for the Bike-With-Us Corporation
provided in Problem 3 to make the following calculations.
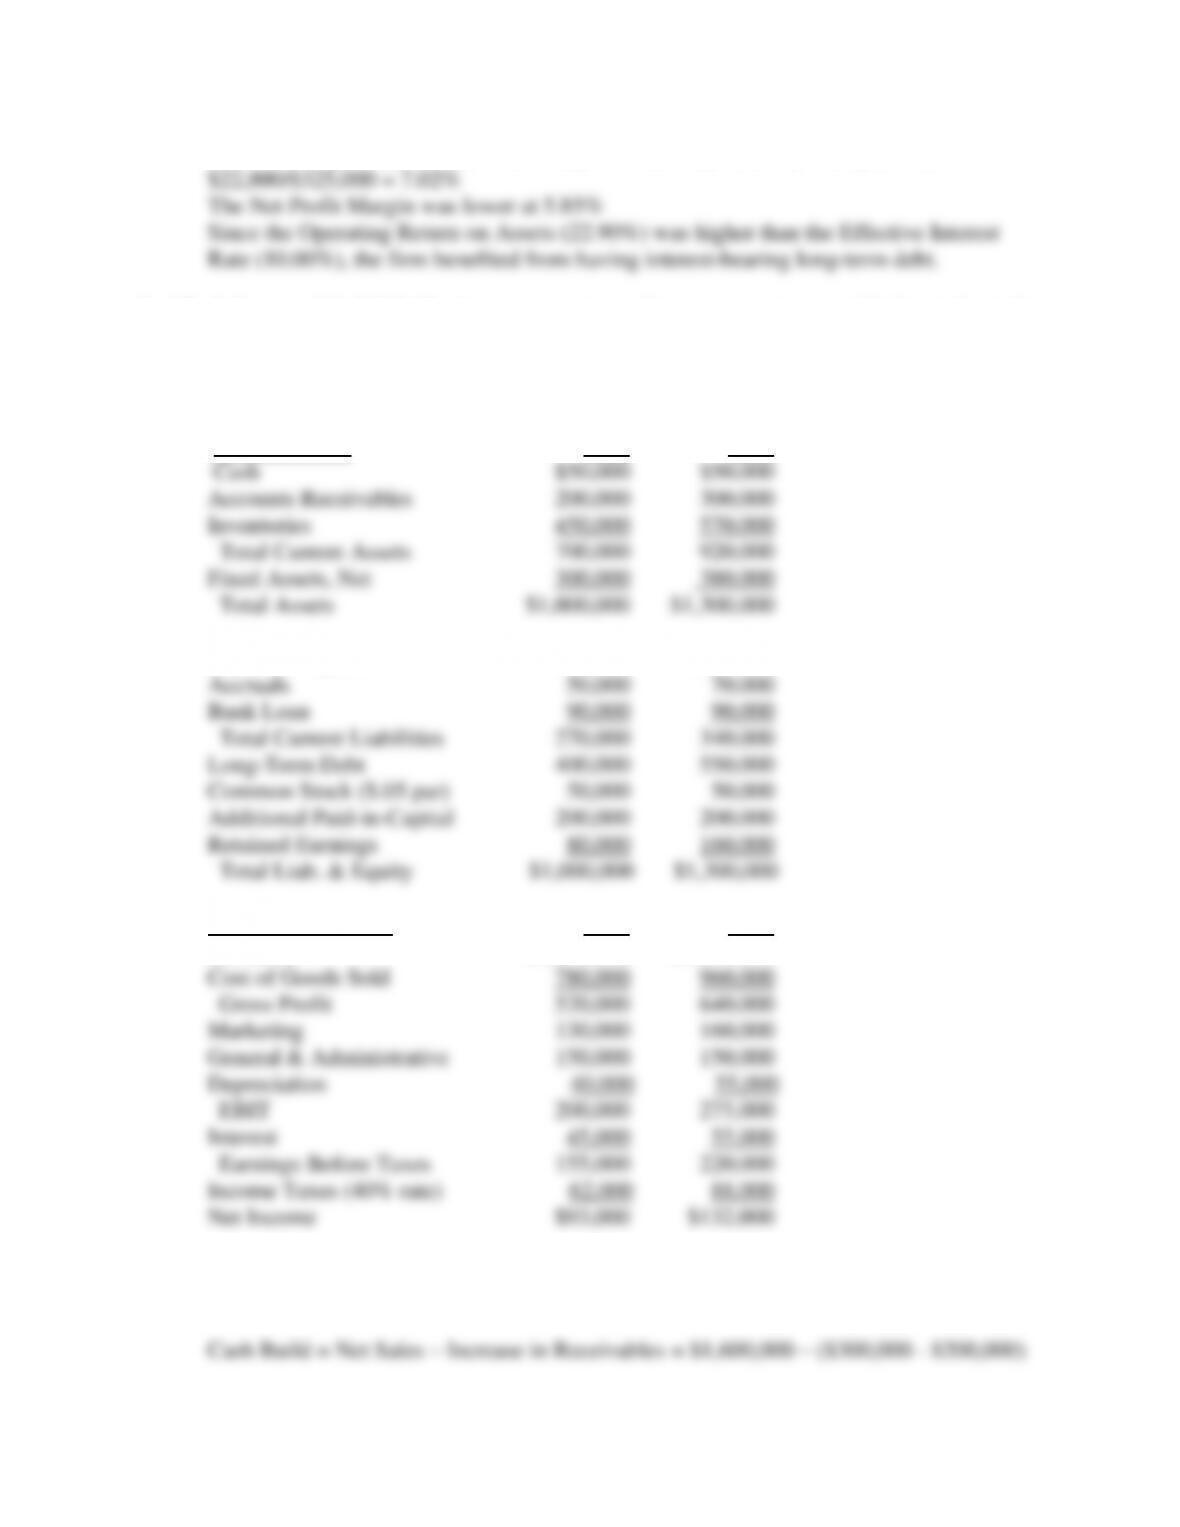
A. Calculate the operating return on assets.
B. Determine the effective interest rate paid on the long-term debt.
C. Calculate the NOPAT margin. How does this compare with the results for the net profit
margin? Did the owners benefit from the use of interest-bearing long-term debt?
Chapter 5: Evaluating Operating and Financial Performance
81
NOPAT Margin = [(EBIT)(1 – tax rate)]/Net Sales = [$30,000(1 – .24)]/$325,000 =
5. [Cash Burn and Build] Following are two years of income statements and balance sheets for
the Munich Exports Corporation.
MUNICH EXPORTS CORPORATION
Balance Sheet 2015 2016
Accounts Payable 130,000 $180,000
Income Statement 2015 2016
Net Sales $1,300,000 $1,600,000
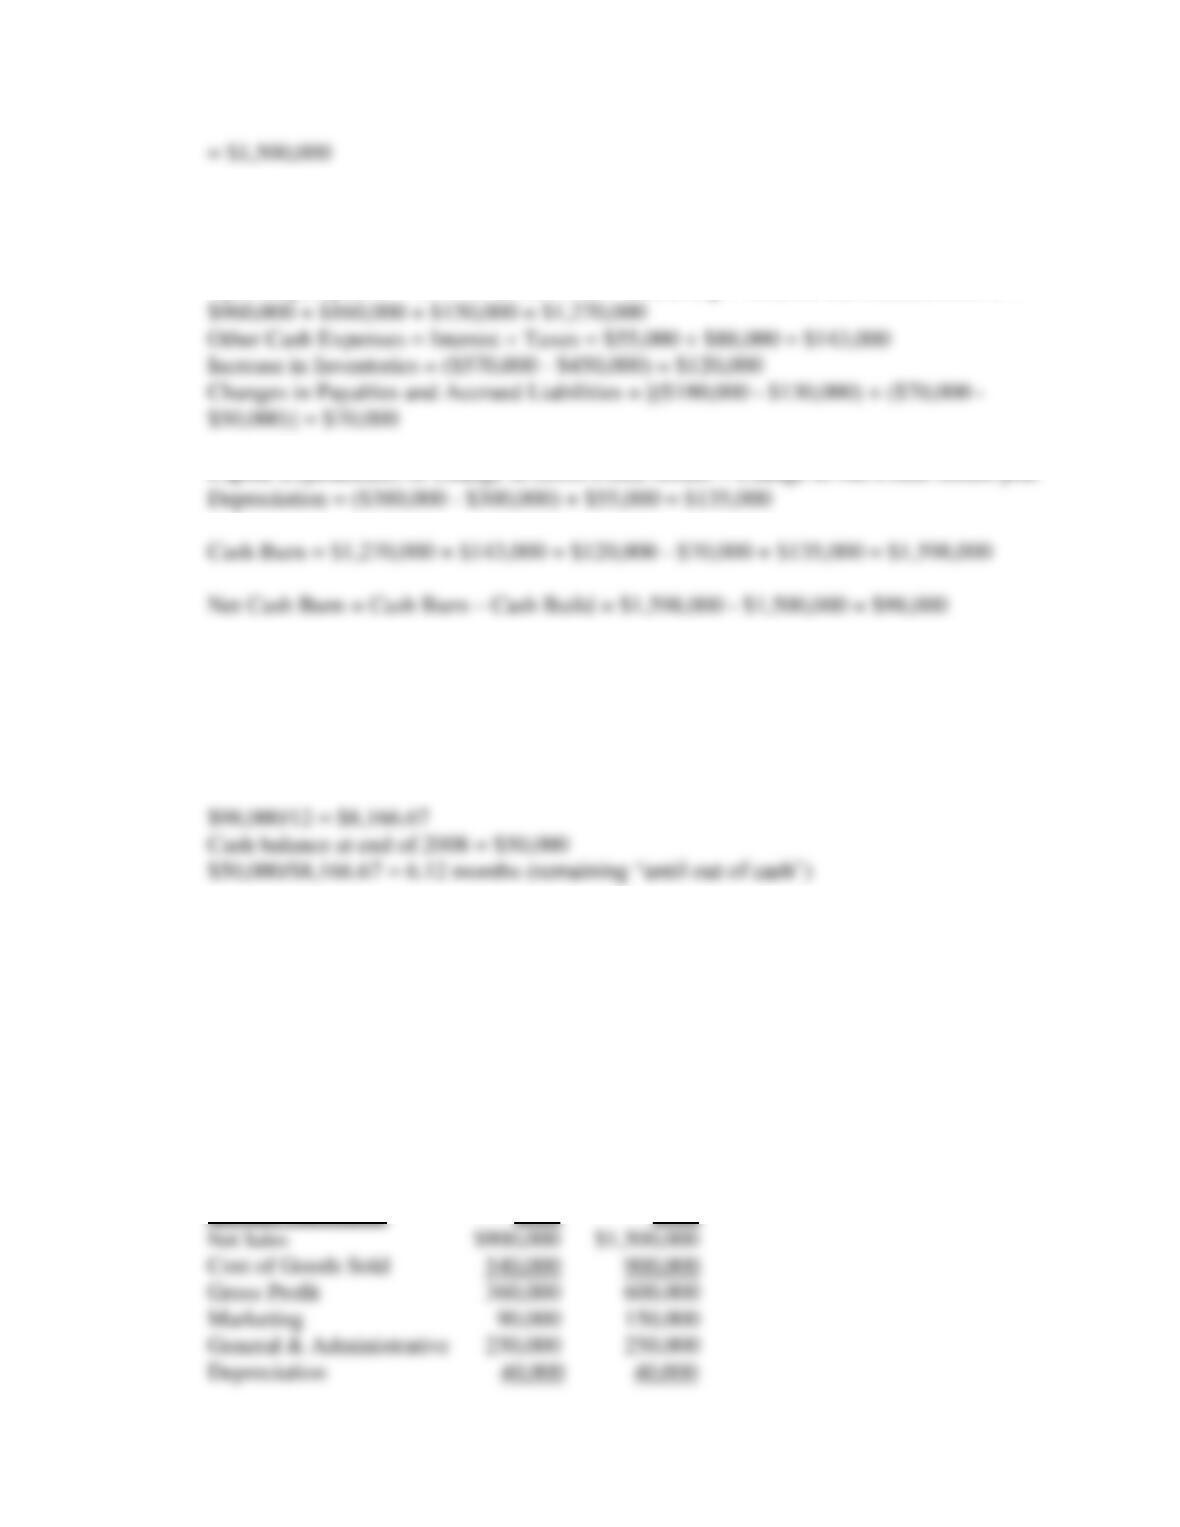
A. Calculate the cash build, cash burn, and net cash burn or build for Munich Exports in
2016.
Chapter 5: Evaluating Operating and Financial Performance
82
Cash Burn = Income Statement-Based Operating, Interest, and Tax Expenses + Increase
in Inventories – (Changes in Payables + Accrued Liabilities) + Capital Expenditures
Operating Expenses = Cost of Goods Sold + Marketing + General and Administrative =
Capital Expenditures or Change in Gross Fixed Assets = Change in Net Fixed Assets plus
B. Assume that 2017 will be a repeat of 2016. If your answer in Part A resulted in a net
cash burn position, calculate the net cash burn monthly rate and indicate the number of
months remaining “until out of cash.” If your answer in Part A resulted in a net cash
build position, calculate the net cash build monthly rate and indicate the expected cash
balance at the end of 2017.
6. [Liquidity Ratios and Cash Burn or Build] The Castillo Products Company was started in
2014. The company manufactures components for personal decision assistant (PDA)
products and for other hand-held electronic products. A difficult operating year 2015 was
followed by a profitable 2016. However, the founders (Cindy and Rob Castillo) are still
concerned about the venture’s liquidity position and the amount of cash being used to
operate the firm. Following are income statements and balance sheets for the Castillo
Products Company for 2015 and 2016.
CASTILLO PRODUCTS COMPANY
Income Statement 2015 2016