Chapter 10: Valuing Early-Stage Ventures
156
(2) What role, if any, does the $50,000 cash and the $81,900 sweat equity play in
determining the post-financing ownership structure? Would the investor want
less ownership if there had been two years of history rather than a year-and-
a-half?
All of this investment is sunk. While it may affect the bargaining attitude of
the founder and investor, these amounts and imputed amounts are “water
(3) How will the investor make a return on the $100,000 investment? Does this
relate to the existing investment?
(4) How would you structure an approach to answering Jim’s question regarding
how much the new investor should own in exchange for the $100,000
investment?
(5) Comment on the casual remark, “Investors pay for the future, entrepreneurs
pay for the past.”
This is the difficulty faced by most of the entrepreneurs and investors in the
valuation process. Entrepreneurs are intimately familiar with the struggle and

Chapter 10: Valuing Early-Stage Ventures
157
SPREADSHEET VALUATION PROBLEM
8. [Venture Present Value Concepts] The Biometrix Corporation has been in operation
for one full year (2016). Financial statements follow. Biometrix’s management is
interested in determining the value of the venture as of the end of 2016. Sales are
expected to grow at a 20 percent annual rate for each of the next three years (2017,
2018, and 2019) before settling down to a long-run growth rate of 7 percent annually.
The cost of goods sold is expected to vary with sales. Operating expenses are expected
to grow at 75 percent of the sales growth rate (i.e., be semi-fixed) for the next three
years before again growing at the same rate as sales beginning in 2020. Individual
asset accounts are expected to grow at the same rate as sales. Depreciation can be
forecasted either as a percentage of sales or as a percentage of net fixed assets (since
net fixed assets are expected to grow at the same rate as sales growth). Accounts
payable and accrued liabilities are also expected to grow with sales.
Biometrix’s management is interested in determining the equity value of the venture as
of the end of 2016. Because Biometrix is in its startup life cycle stage, management
and venture investors believe that 40 percent is an appropriate discount rate until the
firm reaches its long-run or perpetuity growth rate. At that time it will have survived
and will become a more typical firm with an estimated cost of equity capital of 20
percent. One million shares of common stock are outstanding.
BIOMETRIX CORPORATION
Income Statement for December 31, 2016
(Thousands of Dollars)
Sales $20,000
Cost of goods sold -10,000
Gross profit 10,000
Operating expenses -7,500
Depreciation -400
EBIT 2,100
Interest -100
EBT 2,000
Taxes (40%) -800
Net income $1,200
Chapter 10: Valuing Early-Stage Ventures
158
Balance Sheet as of December 31, 2016
(Thousands of Dollars)
Cash $ 1,000 Accounts payable $ 1,500
Accounts receivable 2,000 Accrued liabilities 1,000
Inventories 2,000 Bank loan 1,000
Total current assets 5,000 Total current liabilities 3,500
Gross fixed assets 5,400 Common stock 5,300
Accumulated depreciation 400 Retained earnings 1,200
Net fixed assets 5,000 Total equity 6,500
Total assets $10,000 Total liabilities and equity $10,000
A. Project the financial statements for the next four years (2017-2020).
The spreadsheet solution shows the projection of annual income statements,
balance sheets, and statements of cash flow for the years 2017 through 2020.
Following are some highlights:
Item 2017 2018 2019 2020
B. Calculate the valuation cash flow for each year.
The spreadsheet solution produces the following annual amounts of free cash flow
available to the equity investors:
Year Free Cash Flow
C. Determine Biometrix’s equity value at the end of 2016.
The horizon or terminal cash flow at the end of 2019 is estimated using the
Chapter 10: Valuing Early-Stage Ventures
159
The total free cash flows to equity shown below were then discounted at a 40%
rate to arrive at a present value of $7,312 for the firm’s equity.
Annual Horizon Total
Year Free Cash Flow + Free Cash Flow = Free Cash Flow
See spreadsheets below.
Chapter 10: Valuing Early-Stage Ventures
160
BIOMETRIX, INC.
[Equity Valuation Method] Actual I<—––––––– Projected —–––––———––––––——–>I
Percent Sales Increase–—–> 20.0% 20.0% 20.0% 7.0%
Chapter 10; Problem 8 % of 2016 Thousands of Dollars
Income Statements Sales 2016 2017 2018 2019 2020
Sales 100.0% 20000 24000 28800 34560 36979
Cost of goods sold -50.0% -10000 –12000 –14400 –17280 -18490
Gross profit 50.0% 10000 12000 14400 17280 18490
Operating expenses -37.5% -7500 -8625 -9919 –11407 –12205
Depreciation -400 –480 –576 –691 –740
Interest -100 –100 –100 –100 –100
EBT 2000 2795 3805 5082 5445
Taxes (40%) -800 1118 1522 2033 2178
Accumulated depreciation -400 –880 –1456 –2147 –2887
Net fixed assets 25.0% 5000 6000 7200 8640 9245
Total assets 50.0% 10000 12177 15060 18829 22399
Accounts payable 7.5% 1500 1800 2160 2592 2773
Accrued liabilities 5.0% 1000 1200 1440 1728 1849
Change in inventories -400 -480 -576 -242
Change in accts payable 300 360 432 181
Change in accrued liabilities 200 240 288 121
CF from operations 1857 2499 3309 3825
Change in gross fixed assets -1480 -1776 –2131 –1344
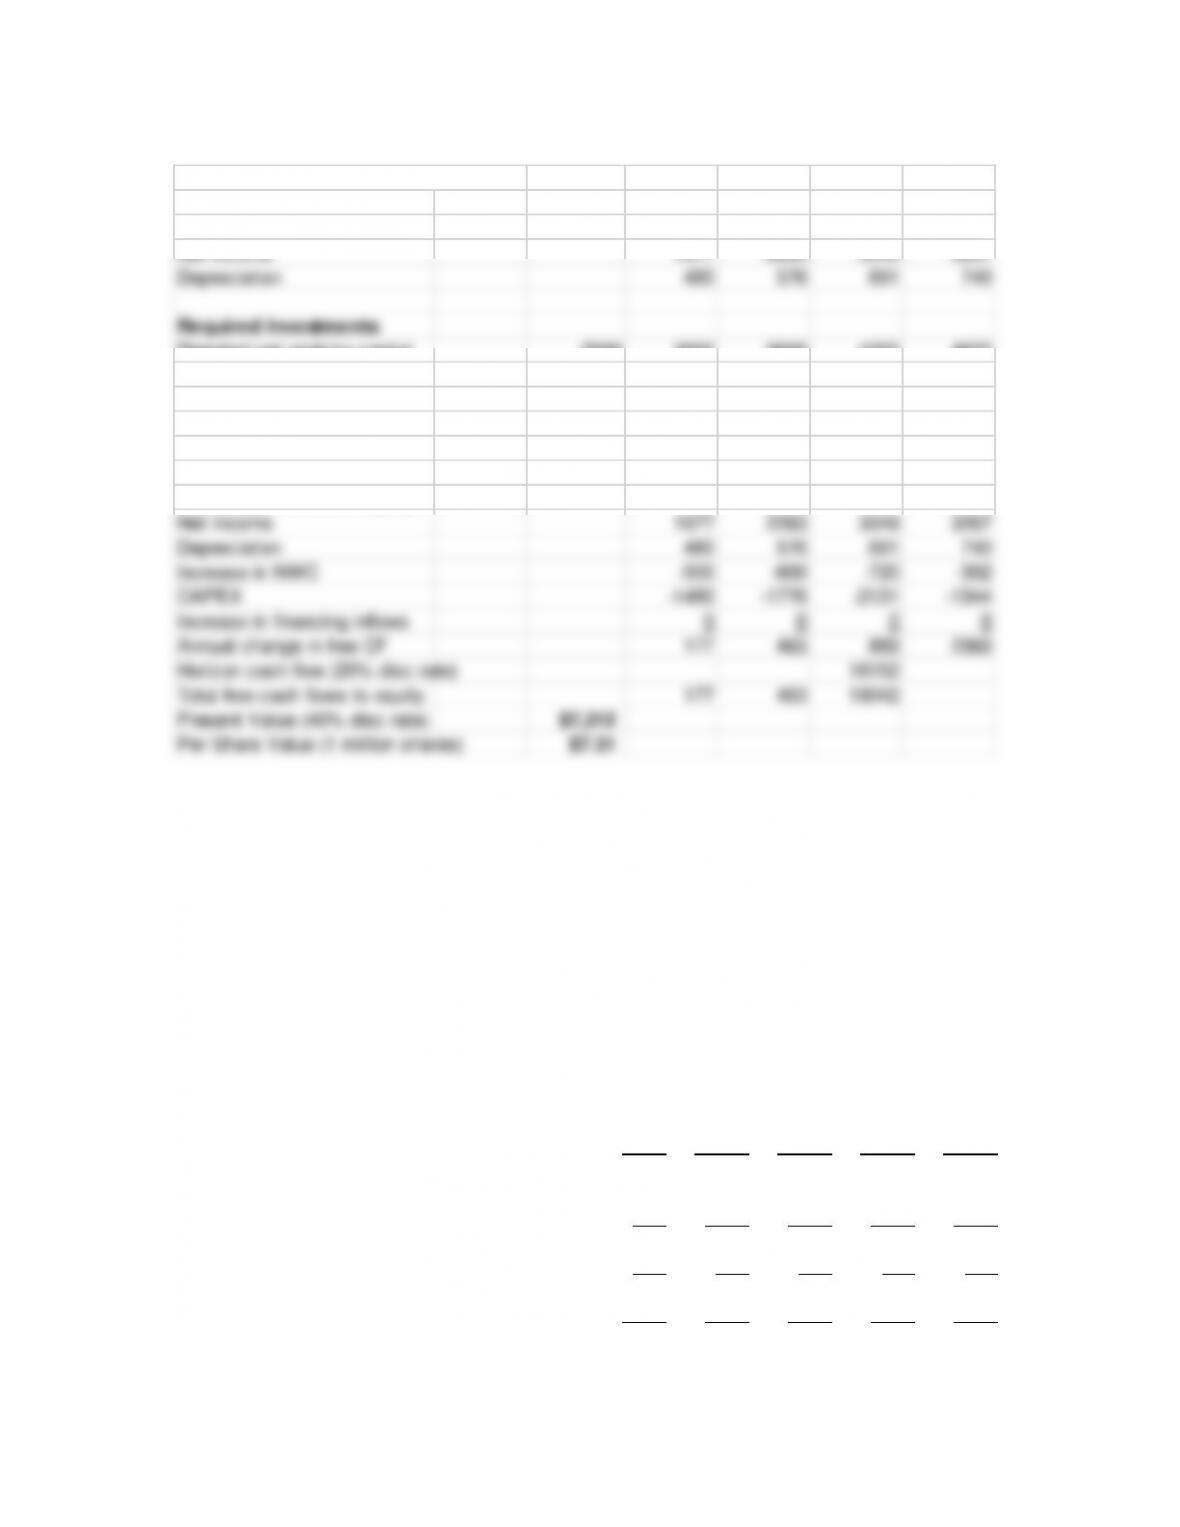
Total free cash flows to equity 177 483 19042
Present Value (40% disc rate) $7,312
Per Share Value (1 million shares) $7.31
Chapter 10: Valuing Early-Stage Ventures
161
Alternative Equity Valuation Process:
2016 2017 2018 2019 2020
Income Statement Flows:
Net Income 1677 2283 3049 3267
Depreciation 480 576 691 740
Required Investments:
Required net working capital 2500 3000 3600 4320 4622
Change in NWC 500 600 720 302
Change in gross fixed assets 1480 1776 2131 1344
Financing Activities:
Change in financing activities 0 0 0 0
Free Cash Flows to Equity:
Net income 1677 2283 3049 3267
Depreciation 480 576 691 740
Increase in NWC –500 –600 –720 -302
CAPEX –1480 –1776 –2131 –1344
Increase in financing inflows 0 000
Annual change in free CF 177 483 889 2360
Horizon cash flow (20% disc rate) 18152
Total free cash flows to equity 177 483 19042
Present Value (40% disc rate) $7,312
Per Share Value (1 million shares) $7.31
MINI CASE: SOFTTEC PRODUCTS COMPANY
The SoftTec Products Company is a successful small, rapidly growing, closely held
corporation. The equity owners are considering selling the firm to an outside buyer and
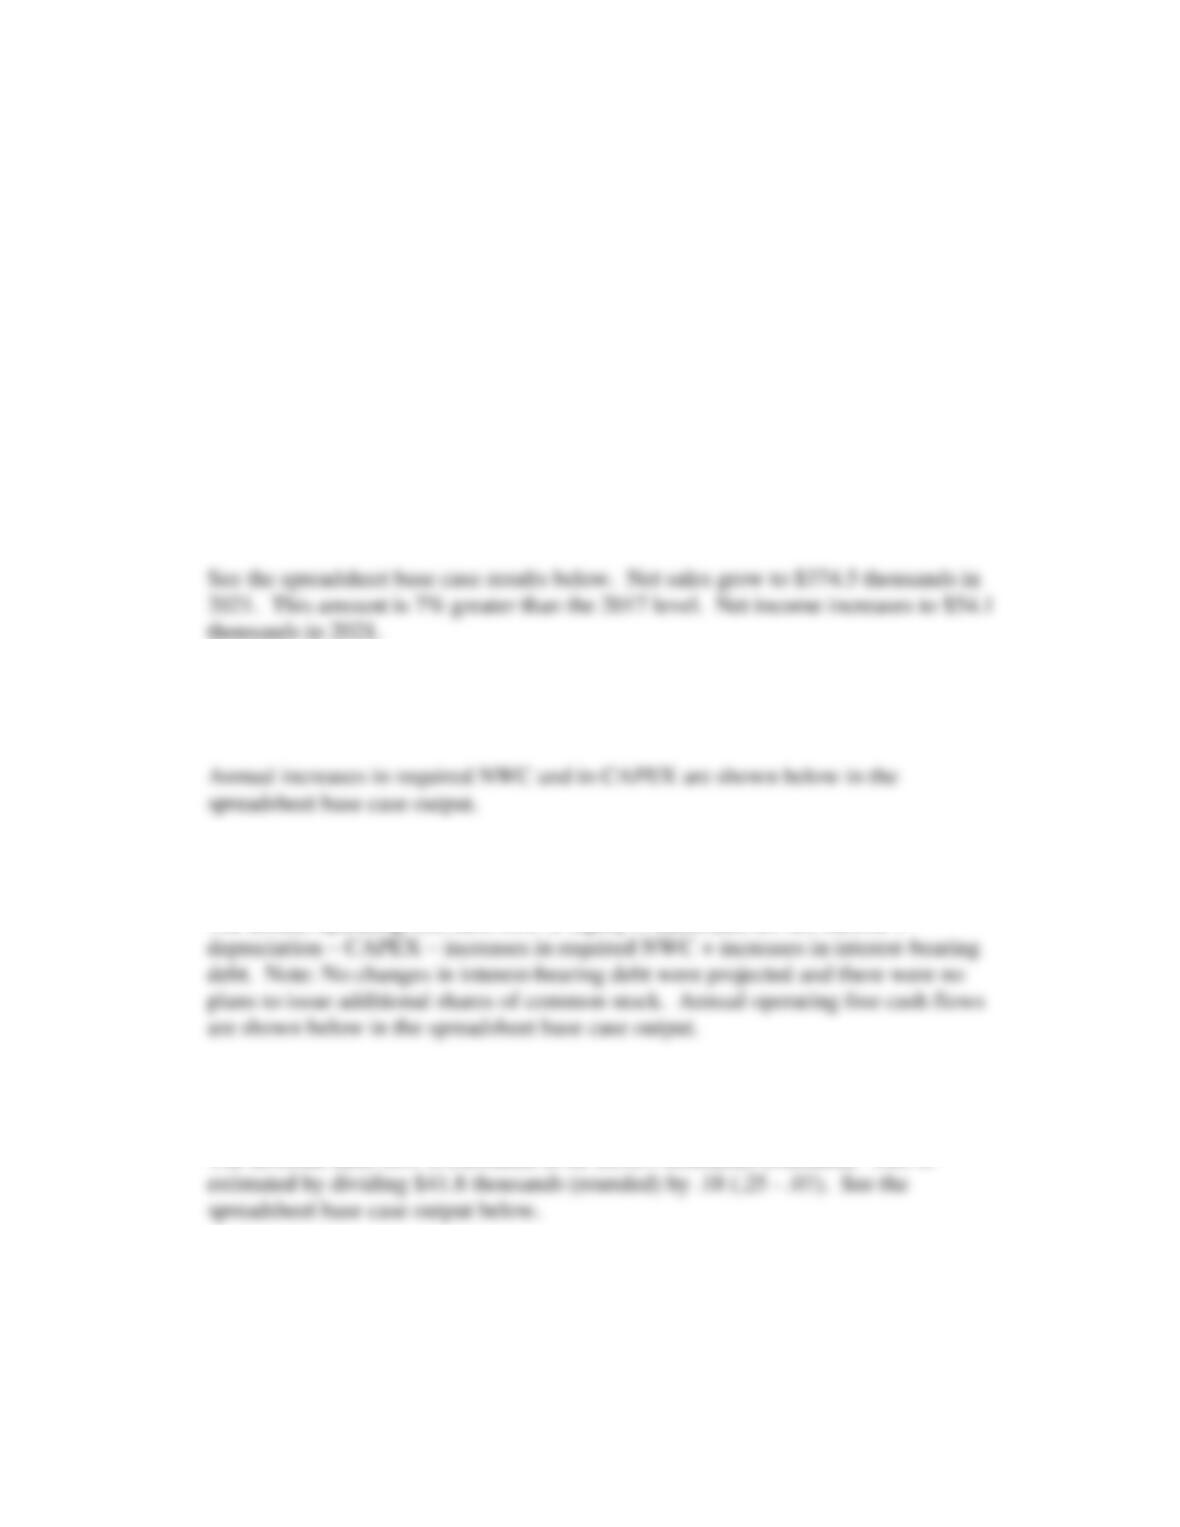
want to estimate the value of the firm. Following is last year’s income statement (2016)
and projected income statements for the next four years (2017-2020). Sales are expected
to grow at an annual 7 percent rate beginning in 2018 and continuing thereafter.
2016
2017
2018
2019
2020
Net Sales
150.0
200.0
250.0
300.0
350.0
Cost of Goods Sold
-75.0
-100.0
-125.0
-150.0
-175.0
Gross Profit
.
75.0
100.0
125.0
150.0
175.0
SG&A Expenses
-30.0
-40.0
-50.0
-60.0
-70.0
Depreciation
-7.5
-10.0
-12.5
-15.0
-17.5
EBIT
37.5
50.0
62.5
75.0
87.5
Interest
-3.5
-3.5
-3.5
-3.5
-3.5
EBT
34.0
46.5
59.0
71.5
84.0
Taxes (40% rate)
-13.6
-18.6
-23.6
-28.6
-33.6
[$ Thousands]
Chapter 10: Valuing Early-Stage Ventures
162
Selected balance sheet accounts at the end of 2016 were as follows. Net fixed
assets were $50,000. The sum of the required cash, accounts receivable, and inventories
accounts was $50,000. Accounts payable and accruals totaled $25,000. Each of these
balance sheet accounts was expected to grow with sales over time. No changes in
interest-bearing debt were projected and there were no plans to issue additional shares of
common stock. There are currently 10,000 shares of common stock outstanding.
Data have been gathered for a “comparable” publicly-traded firm in the same
industry that SoftTec operates in. The cost of common equity for this other firm,
Wakefield Products, was estimated to be 25 percent. SoftTec has survived for a period of
years. Management is not currently contemplating a major financial structure change and
believes a single discount rate is appropriate for discounting all cash flows.
A. Project SoftTec’s income statement for 2021.
B. Determine the annual increases in required net working capital and capital
expenditures (CAPEX) for SoftTec for the years 2017 to 2021.
C. Project annual operating free cash flows for the years 2017 to 2021.
The annual operating free cash flow to equity is calculated as: net income +
D. Estimate SoftTec’s terminal value cash flow at the end of 2020.
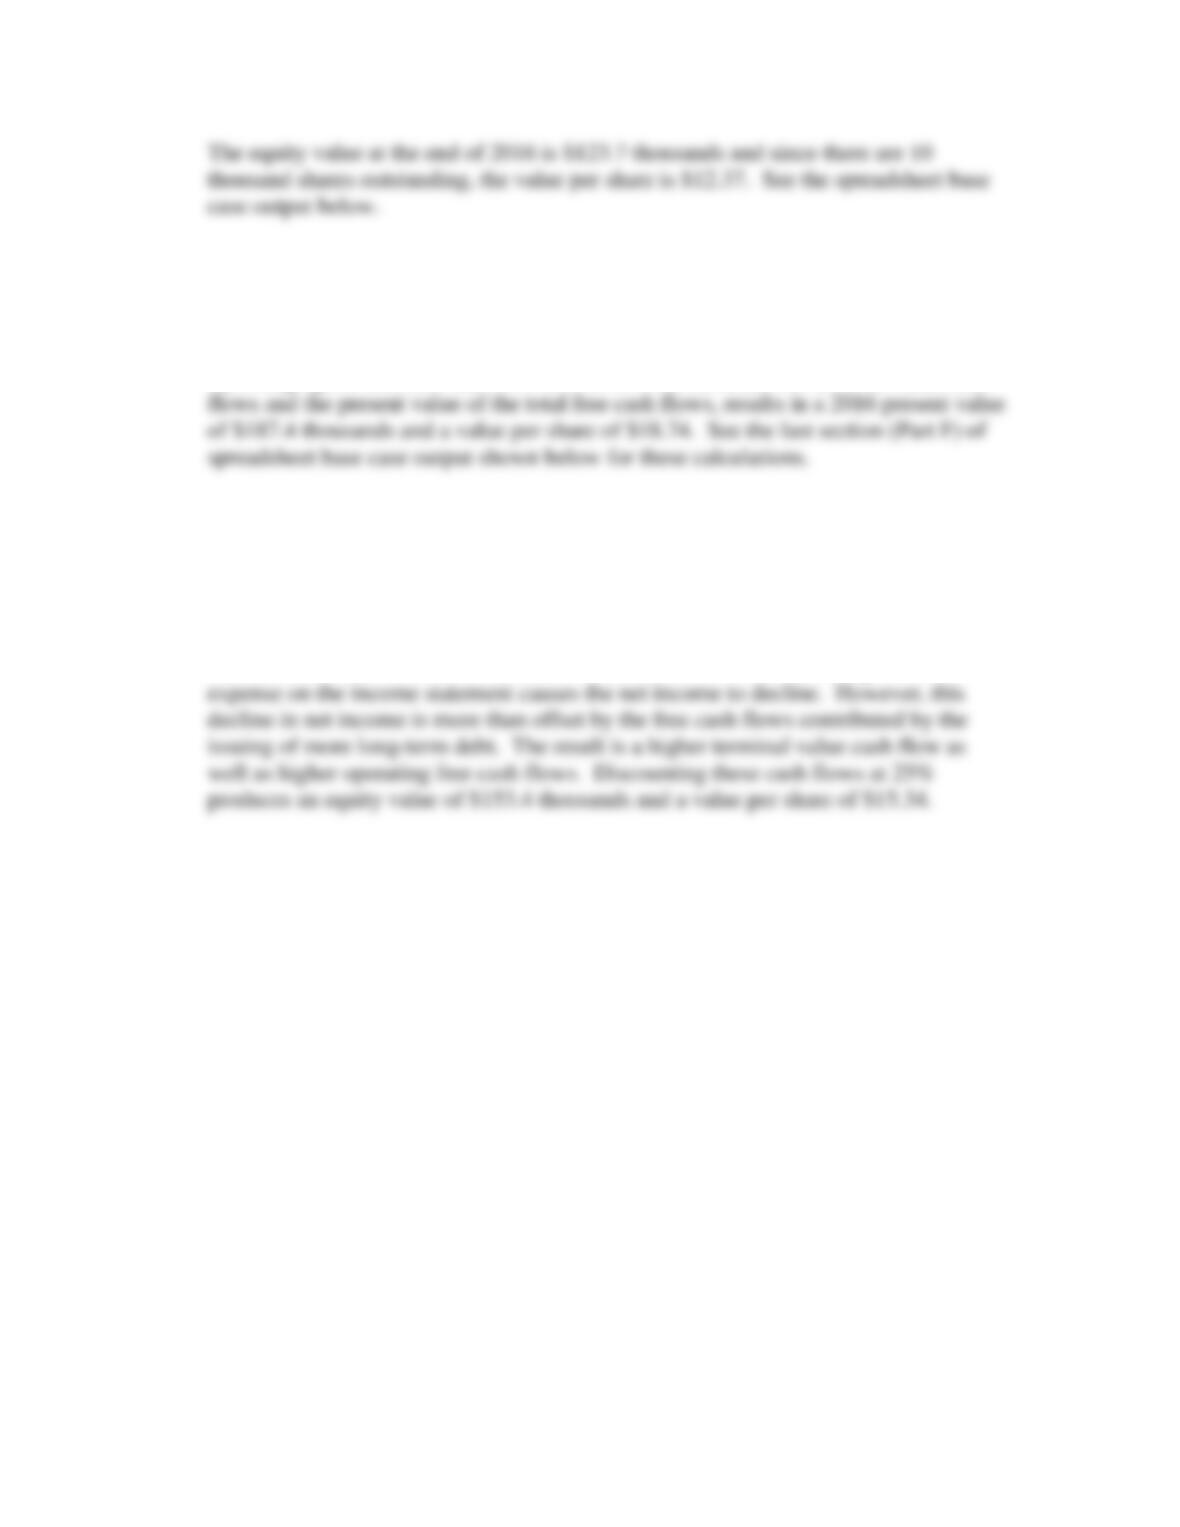
The terminal cash flow is estimated to be $232.4 thousands (rounded). This is
E. Estimate SoftTec’s equity value in dollars and per share at the end of 2016.
Chapter 10: Valuing Early-Stage Ventures
163
F. SoftTec’s management was wondering what the firm’s equity value (dollar amount
and on a per share basis) would be if the cost of equity capital was only 20 percent.
Recalculate the firm’s value using this lower discount rate.
By changing the discount rate from 25% to 20%, to calculate the terminal value cash
G. Now assume that the $35,000 in long-term debt (and therefore interest expense at
10%) is expected to grow with sales. Recalculate the equity using the original 25%
discount rate.
See the spreadsheet revised case results (Part G) shown below. One difference
between this solution and the base case results solution is the increasing interest
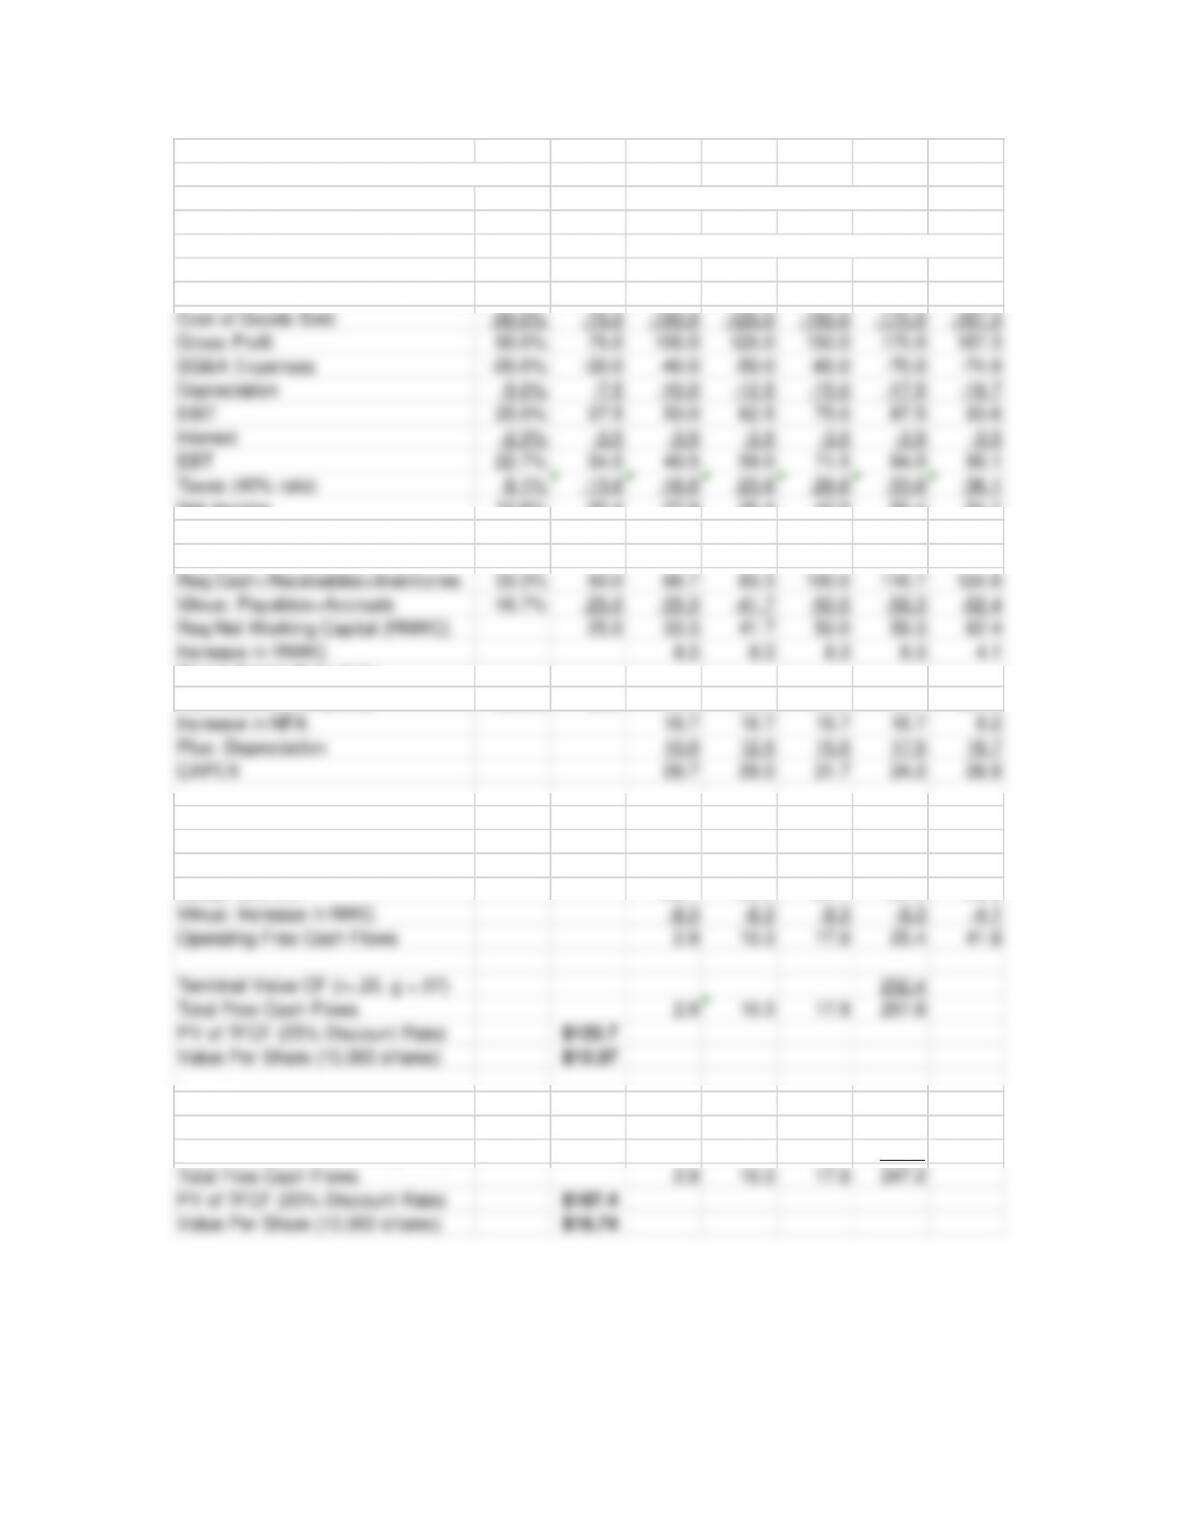
Chapter 10: Valuing Early-Stage Ventures
164
SOFTTEC PRODUCTS COMPANY
Base Case Results [Parts A, B, C, D, & E]:
Chapter 10 Mini Case Percent Change in Net Sales
% of 33.3% 25.0% 20.0% 16.7% 7.0%
[Thousands of Dollars] 2016 Actual Pro forma —––––––––––––––––––––––——–––––––——–––––
Income Statements Sales 2016 2017 2018 2019 2020 2021
Net Sales 100.0% 150.0 200.0 250.0 300.0 350.0 374.5
Cost of Goods Sold -50.0% -75.0 -100.0 -125.0 -150.0 -175.0 -187.3
Gross Profit 50.0% 75.0 100.0 125.0 150.0 175.0 187.3
SG&A Expenses -20.0% -30.0 –40.0 –50.0 –60.0 -70.0 –74.9
Depreciation -5.0% –7.5 –10.0 -12.5 -15.0 -17.5 -18.7
EBIT 25.0% 37.5 50.0 62.5 75.0 87.5 93.6
Interest -2.3% –3.5 –3.5 -3.5 -3.5 -3.5 -3.5
EBT 22.7% 34.0 46.5 59.0 71.5 84.0 90.1
Taxes (40% rate) -9.1% -13.6 -18.6 –23.6 -28.6 -33.6 -36.1
Net Income 13.6% 20.4 27.9 35.4 42.9 50.4 54.1
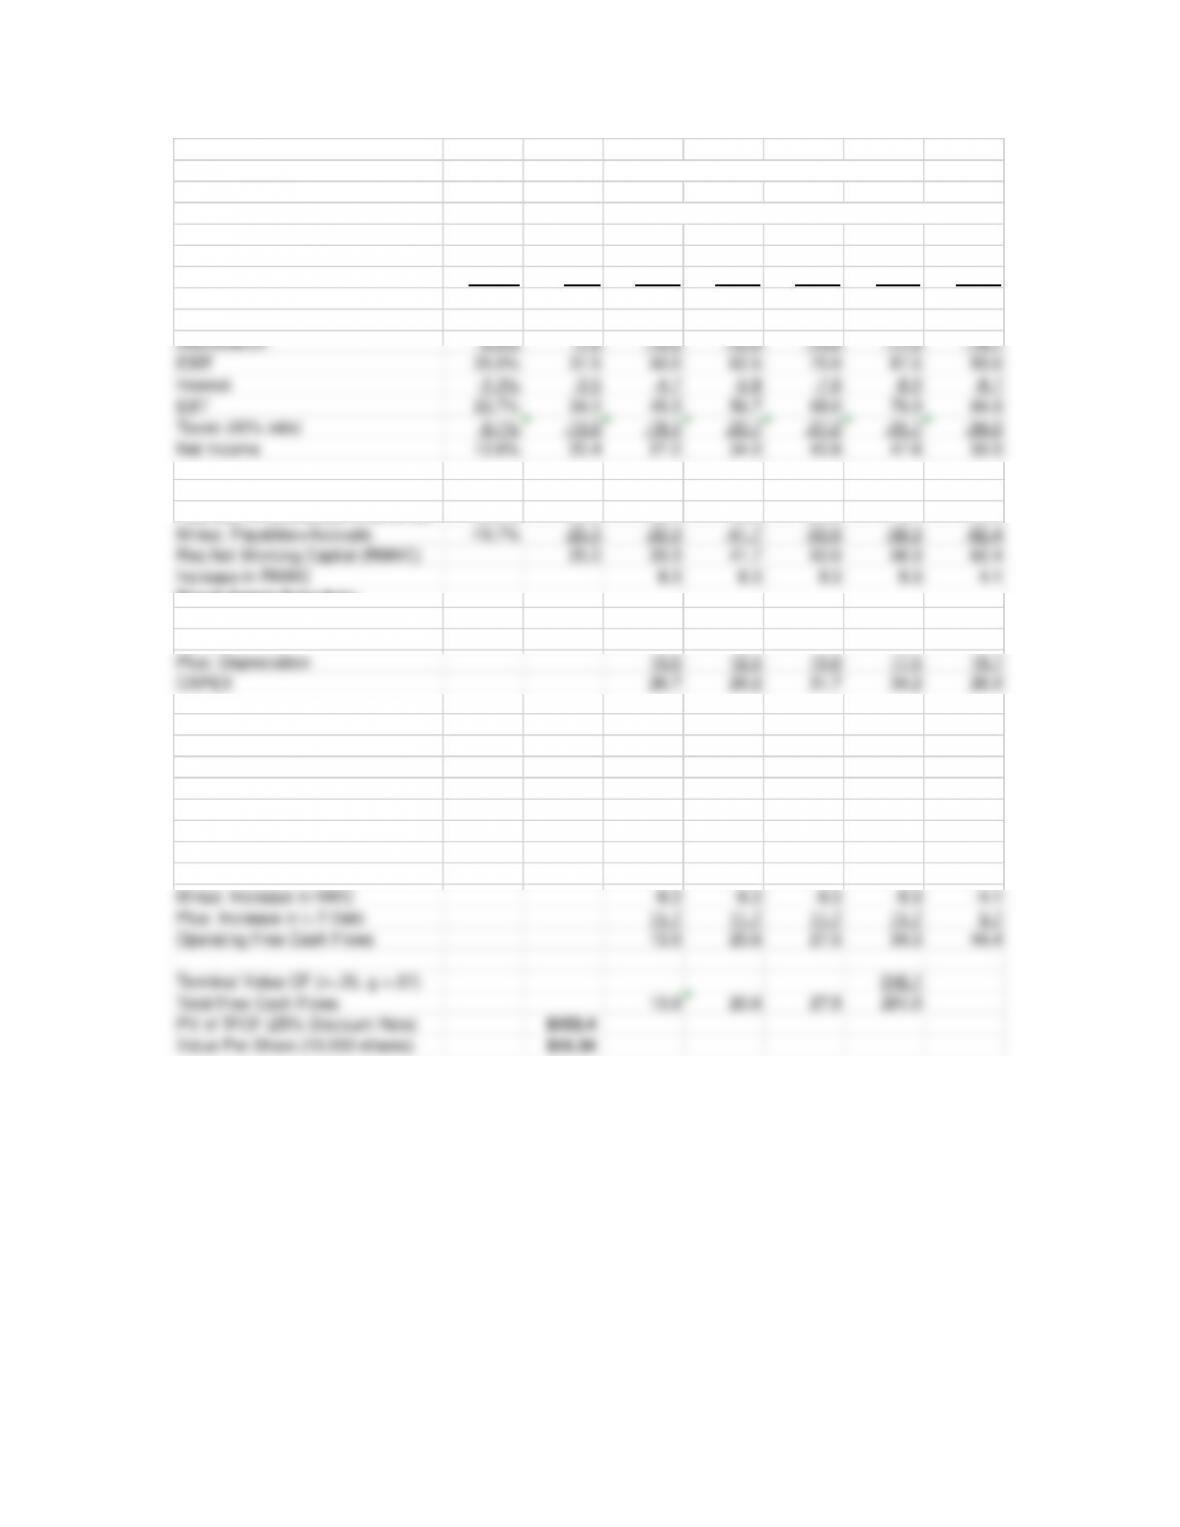
Required Net Working Capital:
Req Cash+Receivables+Inventories 33.3% 50.0 66.7 83.3 100.0 116.7 124.8
Minus: Payables+Accruals -16.7% -25.0 -33.3 -41.7 -50.0 -58.3 -62.4
Free Cash Flows to Equity:
Net Income 27.9 35.4 42.9 50.4 54.1
Plus: Depreciation 10.0 12.5 15.0 17.5 18.7
Terminal Value CF (r=.25, g =.07) 232.4
Total Free Cash Flows 2.9 10.3 17.9 257.8
Part F:
Operating Free Cash Flows 2.9 10.3 17.9 25.4 41.8
Terminal Value CF (r=.20, g =.07) 321.7
Total Free Cash Flows 2.9 10.3 17.9 347.2
PV of TFCF (20% Discount Rate) $187.4
Chapter 10: Valuing Early-Stage Ventures
165
Revised Case Results [Part G]:
Chapter 10 Mini Case Percent Change in Net Sales
% of 33.3% 25.0% 20.0% 16.7% 7.0%
[Thousands of Dollars] 2016 Actual Pro forma —–––——–––––——–––––——–––––——––––
Income Statements Sales 2016 2017 2018 2019 2020 2021
Net Sales 100.0% 150.0 200.0 250.0 300.0 350.0 374.5
Cost of Goods Sold –50.0% -75.0 -100.0 -125.0 -150.0 -175.0 -187.3
Gross Profit 50.0% 75.0 100.0 125.0 150.0 175.0 187.3
SG&A Expenses -20.0% -30.0 -40.0 -50.0 -60.0 –70.0 -74.9
Depreciation -5.0% –7.5 -10.0 -12.5 -15.0 -17.5 -18.7
EBIT 25.0% 37.5 50.0 62.5 75.0 87.5 93.6
Interest -2.3% –3.5 -4.7 -5.8 -7.0 -8.2 -8.7
EBT 22.7% 34.0 45.3 56.7 68.0 79.3 84.9
Taxes (40% rate) -9.1% -13.6 -18.1 -22.7 -27.2 -31.7 -34.0
Net Income 13.6% 20.4 27.2 34.0 40.8 47.6 50.9
Required Net Working Capital:
Req Cash+Receivables+Inventories 33.3% 50.0 66.7 83.3 100.0 116.7 124.8
Minus: Payables+Accruals -16.7% -25.0 -33.3 -41.7 -50.0 -58.3 -62.4
Req Net Working Capital (RNWC) 25.0 33.3 41.7 50.0 58.3 62.4
Increase in RNWC 8.3 8.3 8.3 8.3 4.1
Fixed Assets Schedule:
Net Fixed Assets (NFA) 33.3% 50.0 66.6 83.3 100.0 116.7 124.8
Increase in NFA 16.7 16.7 16.7 16.7 8.2
Plus: Depreciation 10.0 12.5 15.0 17.5 18.7
CAPEX 26.7 29.2 31.7 34.2 26.9
Long-Term Debt Financing:
Amount of Long–Term Debt 23.3% 35.0 46.7 58.3 70.0 81.7 87.4
Increase in Long-term Debt 11.7 11.7 11.7 11.7 5.7
Operating Free Cash Flows 13.9 20.6 27.5 34.3 44.4
Terminal Value CF (r=.25, g =.07) 246.7
Chapter 10: Valuing Early-Stage Ventures
166
MINI CASE: RxDELIVERY SYSTEMS, INC.
RxDelivery Systems is an R&D venture specializing in the development and testing of
new drug delivery technologies. The market for alternative drug delivery systems grew
rapidly during the 1990s. Driving factors behind this growth include efforts to reduce
drug side effects through site-specific delivery, the need to maintain the activity of new
biopharmaceutical compounds, and the extension of drug patent life. Improved drug
delivery methods are expected to reduce the number of surgical interventions and the
length of hospital stays, and improve patient compliance in taking prescribed drugs.
A large world market for biopharmaceuticals (including peptide, protein, RNA,
and DNA drugs) exists today. Sales of polymer-based drug delivery systems continue to
grow rapidly. Pulmonary delivery systems represent an important segment of the drug
delivery market.
RxDelivery Systems believes it can compete effectively in both the polymer-
based and the pulmonary drug delivery areas. The venture’s delivery technology is
expected to utilize hydrophobic ion pairing and supercritical carbon dioxide precipitation
to incorporate water-soluble drug molecules into biodegradable controlled-release
microspheres. The resulting microspheres will take the form of dry powders and will
contain drug molecules small enough to allow for intravenous, intranasal, or pulmonary
delivery. It is anticipated that this technology will be incorporated into products for
controlled release applications including treatment of cancer, infectious diseases, and
gene therapy.
RxDelivery Systems, through an agreement with its pharmaceutical parent, a
major drug company, will initially operate as an independent corporation but will be
merged into the parent at the end of its second year. At that time, RxDelivery Systems’
entrepreneurial team will be paid a lump sum of $2,500,000 as the terminal value for the
venture.
Following are limited financial statement projections for the next two years for
RxDelivery Systems:
First year revenues $12,500
Second year revenues $16,000
Expenses (including depreciation) $125,000 per year
Initial time-zero (net) fixed assets $50,000
Depreciation 10% of beginning-of-year net fixed assets
Accounts Payable (Years. 1 and 2) $750
Inventories (Years. 1 and 2) $0
Corporate marginal tax rate 30%
Accounts Receivable (Years 1 and 2) $0
Accrued Expenses (Years 1 and 2) $300
Required Cash $3000
Debt (all years) $0
A. Construct the venture’s income statements for Years 1 and 2.
Chapter 10: Valuing Early-Stage Ventures
167
See spreadsheet below
B. Construct the venture’s balance sheets at startup and at the end of Years 1 and 2. Put
initial fixed asset investments in Year 0 and initial working capital investments in Year 1.
Assume the initial $50,000 is equity financed.
See spreadsheet below.
C. Construct the pseudo dividend method equity valuation cash flow including the
$2,500,000 terminal payment.
See spreadsheet below.
D. Using a 30% discount rate for the first two years and a $2,500,000 terminal value,
what is the value of the venture at its launch?
[Note: Answers use cash taxes (without tax credit and deferred tax asset investment)]
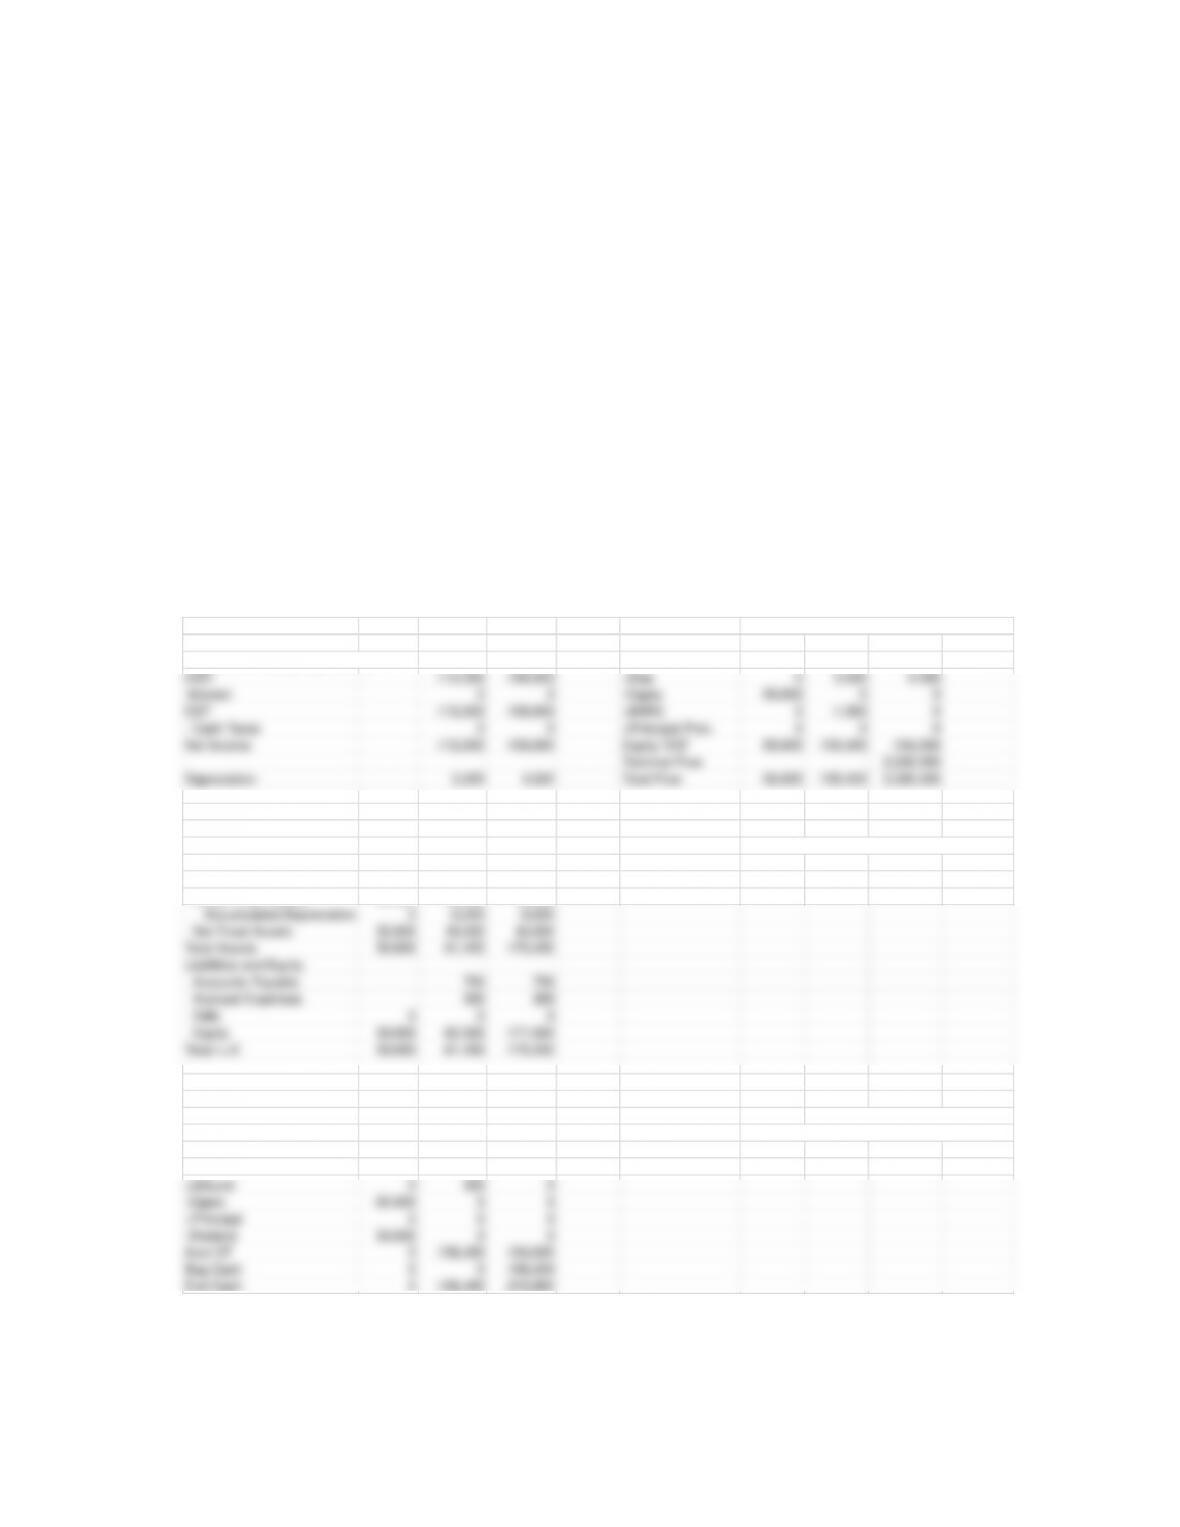
Income Statements Year 1 Year 2
Valuation (PDM) (Surplus Cash is Zero for Valuation Purposes)
Revenue 12,500 16,000 Year 0 Year 1 Year 2
Expenses Including Depreciation -125,000 –125,000 NI 0 -112,500 -109,000
EBIT -112,500 –109,000 +Dep 0 5,000 4,500
-Interest 0 0 -Capex –50,000 0 0
EBT -112,500 –109,000 –dNWC 0 -1,950 0
– Cash Taxes 0 0 +Principal Proc. 0 0 0
Net Income -112,500 -109,000 Equity VCF -50,000 –109,450 -104,500
Terminal Flow 2,500,000
Depreciation 5,000 4,500 Total Flow -50,000 –109,450 2,395,500
NPV 1,283,263
Balance Sheets Startup Year 1 Year 2
Assets Valuation (DDA) (Surplus Cash Situation Affects Terminal Flow)
Required Cash 0 3,000 3,000 Year 0 Year 1 Year 2
Surplus Cash 0 -109,450 -213,950 NI 0 -112,500 -109,000
Gross Fixed Assets 50,000 50,000 50,000 +Dep 0 5,000 4,500
Debt 0 0 0
Equity 50,000 -62,500 -171,500 NPV 1,302,692
Total L+E 50,000 -61,450 -170,450
Sum
Accounting Cash Flows Year 0 Year 1 Year 2 Difference in EqCF 0 109,450 -109,450 0
NI 0 -112,500 -109,000 NPV of Difference 19,429
+Depr 0 5,000 4,500 DDA Value Increase 19,429 (=1,302,263-1,283,263)
-dAR 0 0 0 due to timing differences on surplus cash

Chapter 10: Valuing Early-Stage Ventures
168
Discussion Note:
In this example, the firm is currently projected to run at large unfunded losses and the
plan is not a feasible financial plan. One point of this exercise is to show that the
methods work even when there is a large deficit in the funding (represented here by the
large negative surplus cash account balances). The valuation methods still work.
The equity valuation method charges for capital when it is used in the venture’s
operations. While many finance academics and practitioners are content with using
actual tax cash outlays (as in the previous spreadsheet), others are more careful to provide
accounting-friendly versions that incorporate a tax credit and a deferred tax asset
investment. As the cash flows are identical, it is not surprising that the valuations are the
same.
Answers using tax credit and booking deferred tax asset investment:
Income Statements Year 1 Year 2
Valuation (PDM) (Surplus Cash is Zero for Valuation Purposes)
Revenue 12,500 16,000 Year 0 Year 1 Year 2
-Non–Interest Expenses -125,000 –125,000 NI 0 –78,750 -76,300
EBIT –112,500 –109,000 +Dep 0 5,000 4,500
-Interest 0 0 -dDTA 0 –33,750 -32,700
EBT -112,500 –109,000 –Capex -50,000 0 0
-Tax Credit 33,750 32,700 –dNWC 0 -1,950 0
Net Income -78,750 -76,300 +Principal Proc. 0 0 0
Equity VCF -50,000 -109,450 -104,500
Depreciation 5,000 4,500 Terminal Flow 2,500,000
Total Flow -50,000 -109,450 2,395,500
Balance Sheets Startup Year 1 Year 2 NPV 1,283,263
Assets
Required Cash 0 3,000 3,000 Valuation (DDA) (Surplus Cash Situation Affects Terminal Flow)
Surplus Cash 0 -109,450 –213,950 Year 0 Year 1 Year 2
Deferred Tax Asset 0 33,750 66,450 NI 0 -78,750 -76,300
Gross Fixed Assets 50,000 50,000 50,000
Accumulated Depreciation 0 -5,000 -9,500 +Dep 0 5,000 4,500
Net Fixed Assets 50,000 45,000 40,500 -dDTA 0 –33,750 -32,700
Total Assets 50,000 -27,700 -104,000 -Capex -50,000 0 0
Liabilities and Equity -dNWC 0 107,500 104,500
Accounts Payable 750 750 +Principal Proc. 0 0 0
Accrued Expenses 300 300 Equity VCF –50,000 0 0
Debt 0 0 0 Terminal Flow 2,286,050
Equity 50,000 -28,750 -105,050 Total Flow -50,000 0 2,286,050
Total L+E 50,000 -27,700 -104,000
NPV 1,302,692
Accounting Cash Flows Year 0 Year 1 Year 2 Sum
NI 0 -78,750 –76,300 0
+Depr 0 5,000 4,500 Difference in EqCF 0 109,450 -109,450
-dDTA 0 -33,750 –32,700 NPV of Difference 19,429
-dAR 0 0 0 DDA Value Decline 19,429 (=1,302,692-1,283,263)
-dInv 0 0 0 due to timing differences on surplus cash
+dAP 0 750 0
+dAccrd 0 300 0
-Capex -2,500 0 0