274
E9–19
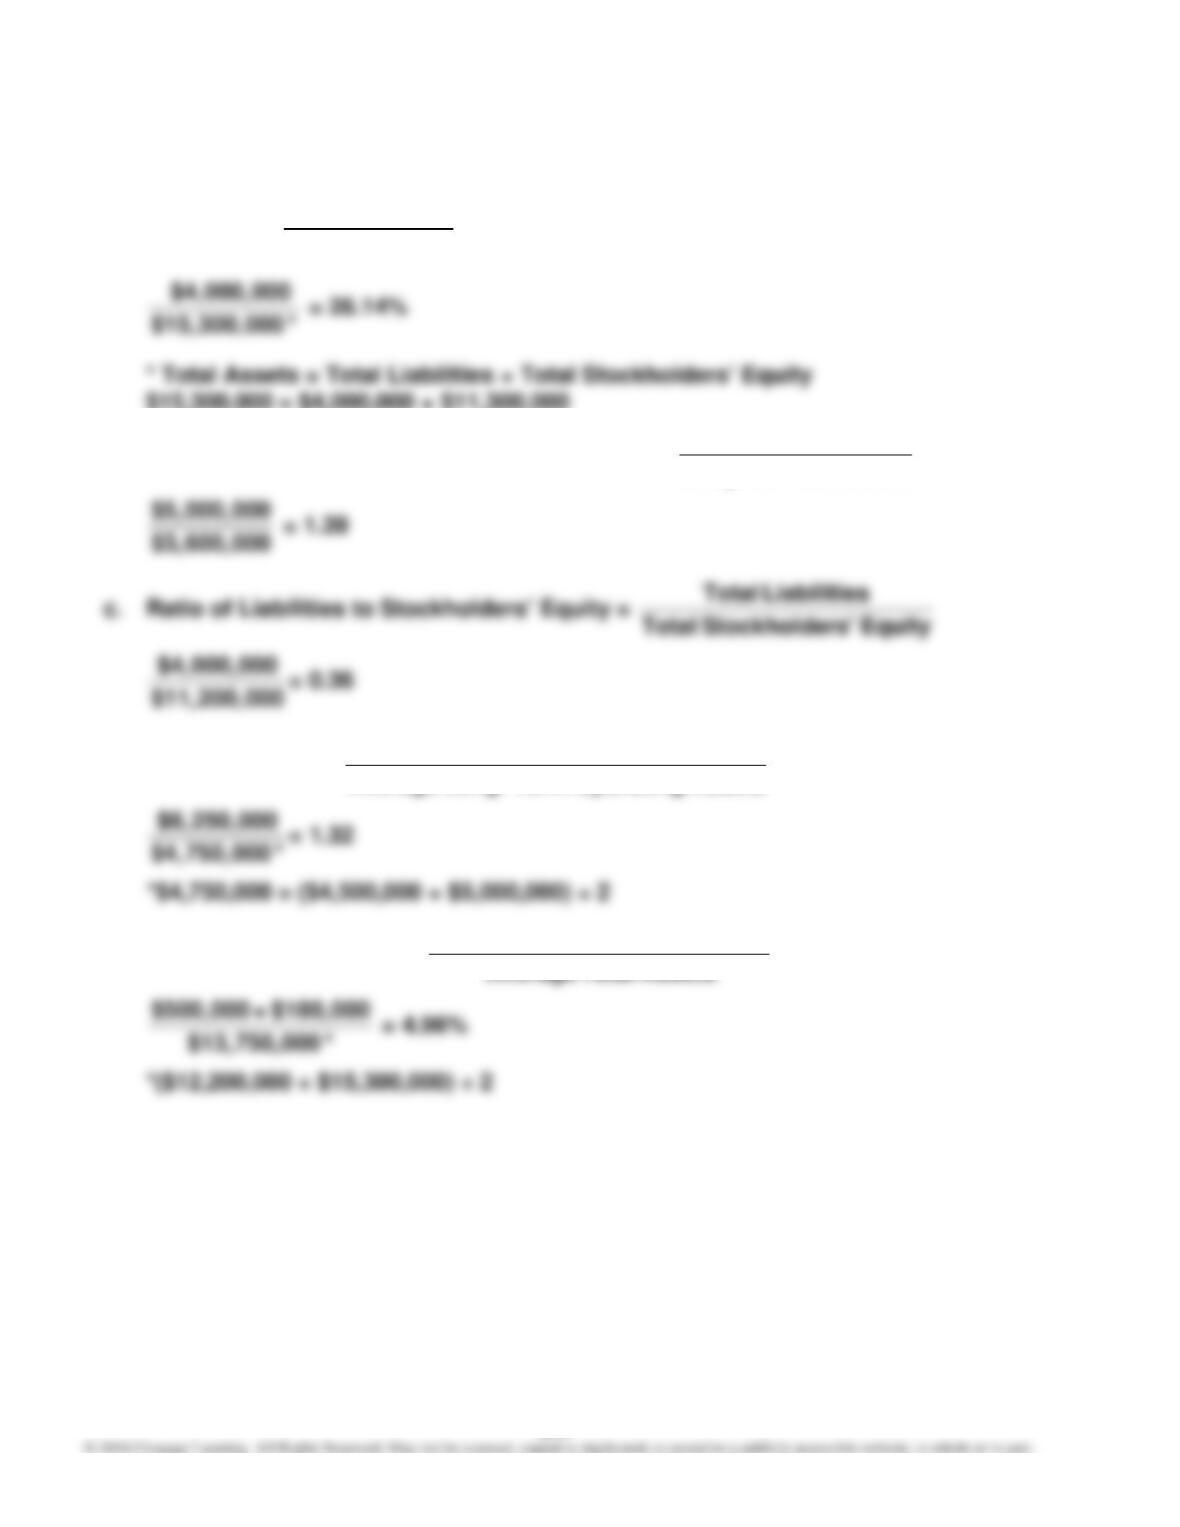
a. Debt ratio =
Total Liabilities
Total Assets
$15,300,000 = $4,000,000 + $11,300,000
b. Ratio of Fixed Assets to Long-Term Liabilities = sLiabilitie ermT–Long
AssetsFixed
d. Asset Turnover = Sales
Average Long– Term Operating Assets
e. Return on Total Assets = AssetsTotal Average
Expense Interest + Income Net
275
E9–19, Concluded
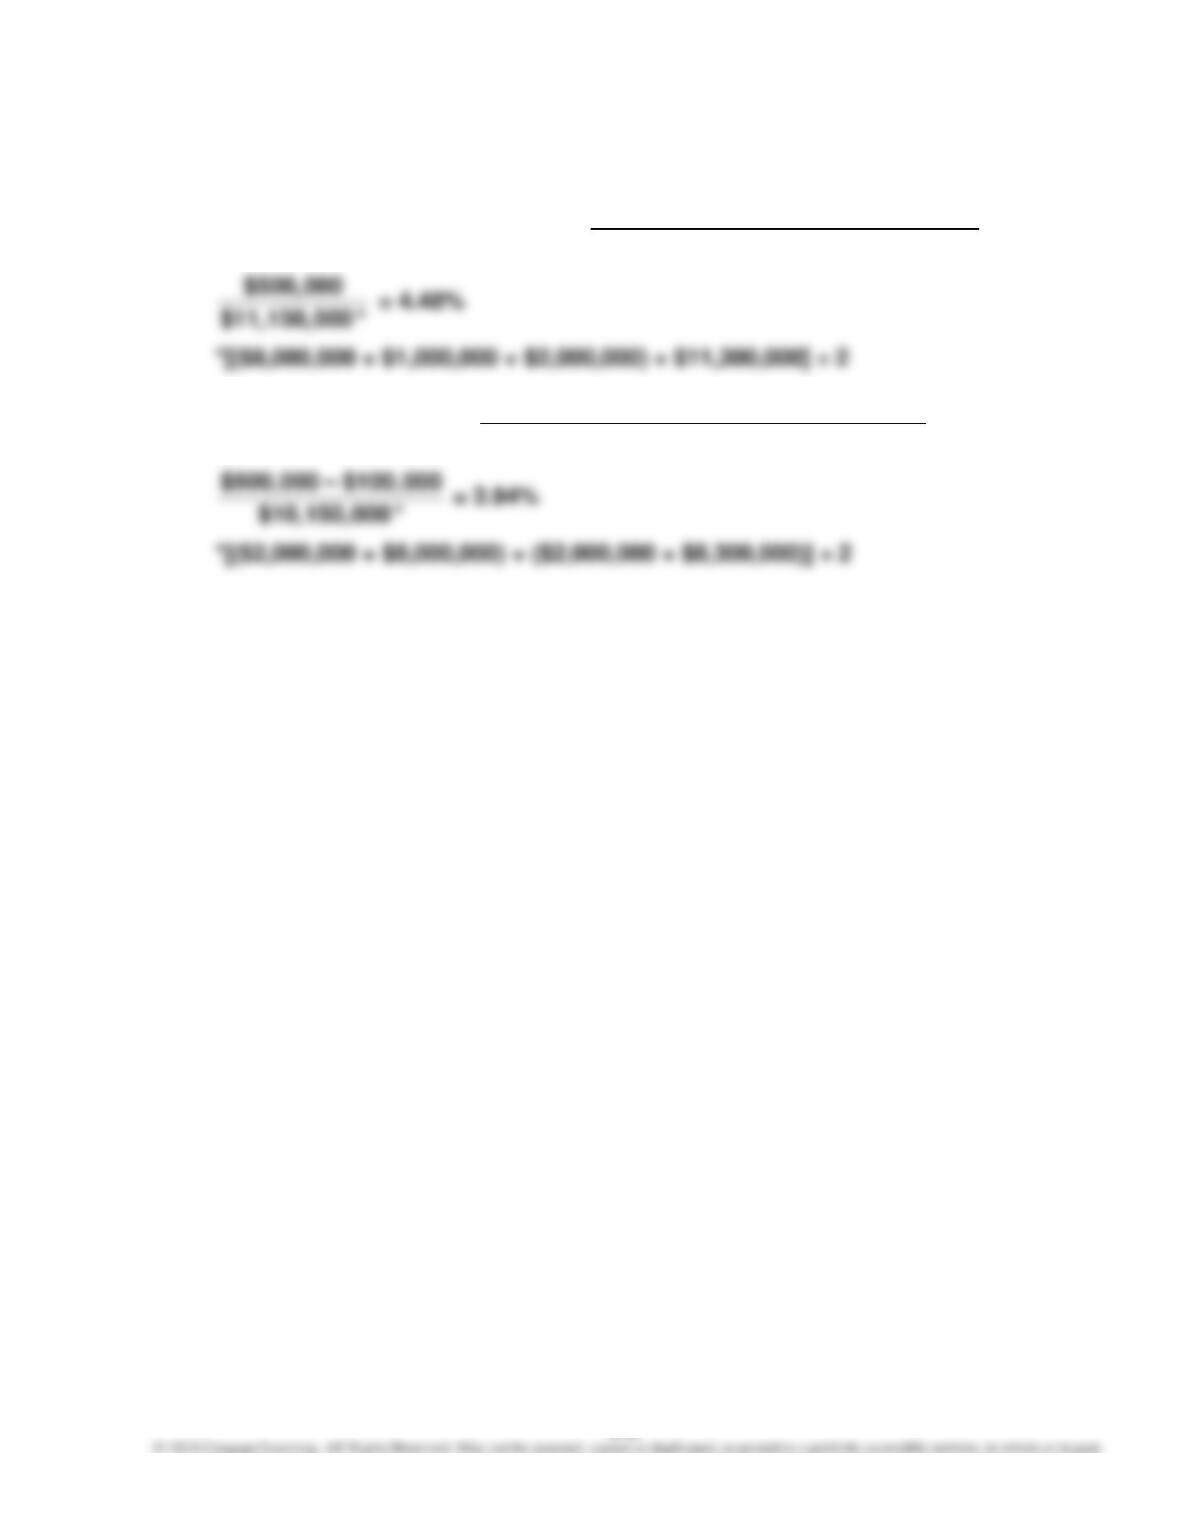
f. Return on Stockholders’ Equity = Net Income
A
verage Total Stockholders‘ Equity
g. Return on Common
Stockholders‘ Equity = Equity rs’Stockholde Common Average
Dividends Preferred–– Income Net
276
E9–20
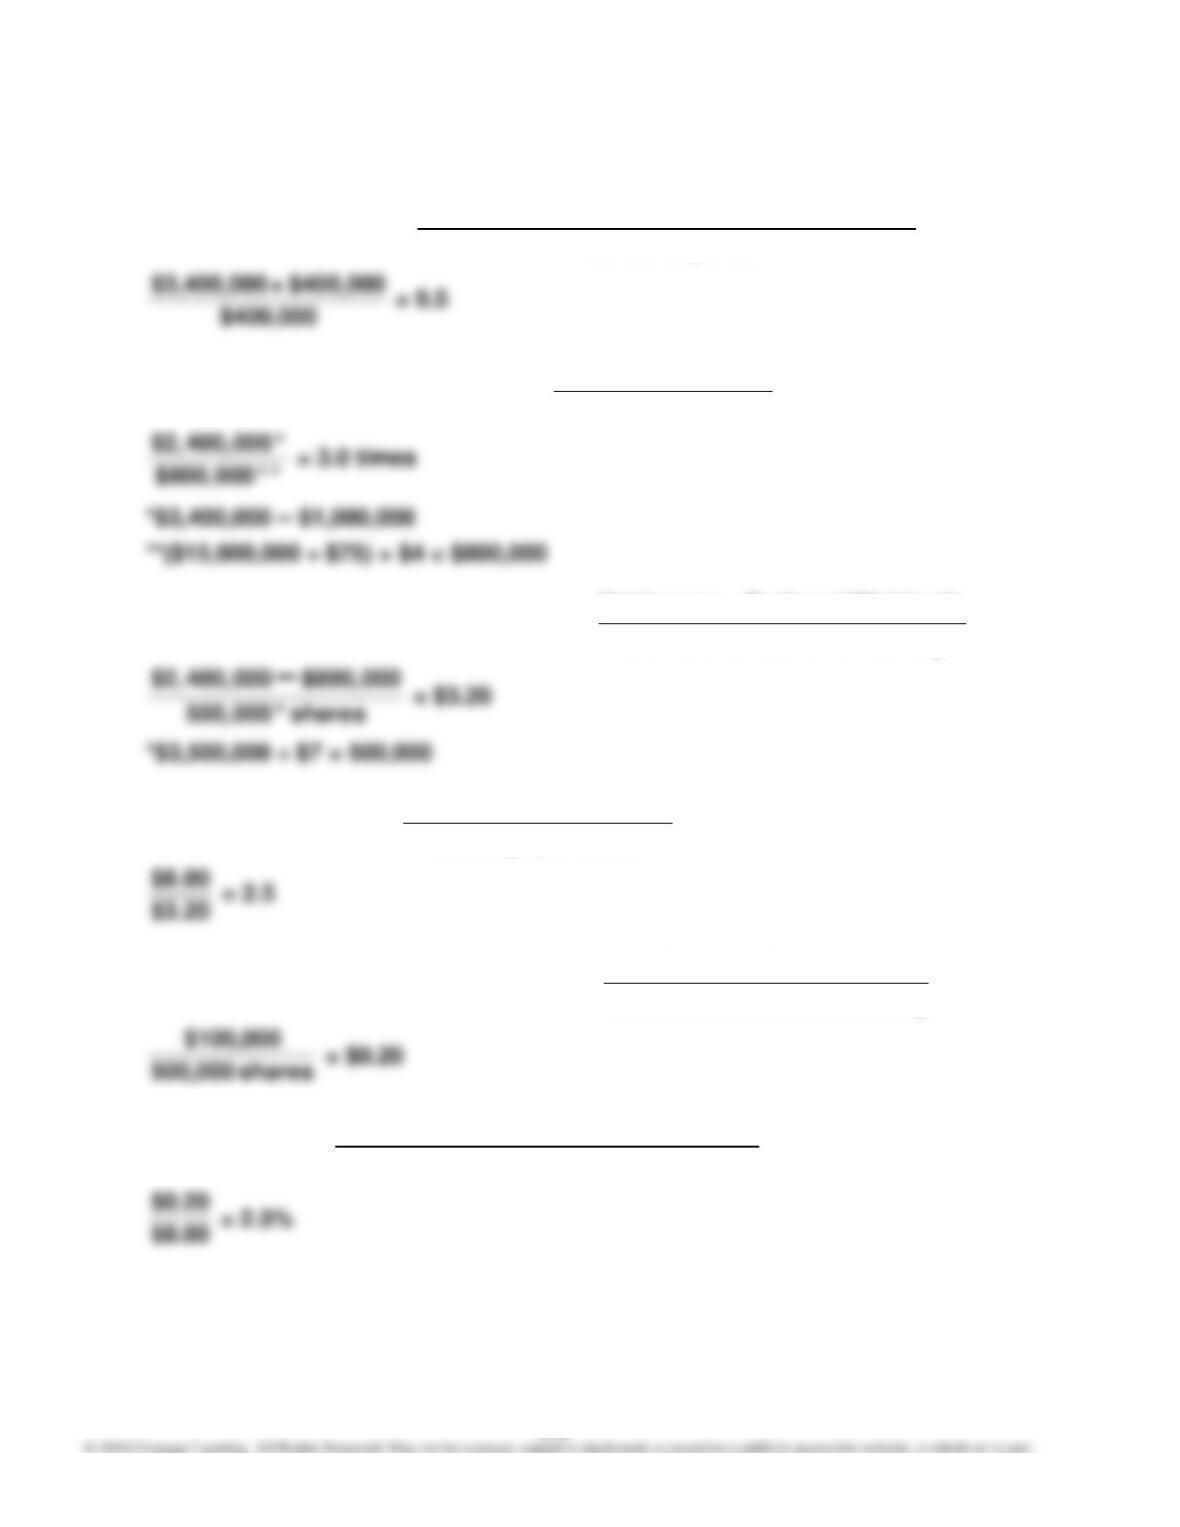
a. Times Interest Earned = Income Before Income Tax + Interest Expense
Interest Expense
b. Times Preferred Dividends Earned = Dividends Preferred
IncomeNet
c. Earnings per Share on Common Stock = Net Income –– Preferred Dividends
Common Shares Outstanding
d. Price-Earnings Ratio = Share per Earnings
Share per PriceMarket
e. Dividends per Share of Common Stock = gOutstandin Shares Common
Dividends Common
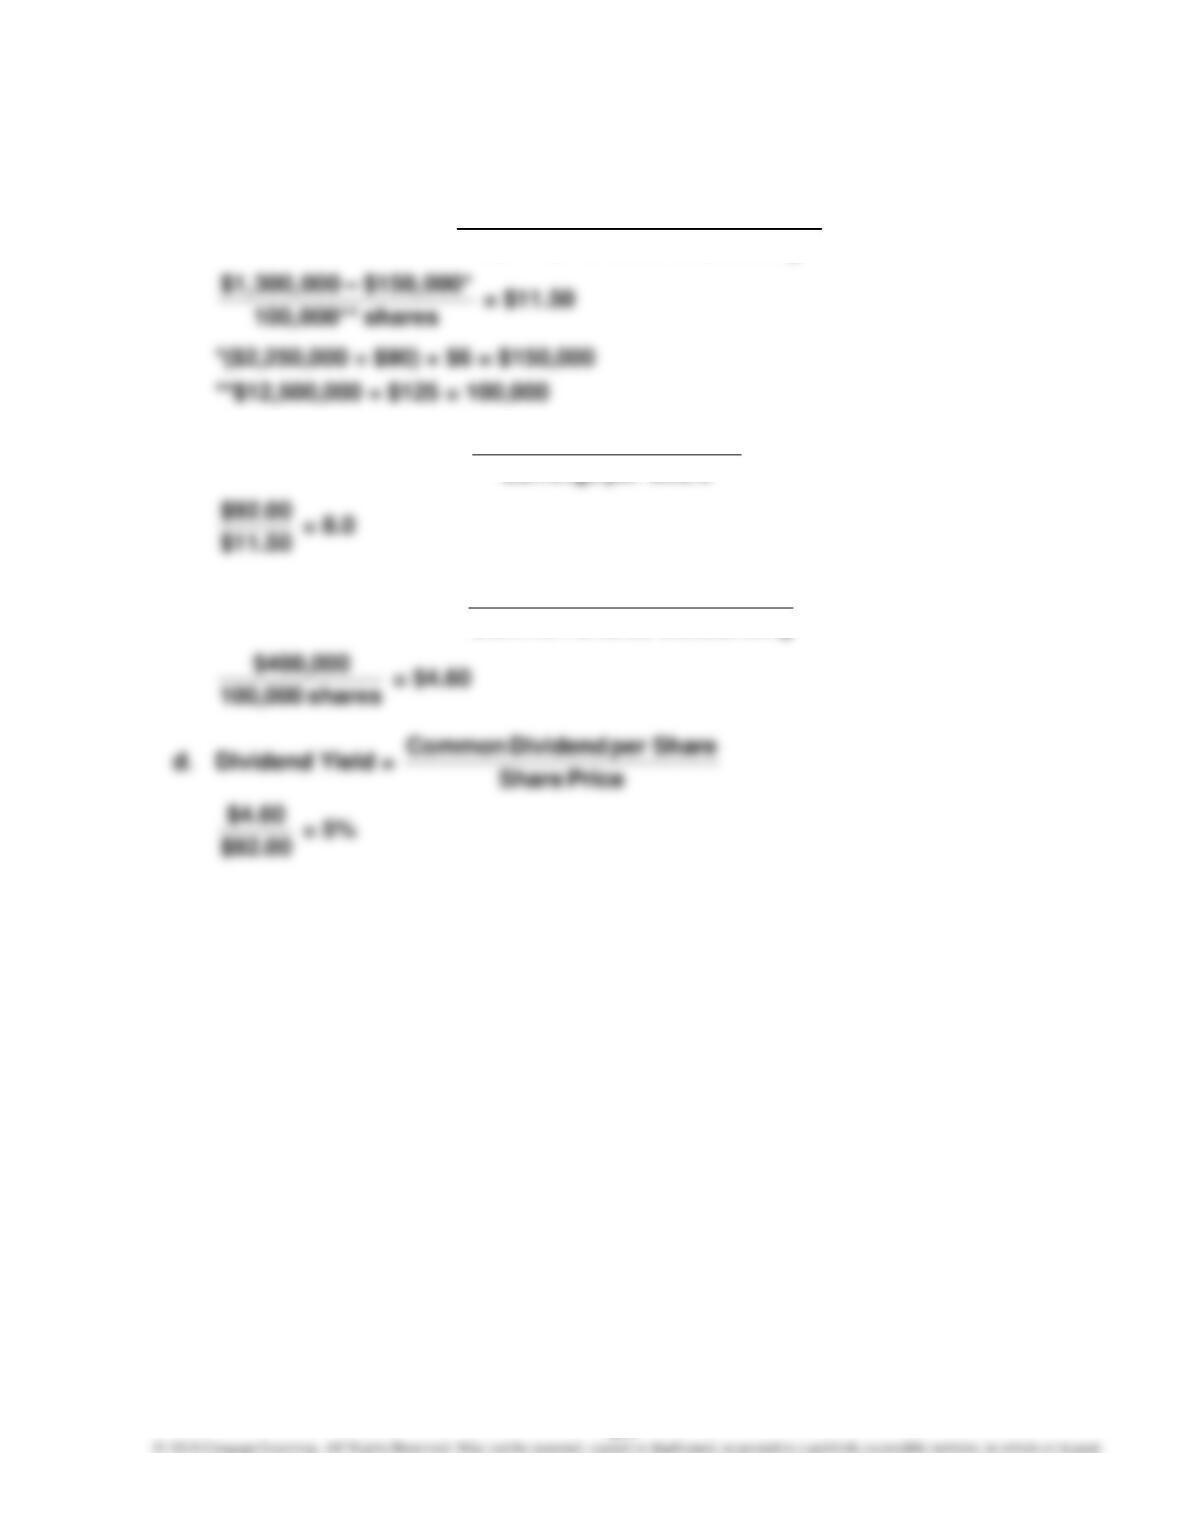
f. Dividend Yield = Dividends per Share of Common Stock
Market Price per Share
277
E9–21
a. Earnings per Share = Net Income –– Preferred Dividends
Common Shares Outstanding
b. Price-Earnings Ratio = Share per Earnings
Share per PriceMarket
c. Dividends per Share = gOutstandin Shares Common
Dividends Common
278
E9–22
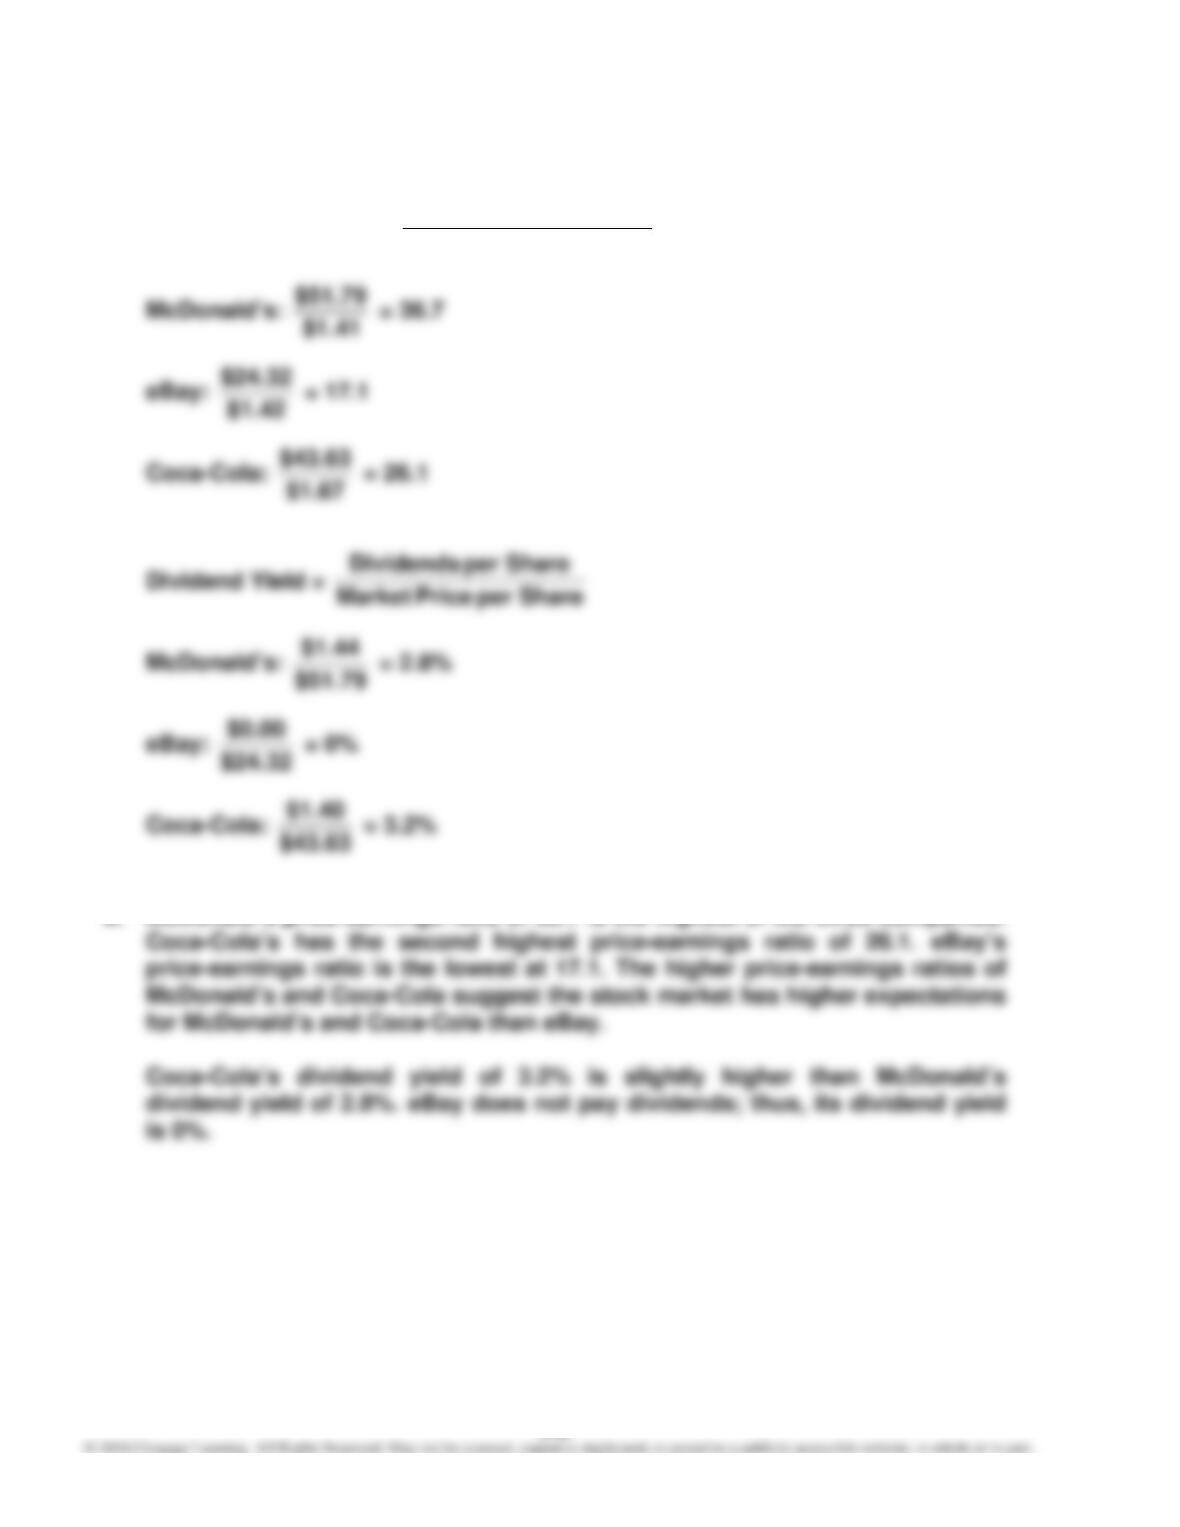
a. Price-Earnings Ratio = Share per Earnings
Share per PriceMarket
b. McDonald’s price-earnings ratio of 36.7 is the highest of the three companies.
Appendix E9–23
Appendix E9–24
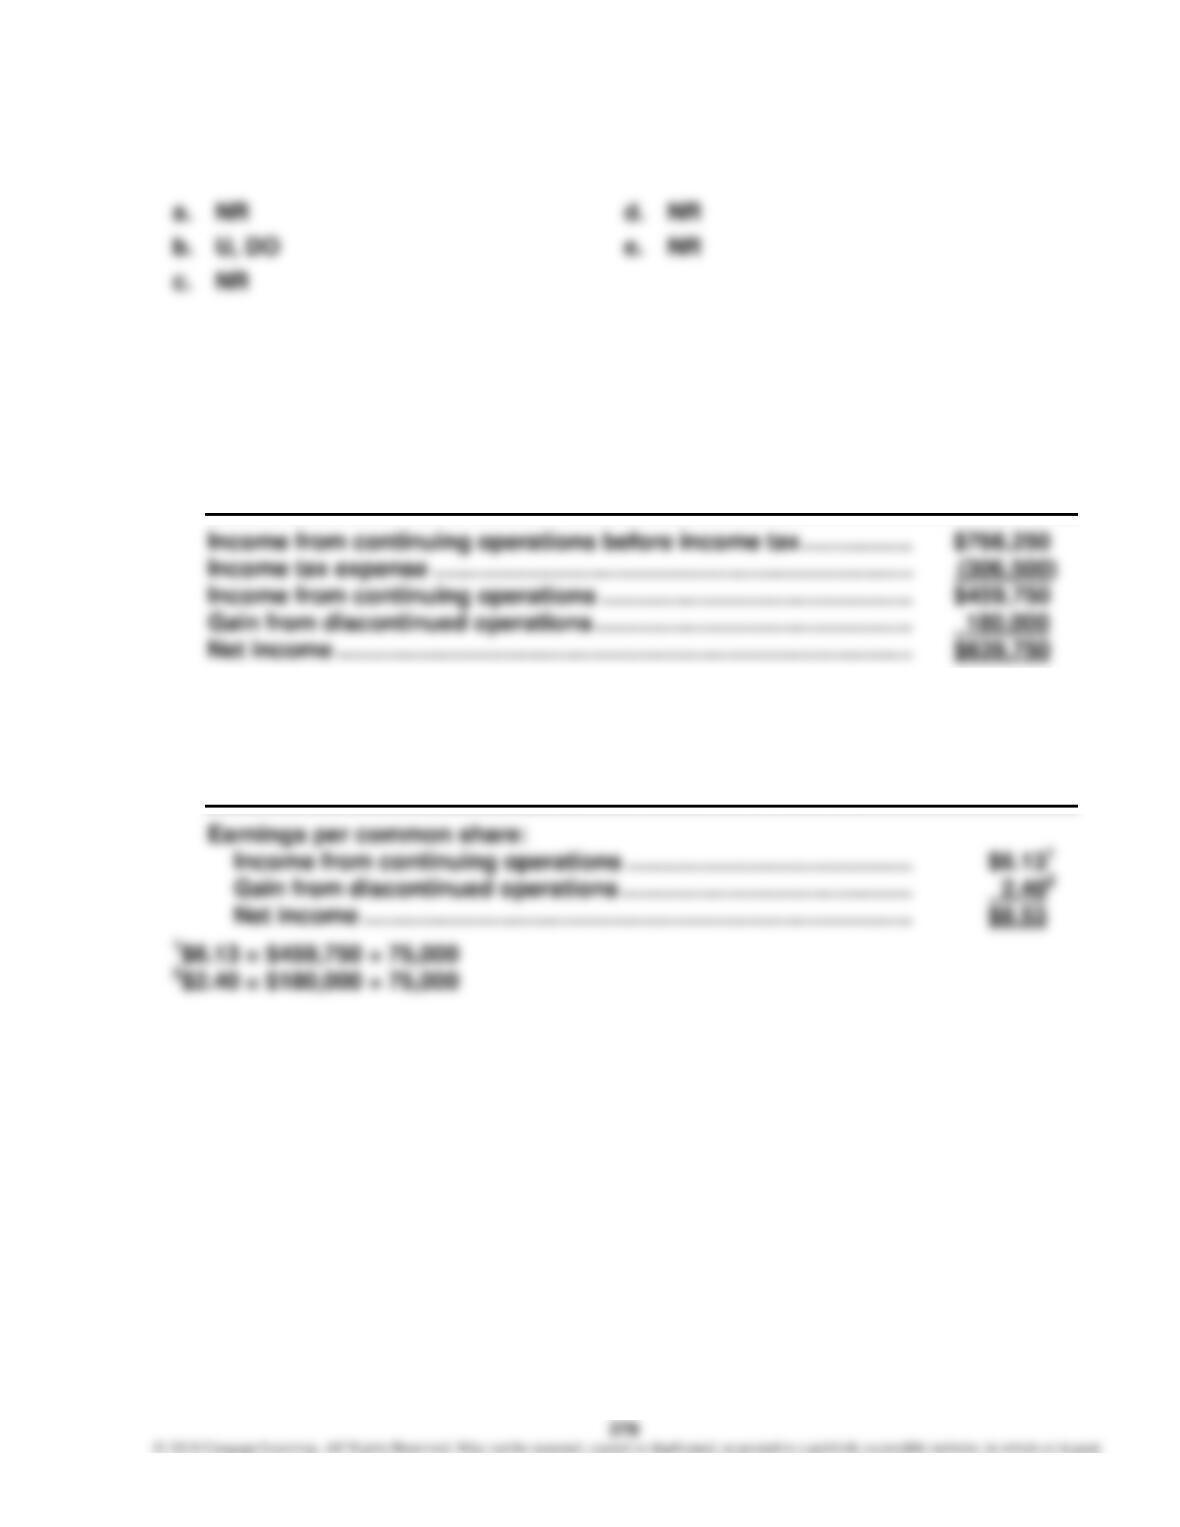
a.
LEADBETTER INC.
Partial Income Statement
For the Year Ended December 31, 20Y3
b.
LEADBETTER INC.
Partial Income Statement
For the Year Ended December 31, 20Y3
280
PROBLEMS
P9–1
1.
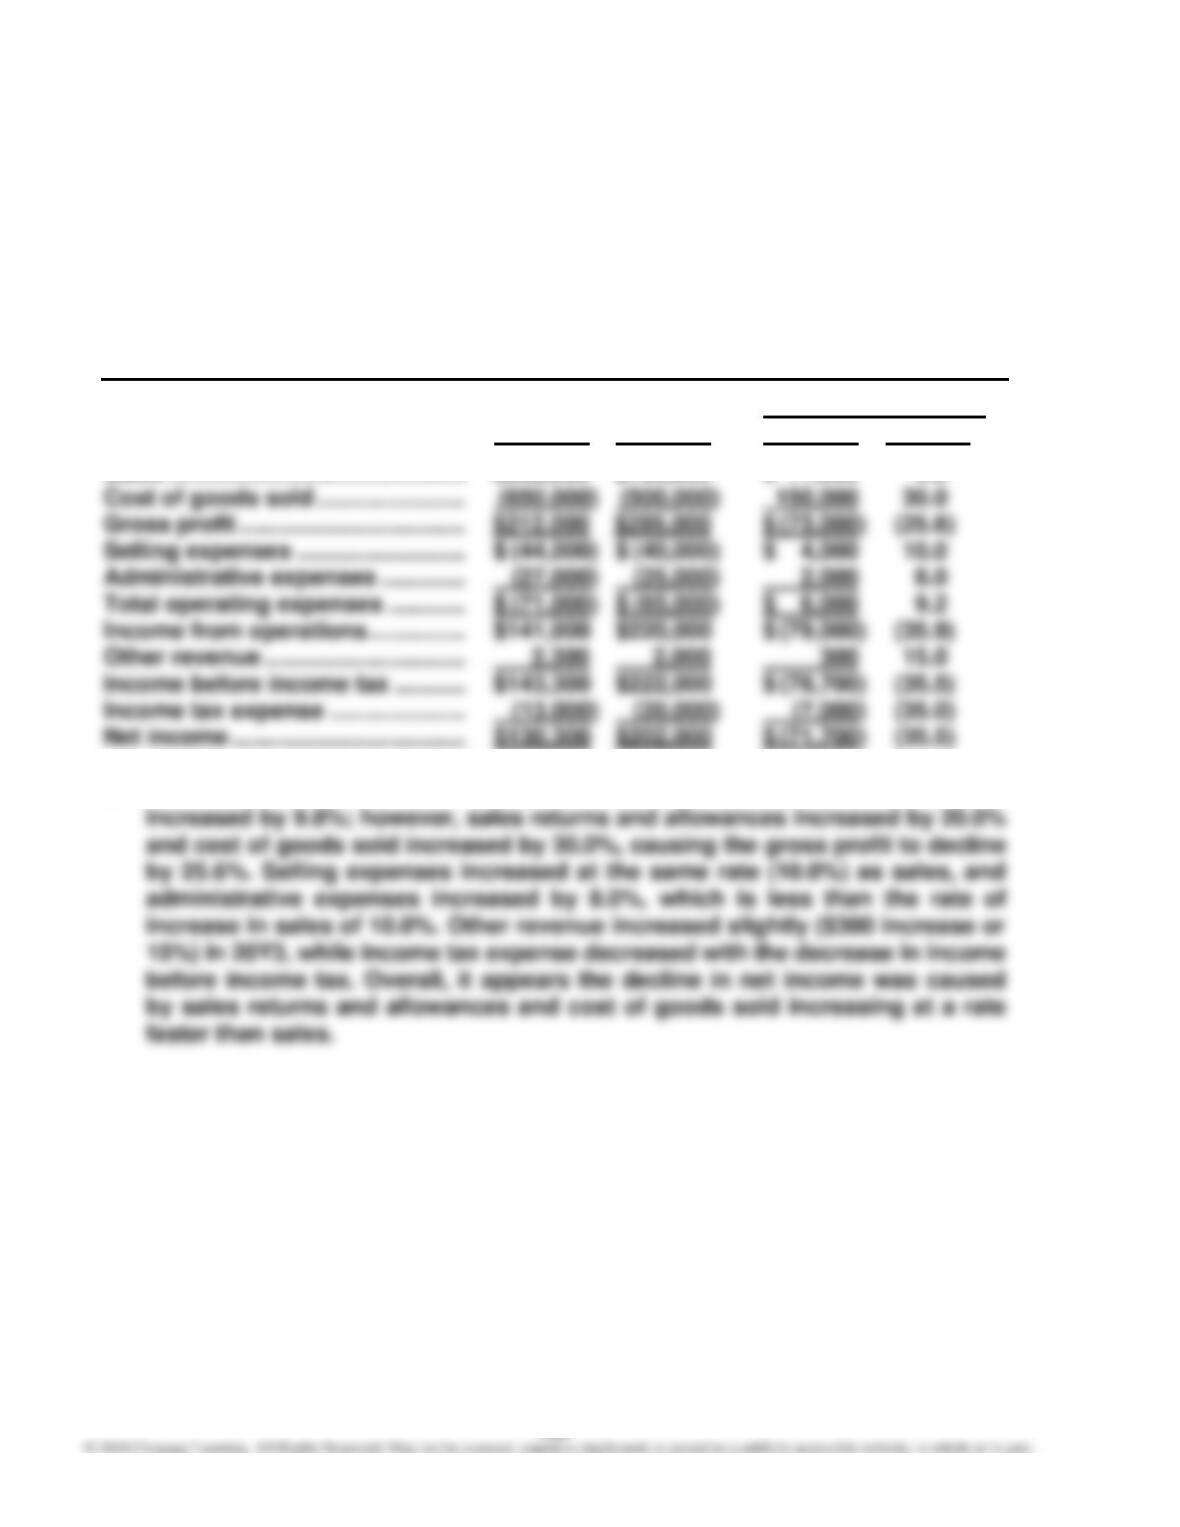
GREYHOUND TECHNOLOGY COMPANY
Comparative Income Statement
For the Years Ended December 31, 20Y3 and 20Y2
Increase (Decrease)
20Y3
20Y2 Amount Percent
Sales ………………………………………. $862,000 $785,000 $ 77,000 9.8
2. Net income declined from $202,000 in 20Y2 to $130,300 in 20Y3. Sales
281
P9–2
1.
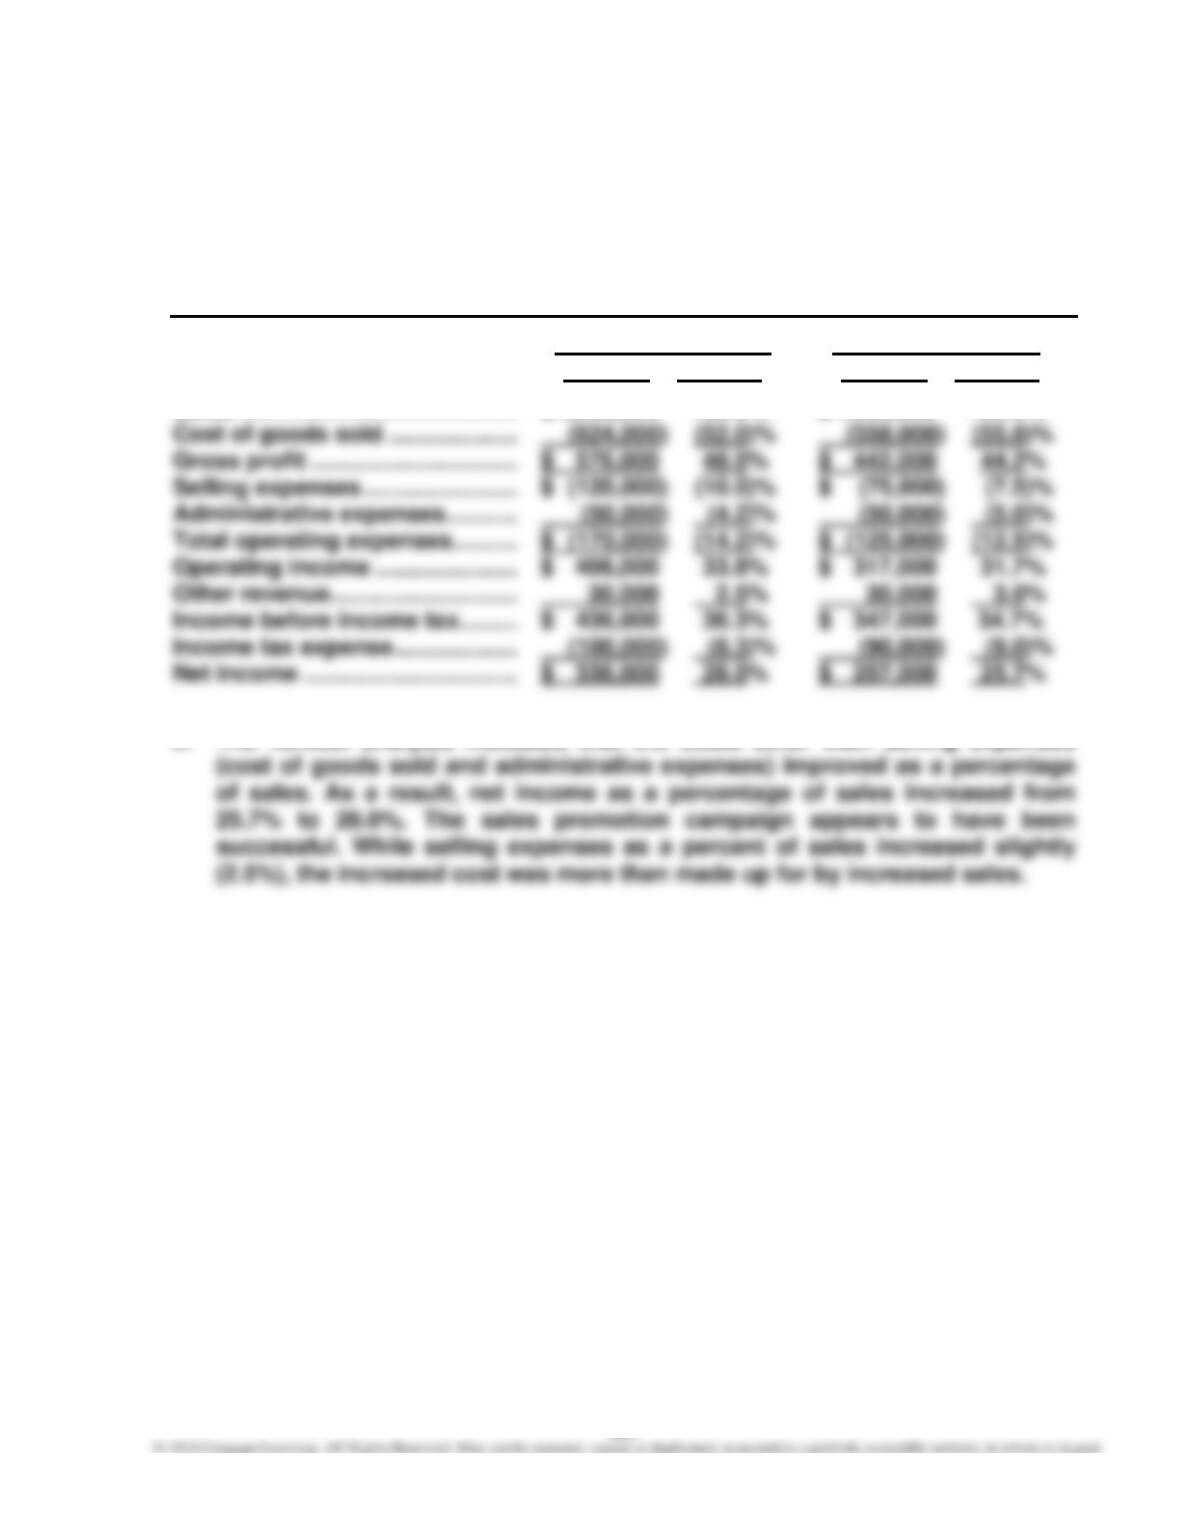
FISHING EXPERIENCES INC.
Comparative Income Statement
For the Years Ended December 31, 20Y6 and 20Y5
20Y6 20Y5
Amount Percent Amount Percent
Sales ……………………………………. $ 1,200,000 100.0% $ 1,000,000 100.0%
2. The vertical analysis indicates that the costs other than selling expenses
282
P9–3
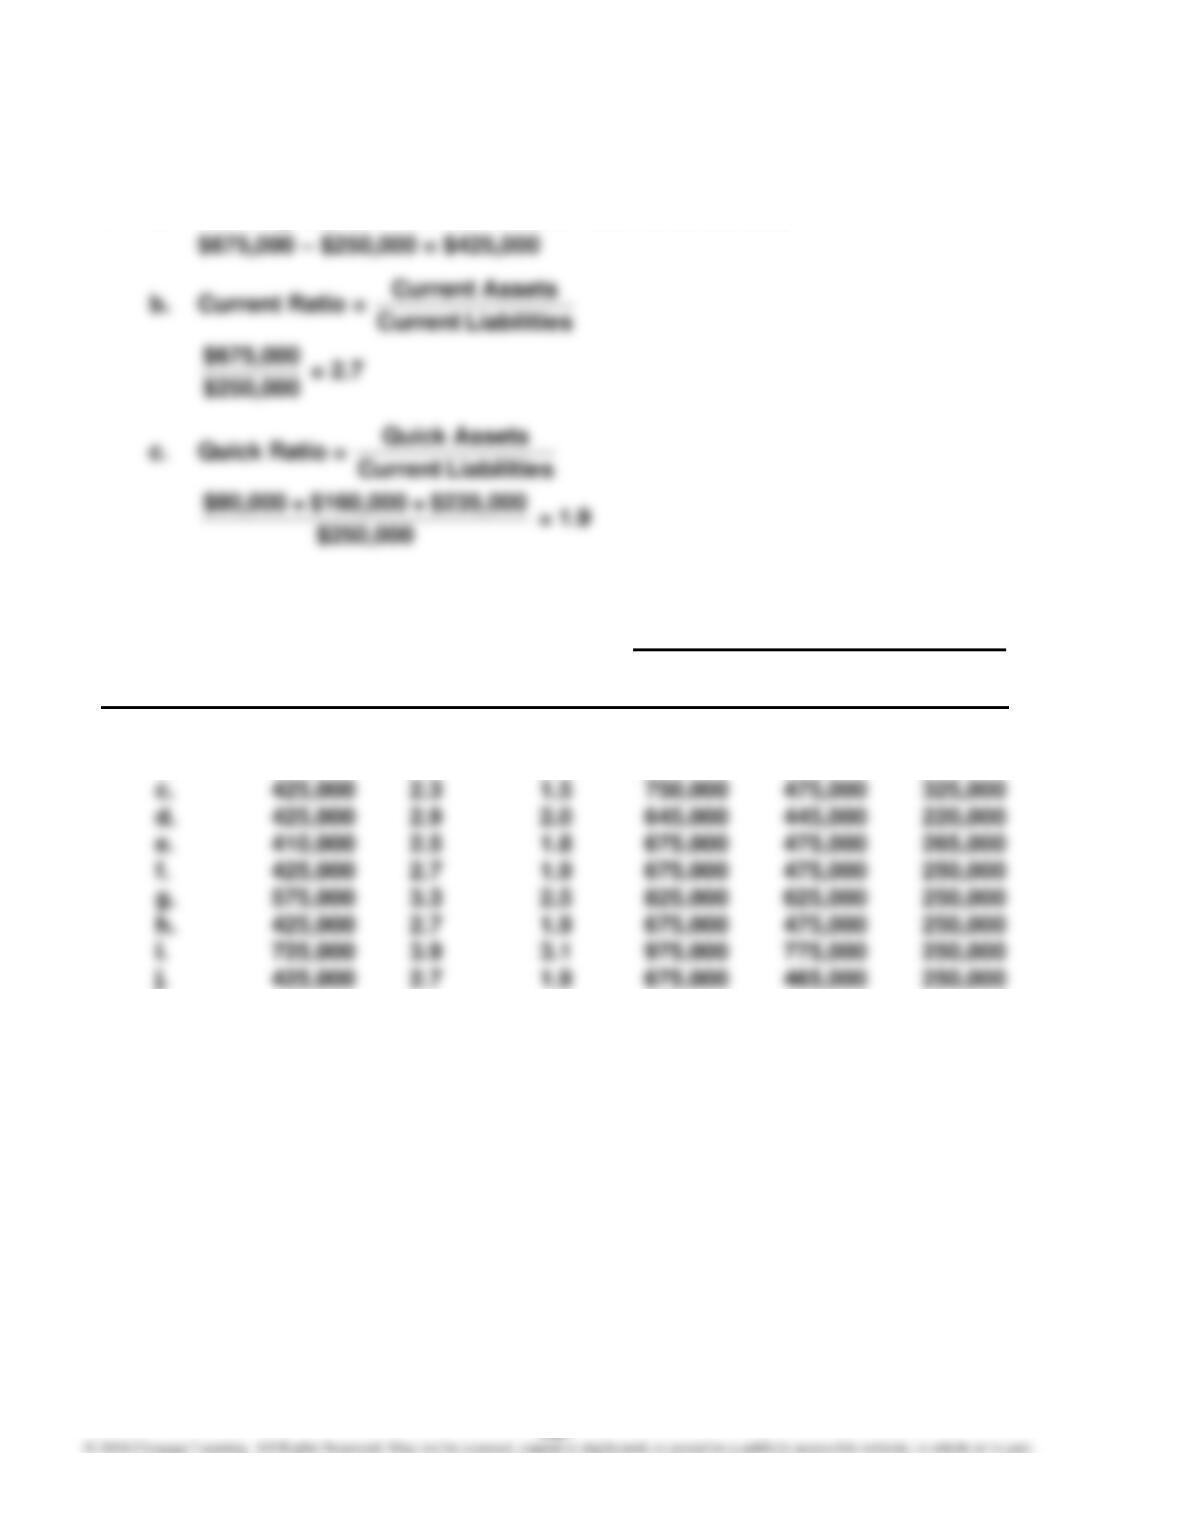
1. a. Working Capital = Current Assets – Current Liabilities
2.
Supporting Calculations
Working Current Quick Current Quick Current
Transaction Capital Ratio Ratio Assets Assets Liabilities
a. $ 425,000 2.7 1.9 $675,000 $ 475,000 $250,000
b. 425,000 3.0 2.1 635,000 435,000 210,000