264
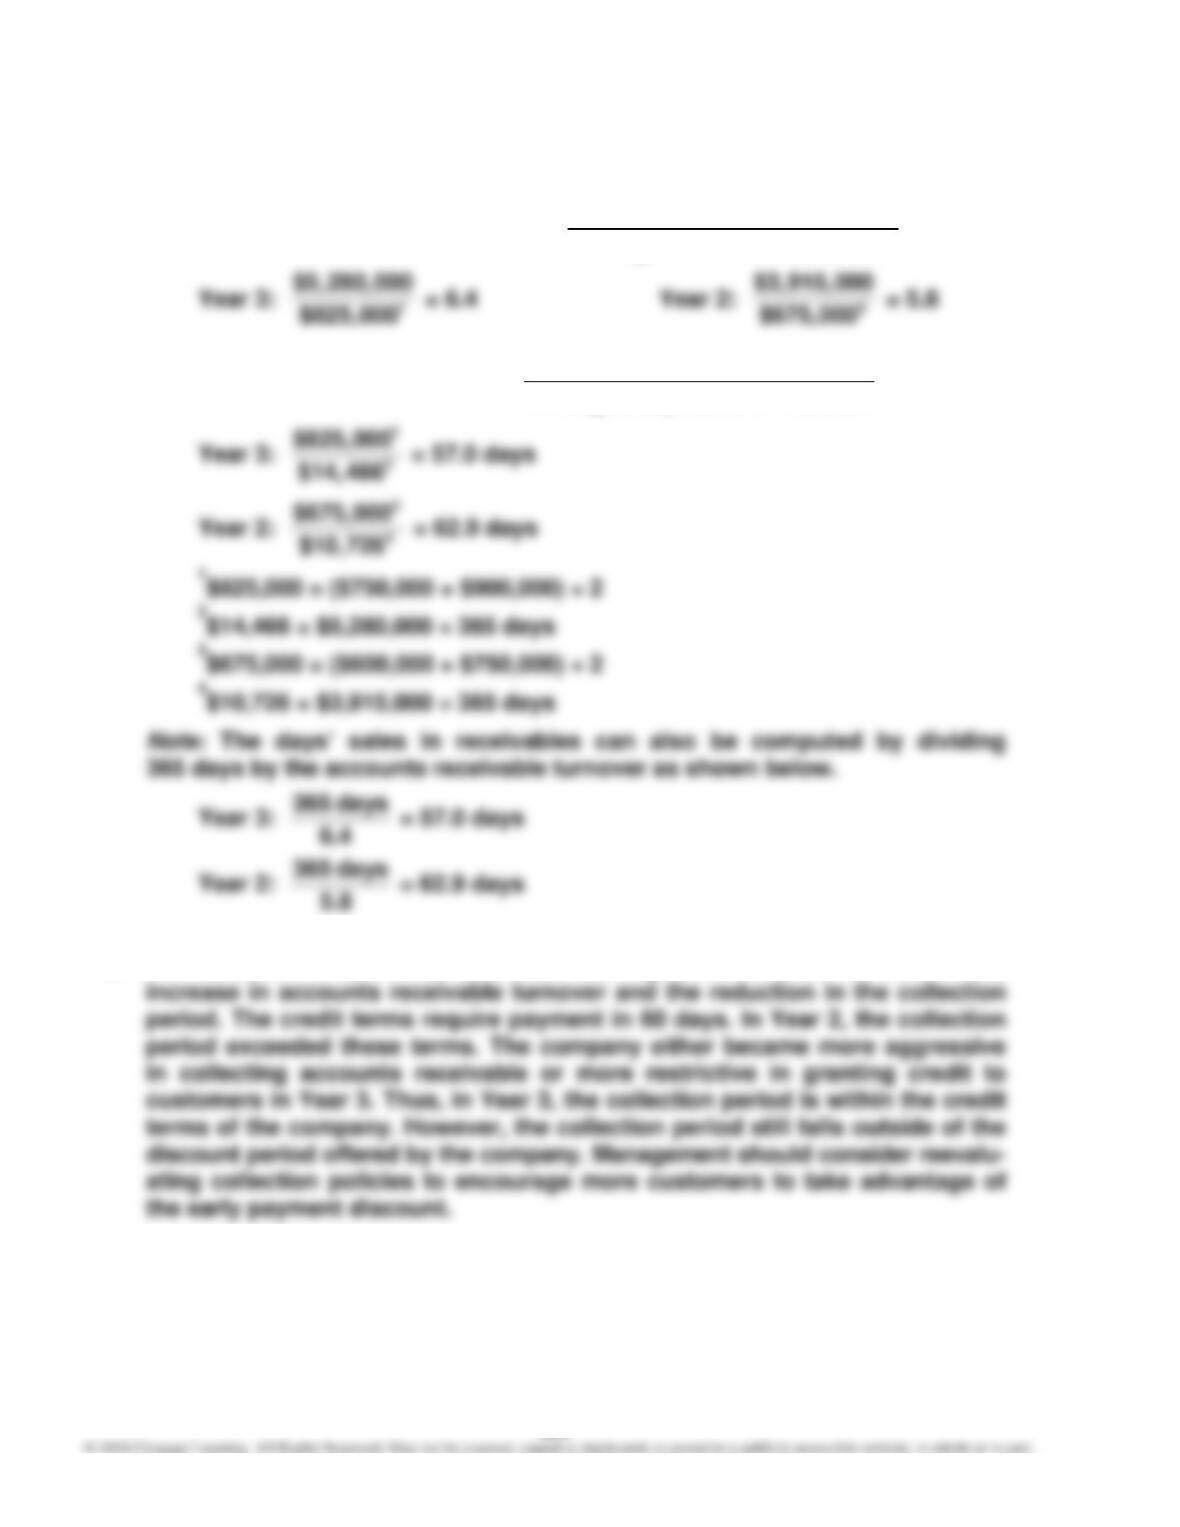
E9–9
a. (1) Accounts Receivable Turnover = Sales
A
verage Accounts Receivable
(2) Days’ Sales in Receivables = Accounton Sales Daily Average
Receivable AccountsAverage
b. The collection of accounts receivable has improved. This can be seen in the
265
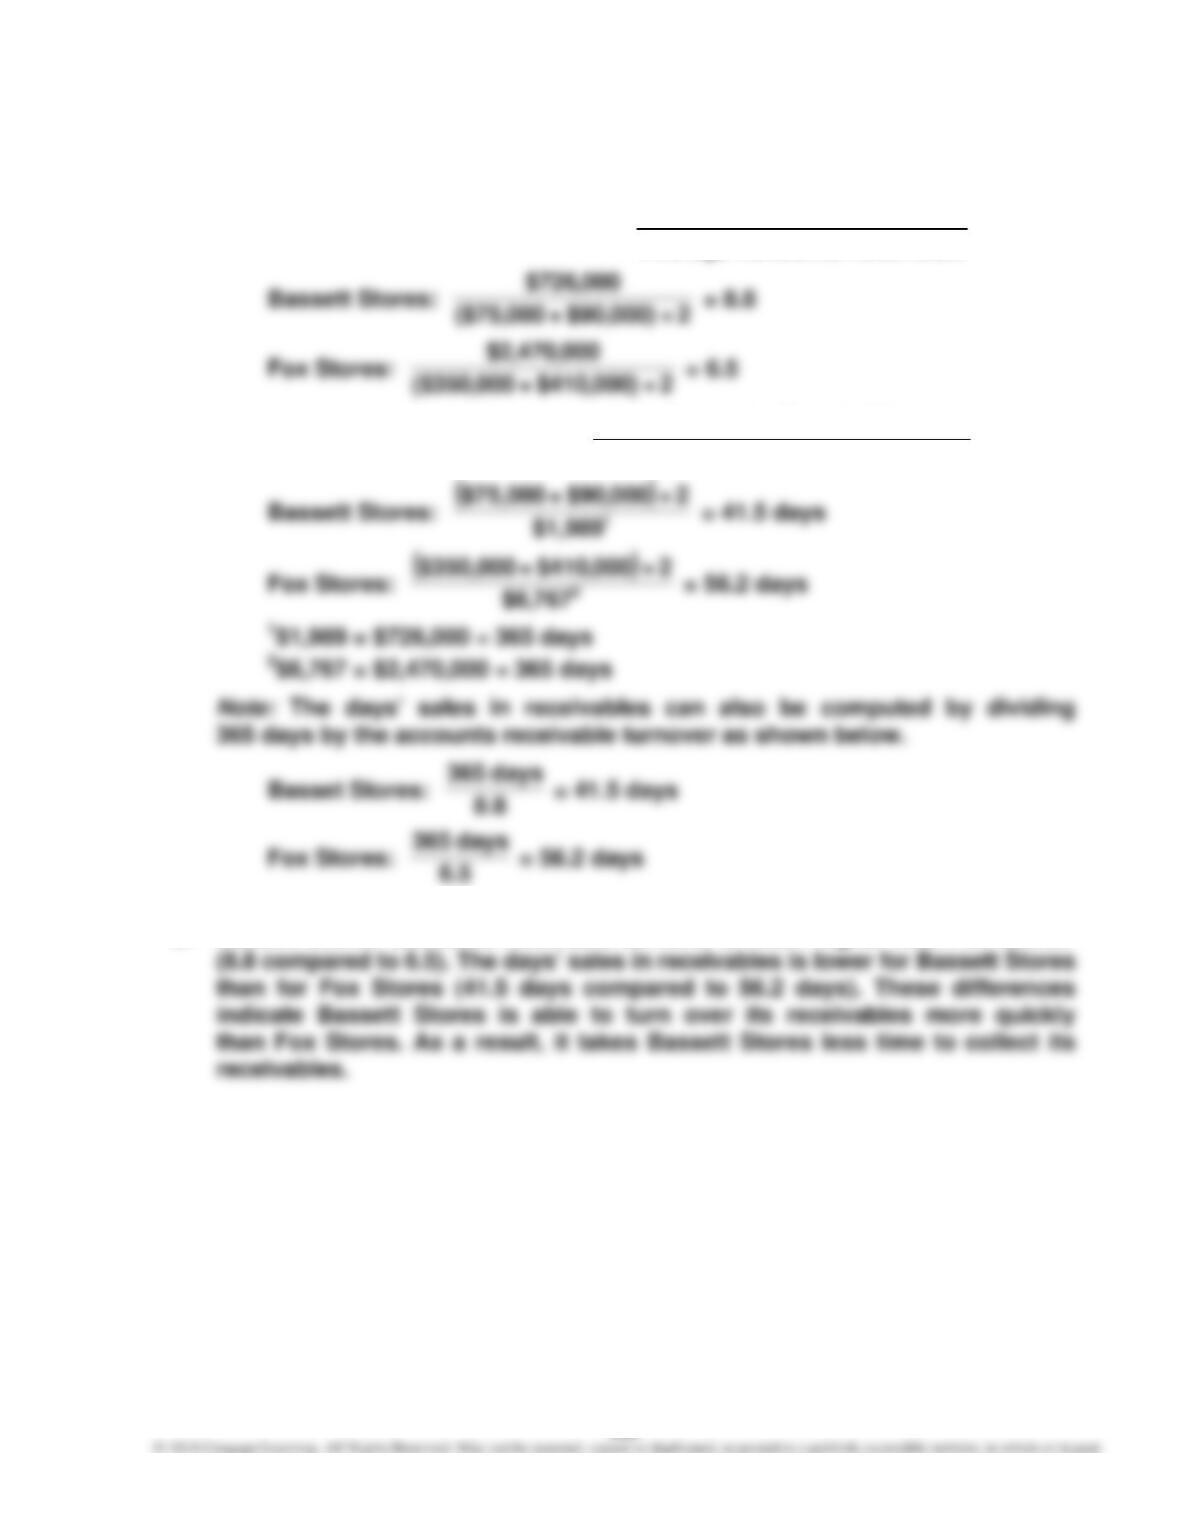
E9–10
a. (1) Accounts Receivable Turnover = Sales
A
verage Accounts Receivable
(2) Days’ Sales in Receivables = Accounton Sales Daily Average
Receivable Accounts
b. Bassett Stores’ accounts receivable turnover is much higher than Fox Stores’
266
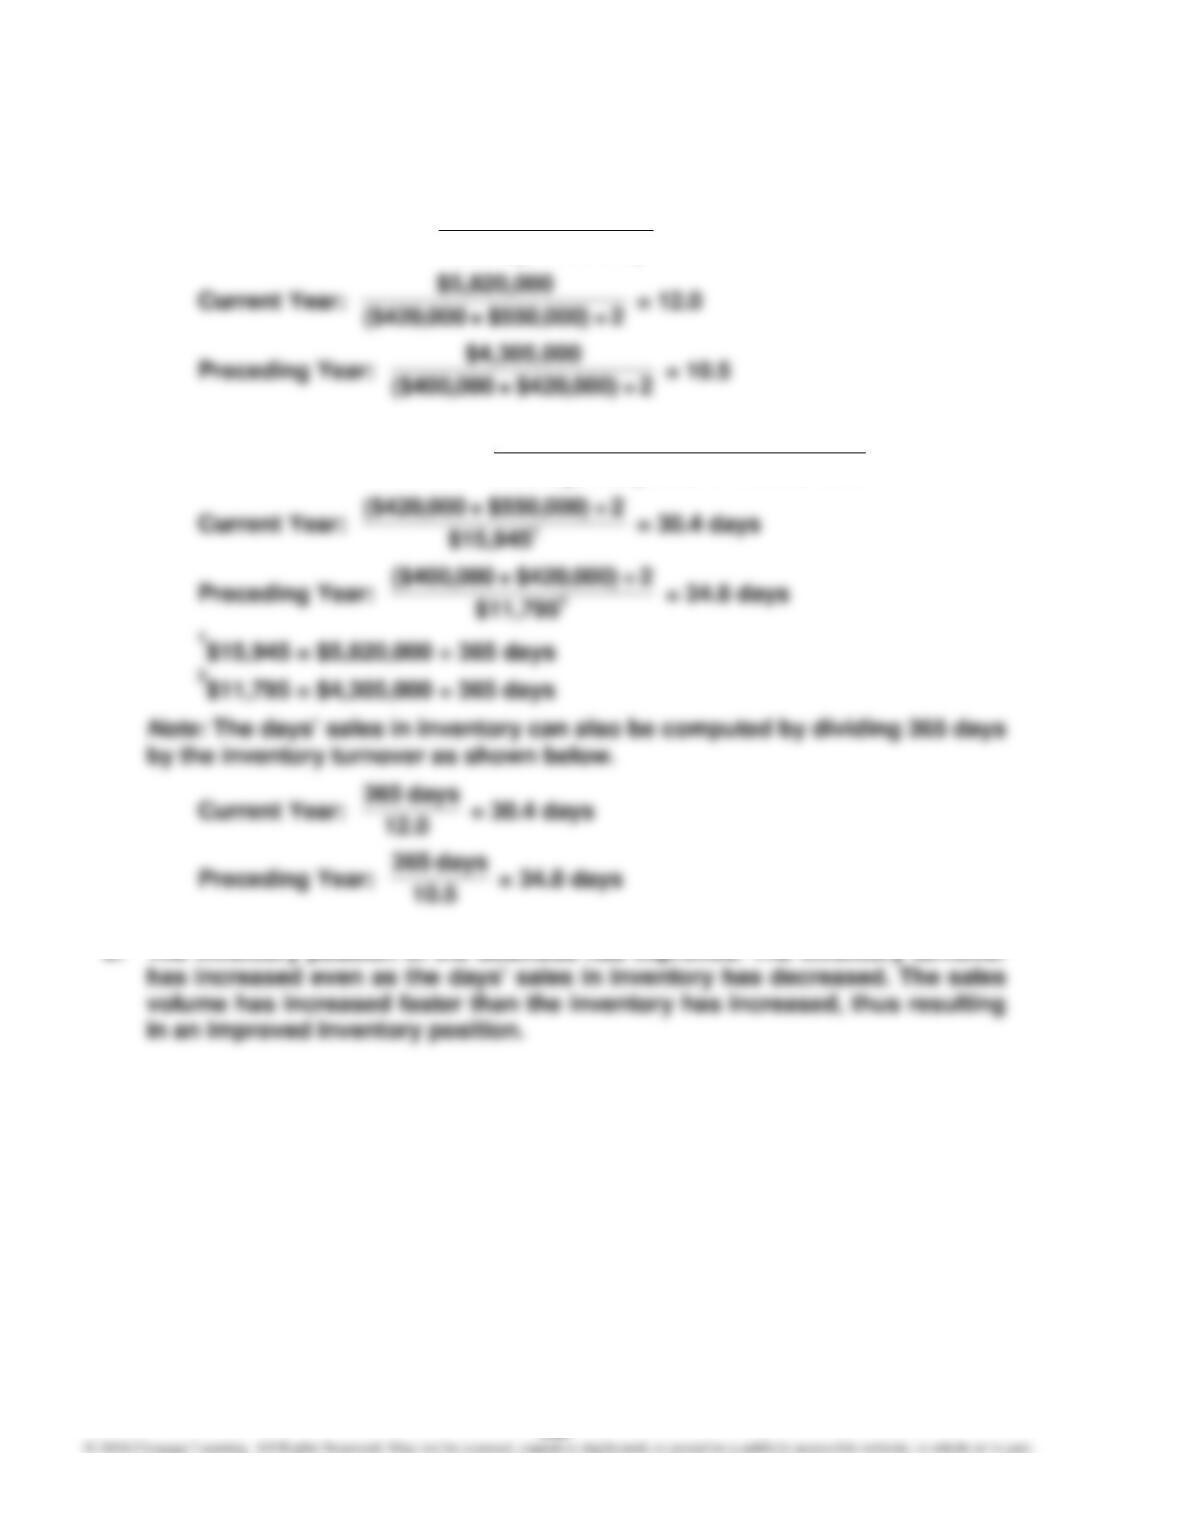
E9–11
a. (1) Inventory Turnover = Inventory Average
Sold Goods ofCost
(2) Days’ Sales in Inventory = Sold Goods ofCost Daily Average
Inventory Average
b. The inventory position of the business has improved. The inventory turnover
267
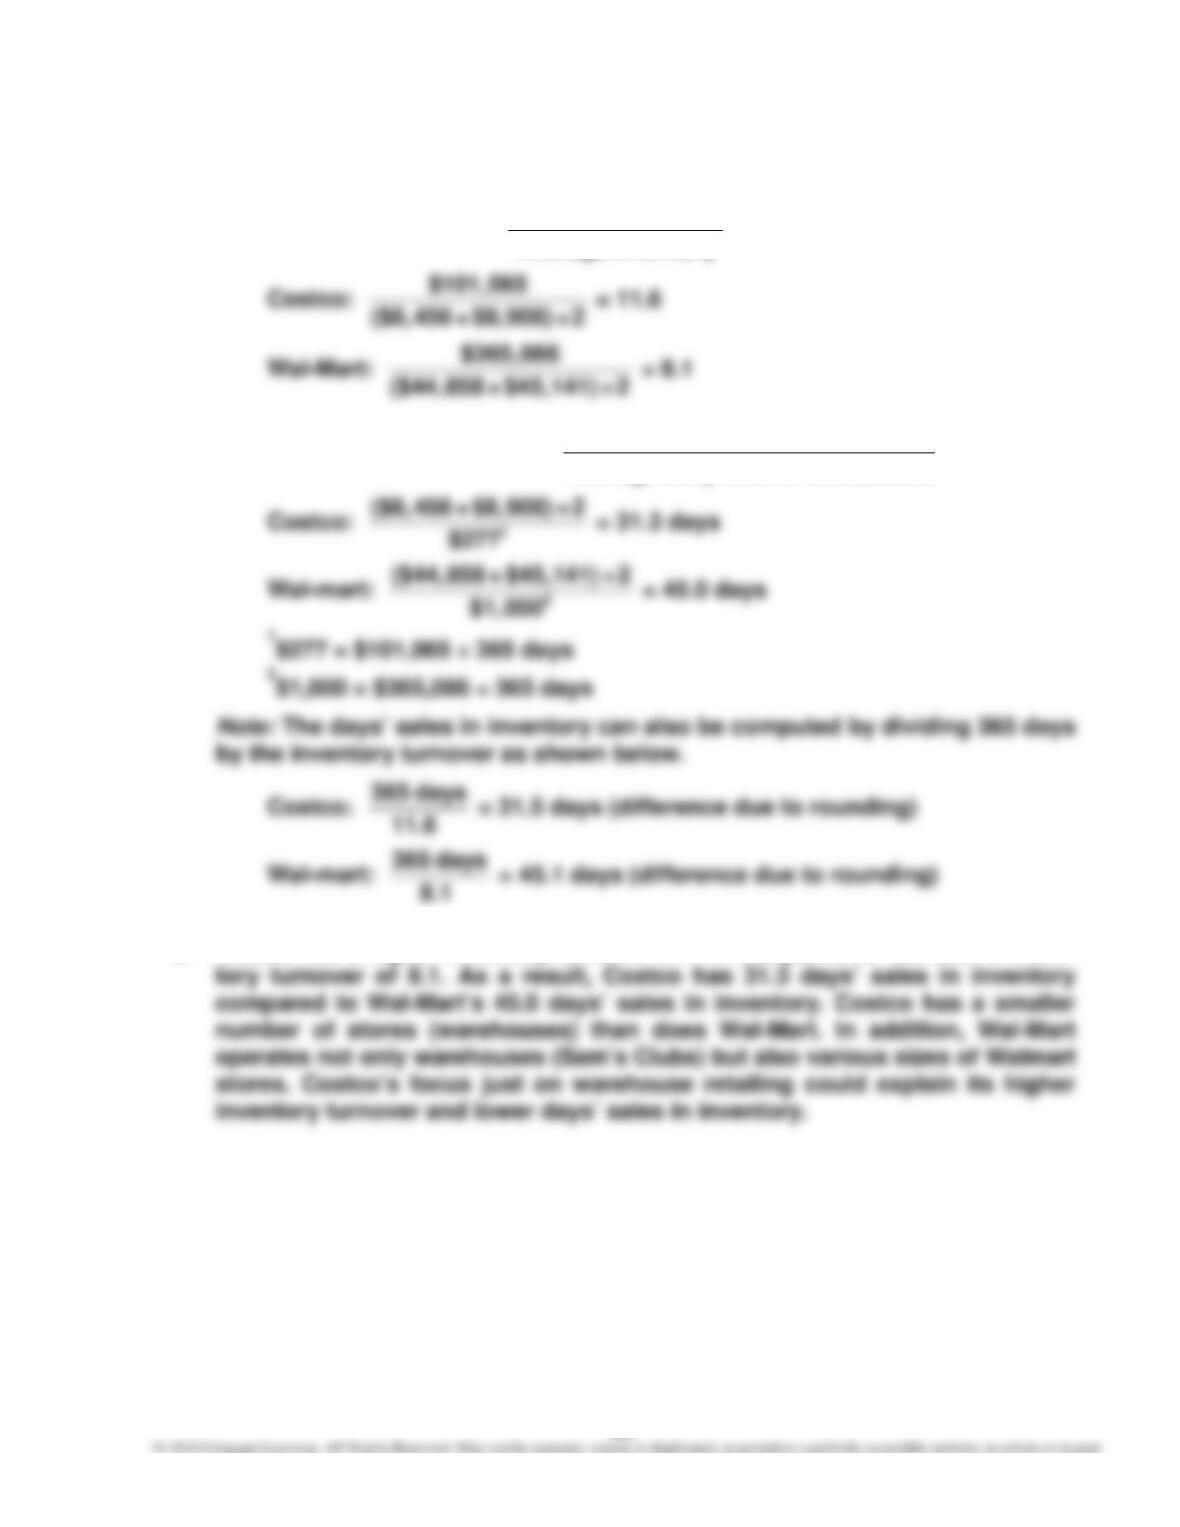
E9–12
a. (1) Inventory Turnover = Inventory Average
Sold Goods ofCost
(2) Days’ Sales in Inventory = Sold Goods ofCost Daily Average
Inventory Average
b. Costco has a higher inventory turnover of 11.6 compared to Wal-Mart’s inven-
268
E9–13
a. Ratio of Liabilities to Stockholders’ Equity = Total Liabilities
Total Stockholders’ Equity
b. Times Interest Earned = ExpenseInterest
ExpenseInterest + Tax Before Income
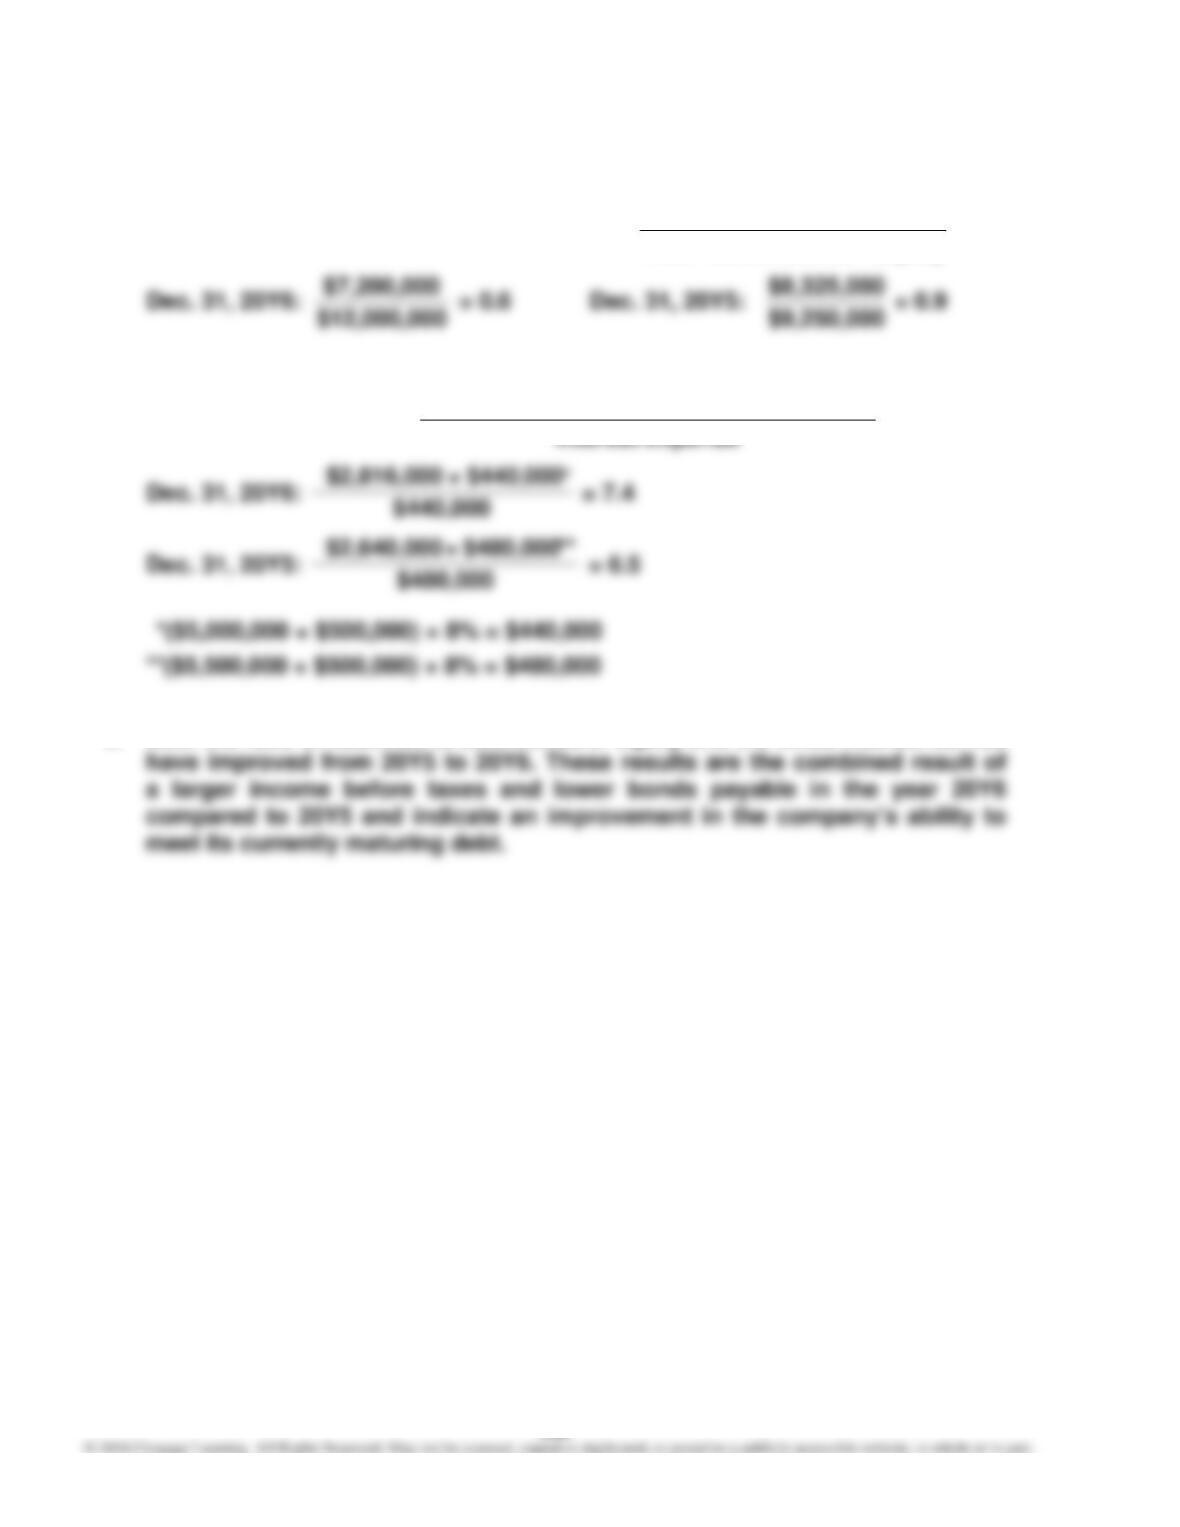
c. Both the ratio of liabilities to stockholders’ equity and the times interest earned
269
E9–14
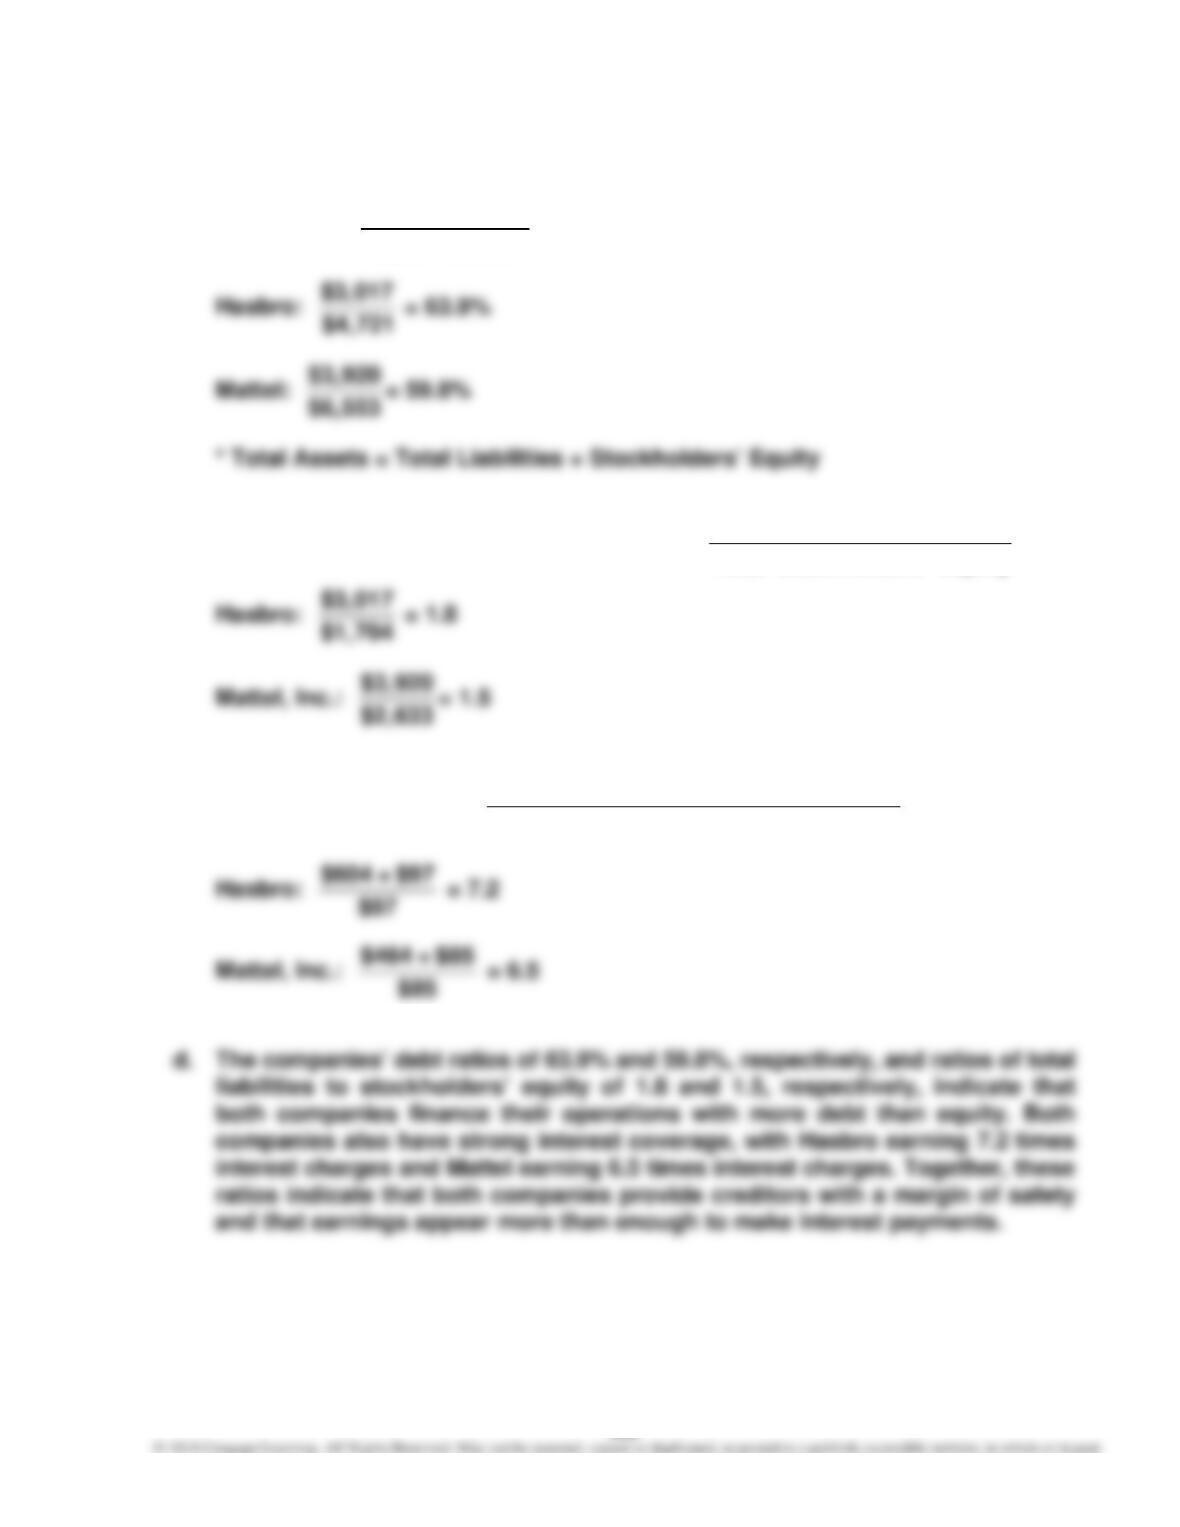
a. Debt Ratio = Total Liabilities
Total Assets*
b. Ratio of Liabilities to Stockholders’ Equity = Equity rs’Stockholde Total
sLiabilitie Total
c. Times Interest Earned = ExpenseInterest
ExpenseInterest + Tax Before Income
270
E9–15
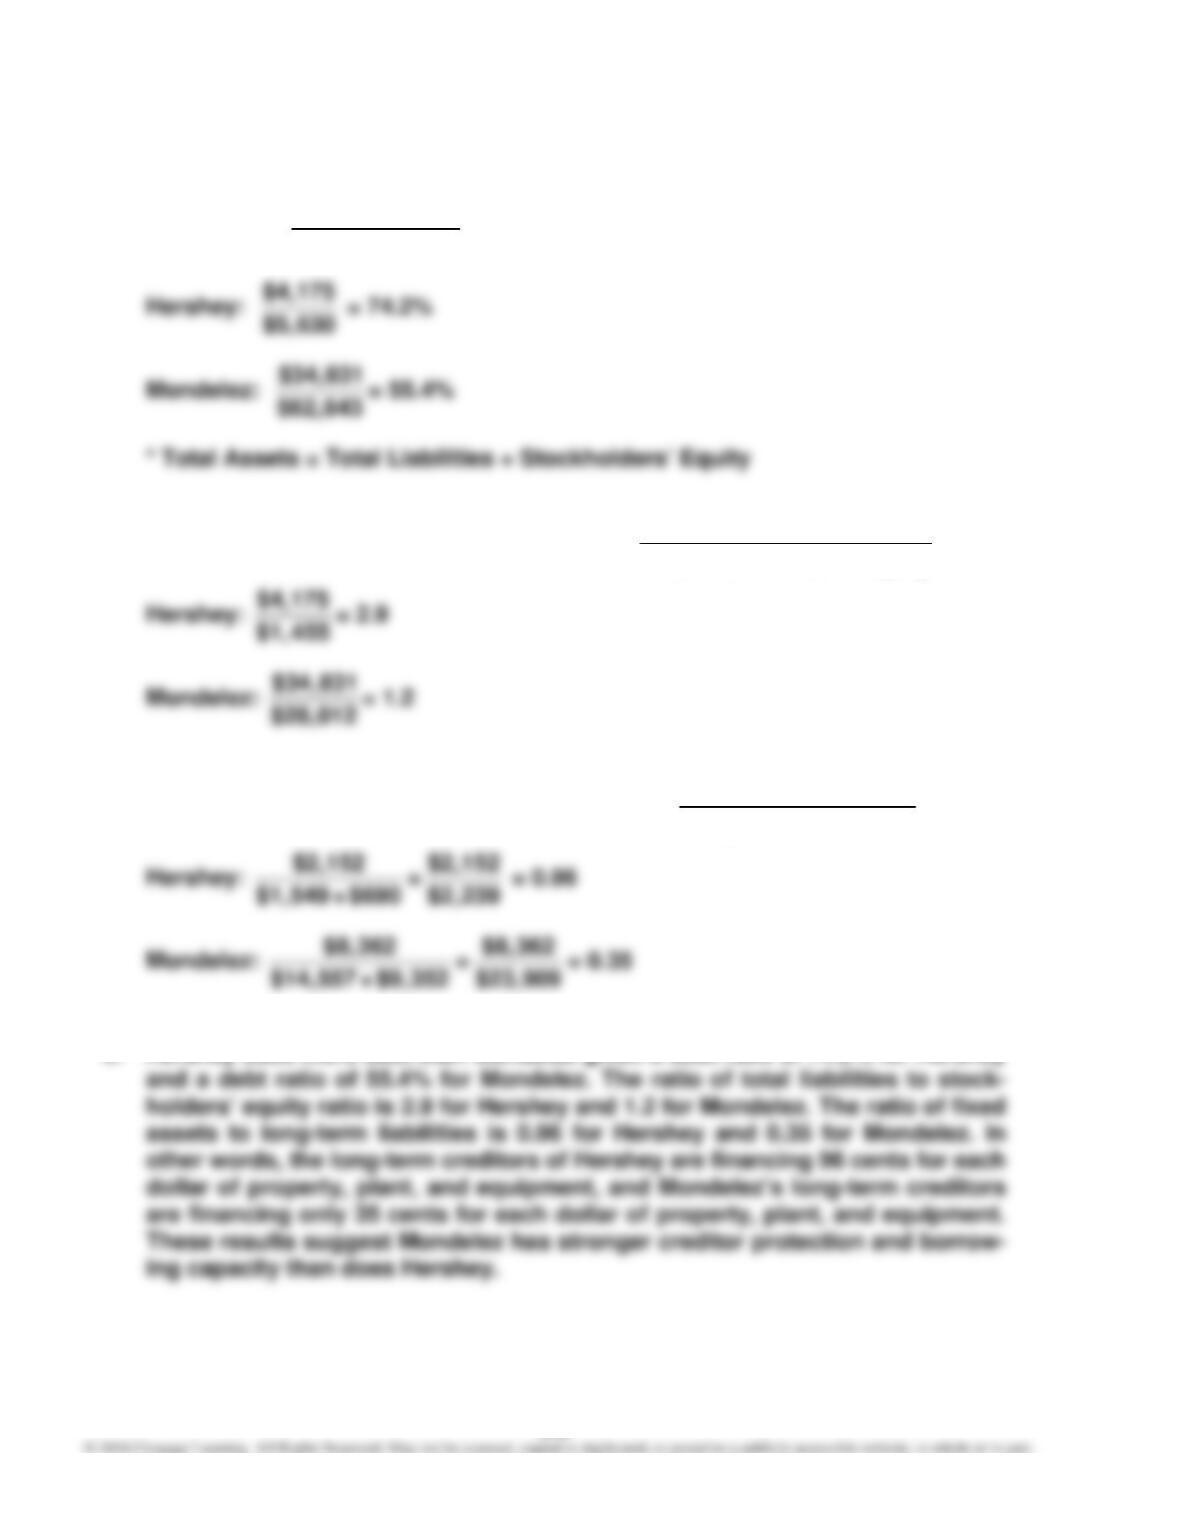
a. Debt Ratio = Total Liabilities
Total Assets*
b. Ratio of Liabilities to Stockholders’ Equity = Equity rs’Stockholde Total
sLiabilitie Total
c. Ratio of Fixed Assets to Long-Term Liabilities = Fixed Assets (net)
Long-Term Liabilities
c. Hershey uses more debt than Mondelez given a debt ratio of 74.2% for Hershey
271
E9–16
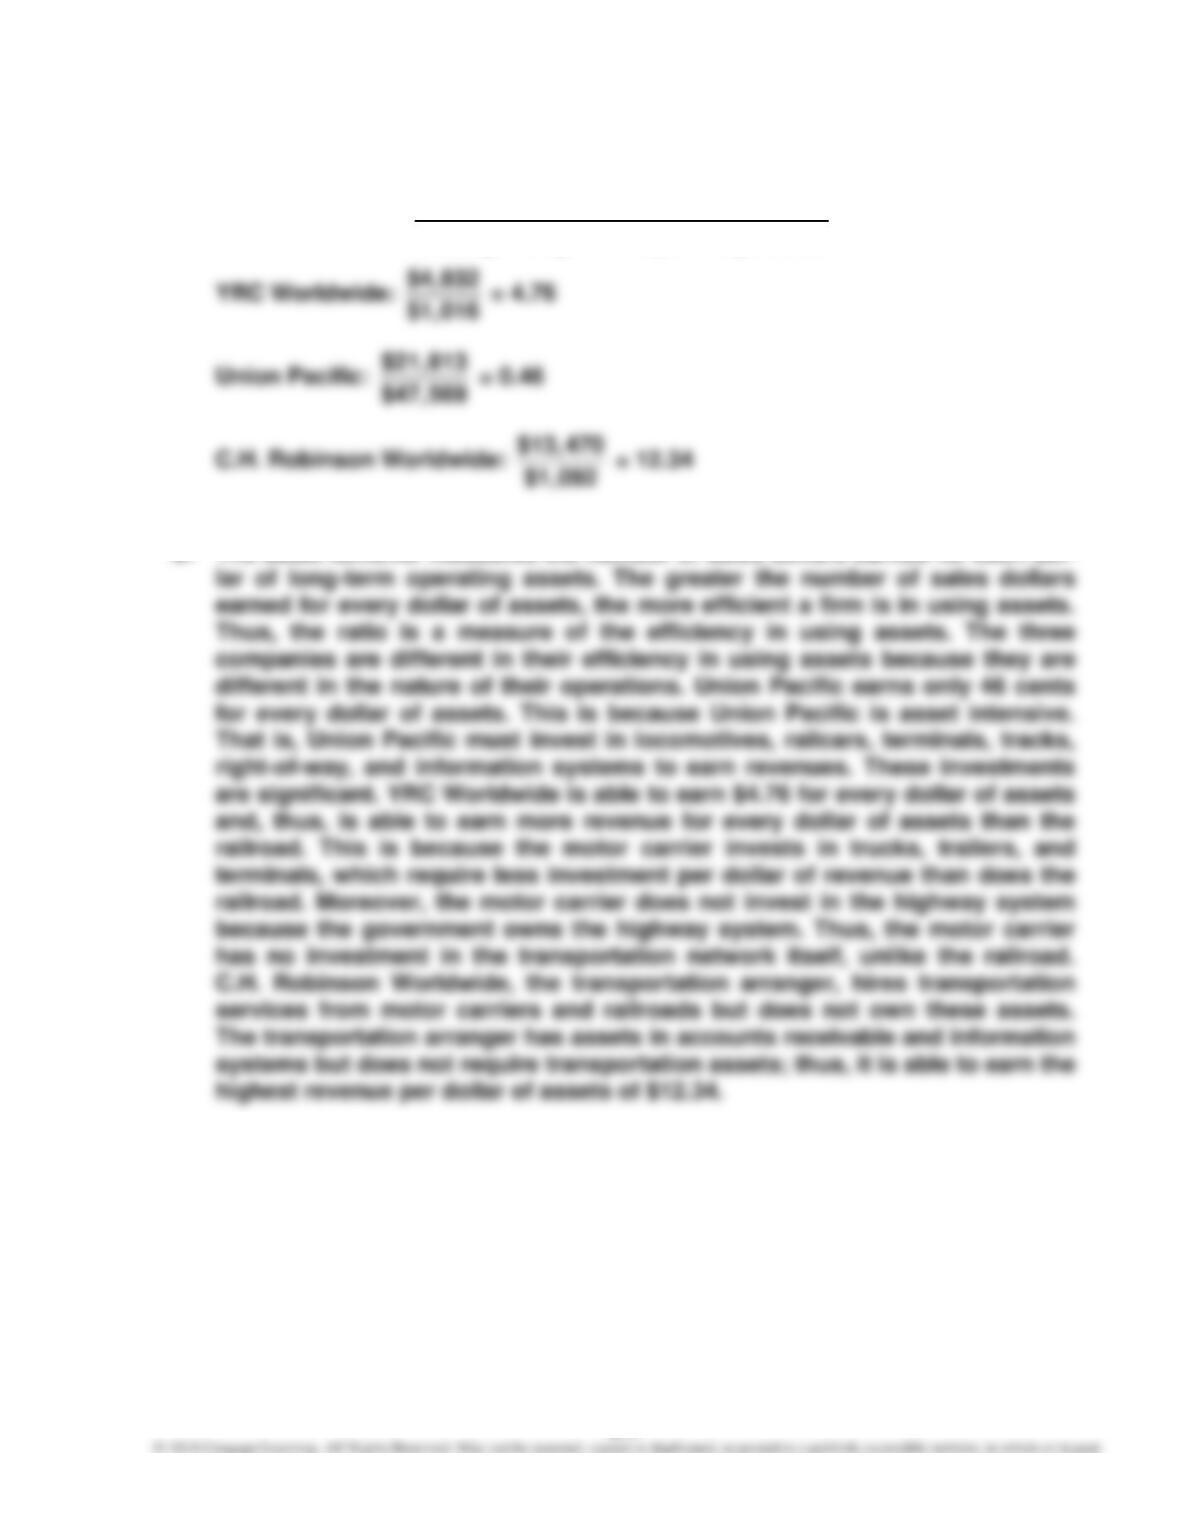
a. Asset Turnover = Sales
Average Long–Term Operating Assets
b. The asset turnover measures the number of sales dollars earned for each dol-
272
E9–16, Concluded
Note to Instructors: Students may wonder how asset-intensive companies
overcome their asset efficiency disadvantages relative to competitors with
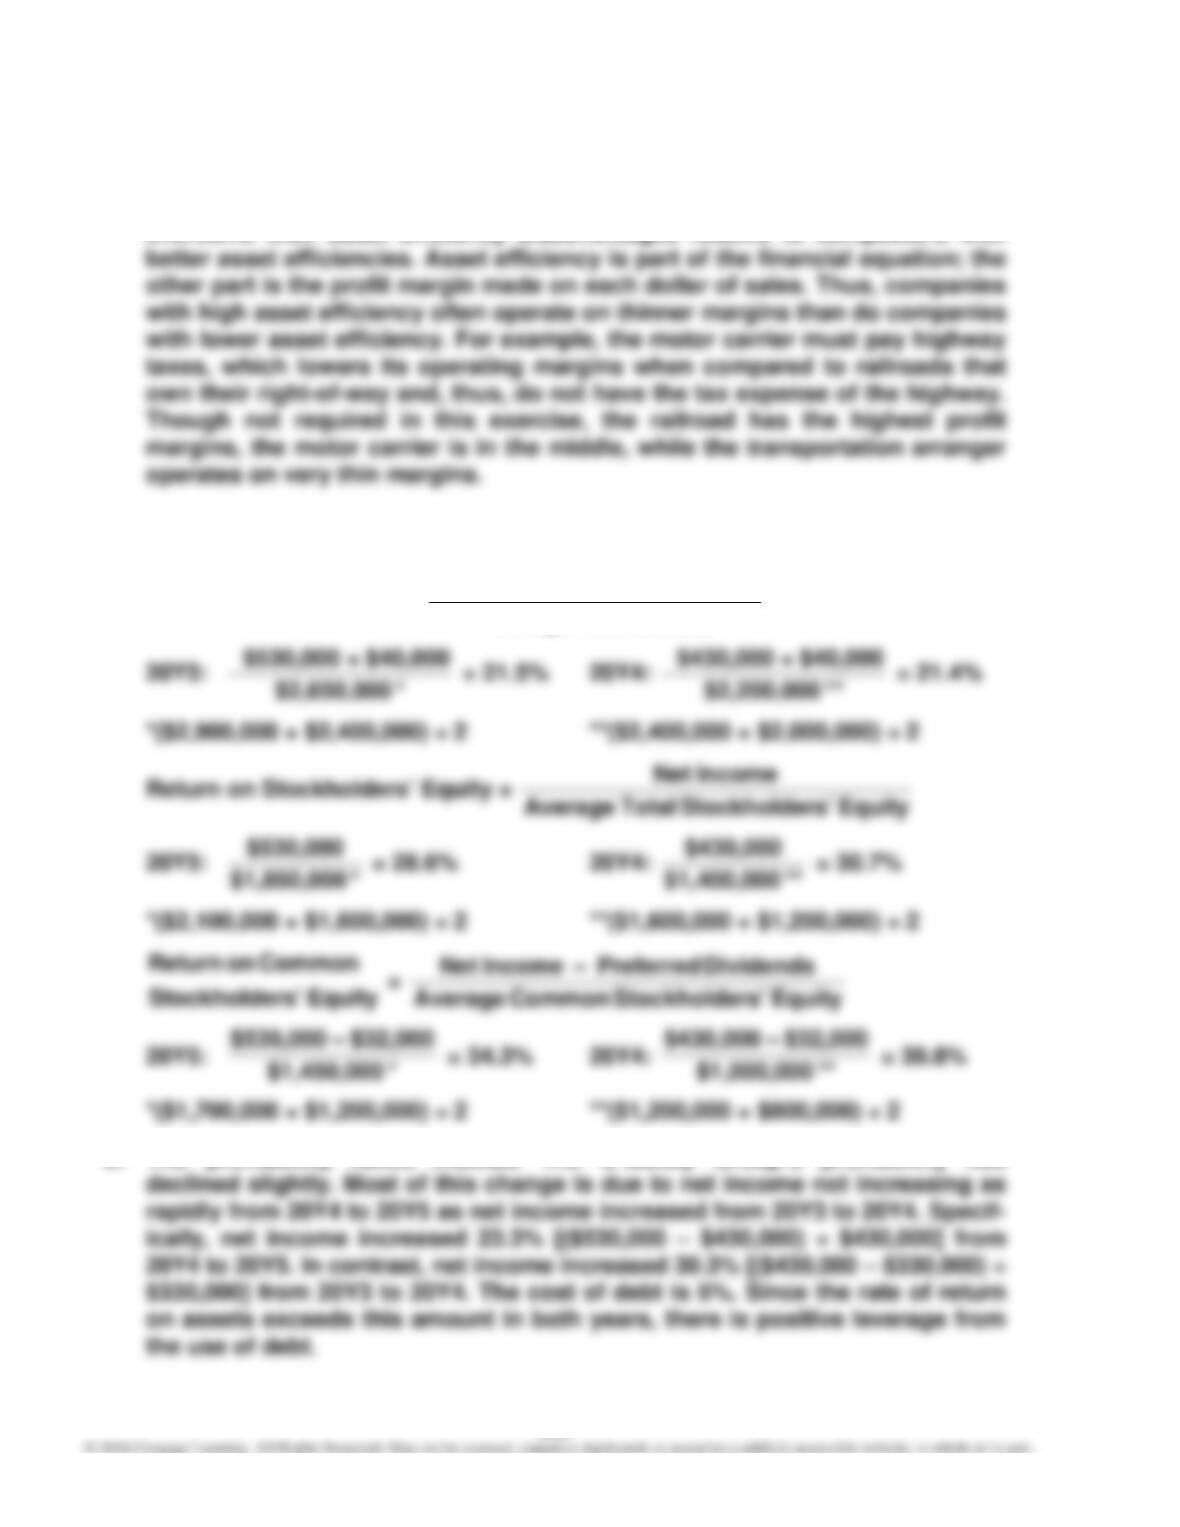
E9–17
a. Return on Total Assets = AssetsTotal Average
ExpenseInterest + IncomeNet
b. The profitability ratios indicate The O’Malley Group’s profitability has