59
METRIC-BASED ANALYSIS
MBA 2–1
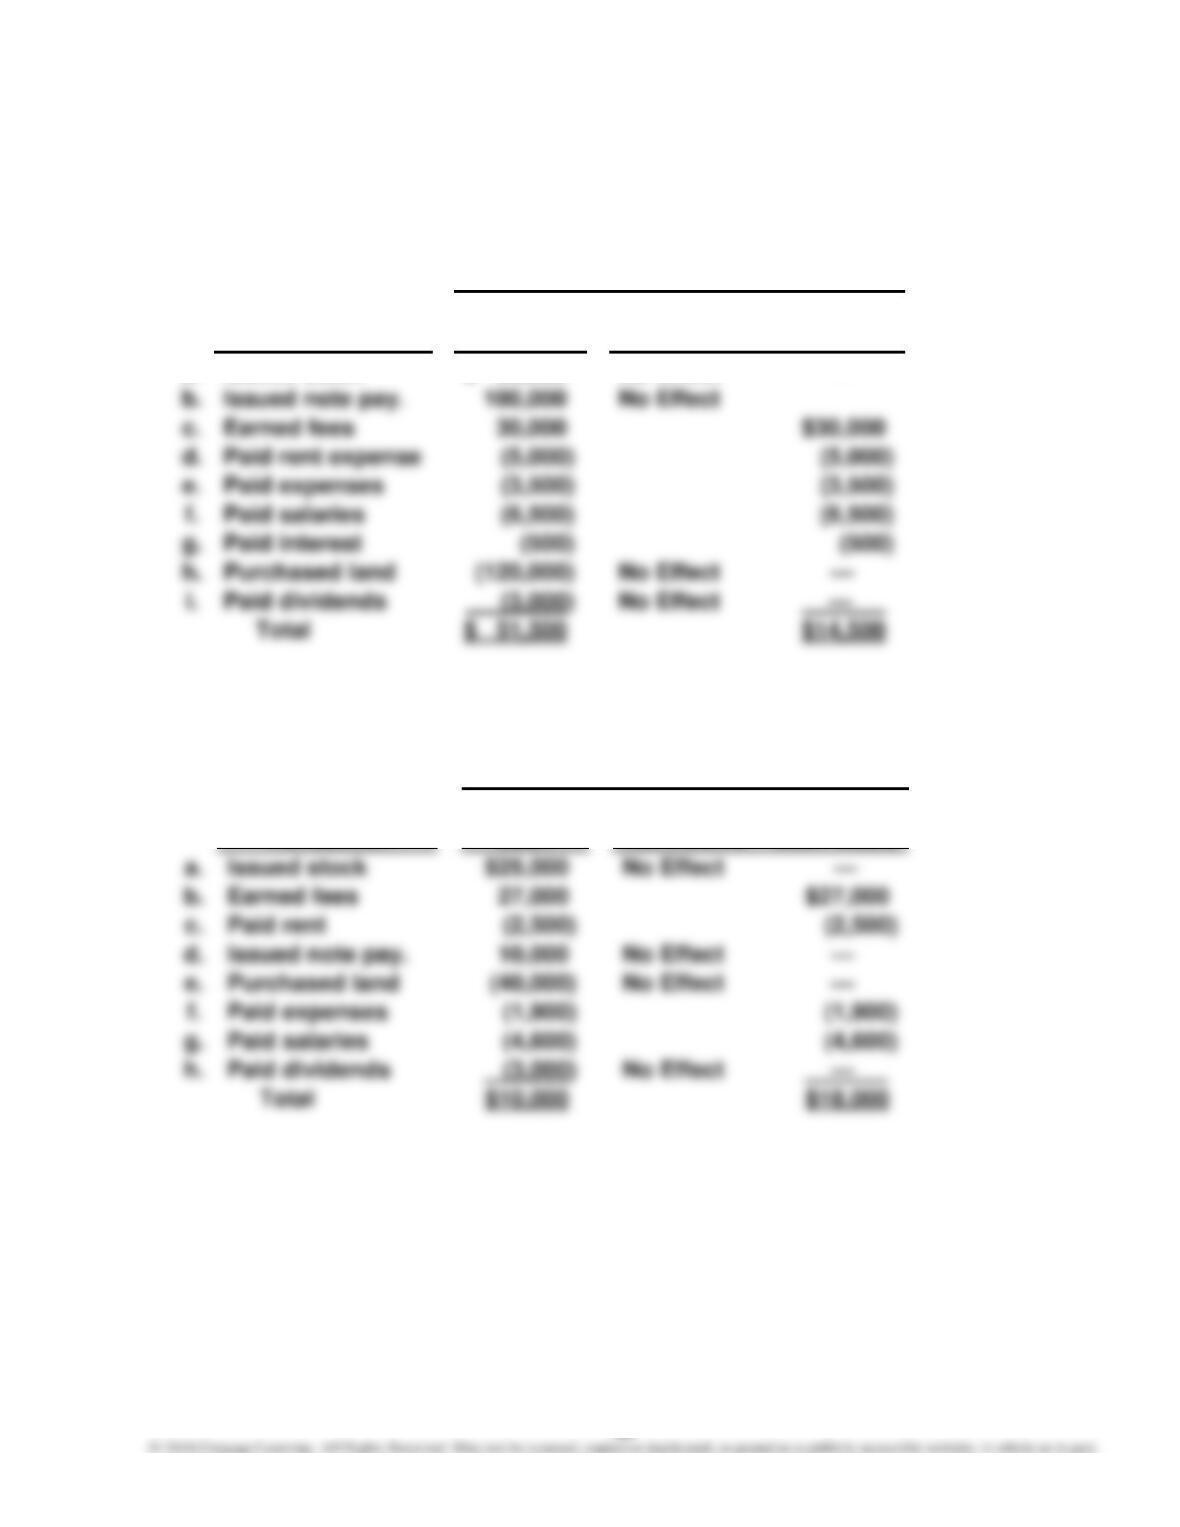
Transaction Metric Effects
Liquidity Profitability
Transaction Cash Net Income – Cash Basis
a. Issued stock $ 60,000 No Effect —
MBA 2–2
Transaction Metric Effects
Liquidity Profitability
Transaction Cash Net Income – Cash Basis
60
MBA 2–3
1.
Increase
Year 1 Year 2 (Decrease)
Revenue …………………………………………….. 100.0% 100.0% n/a
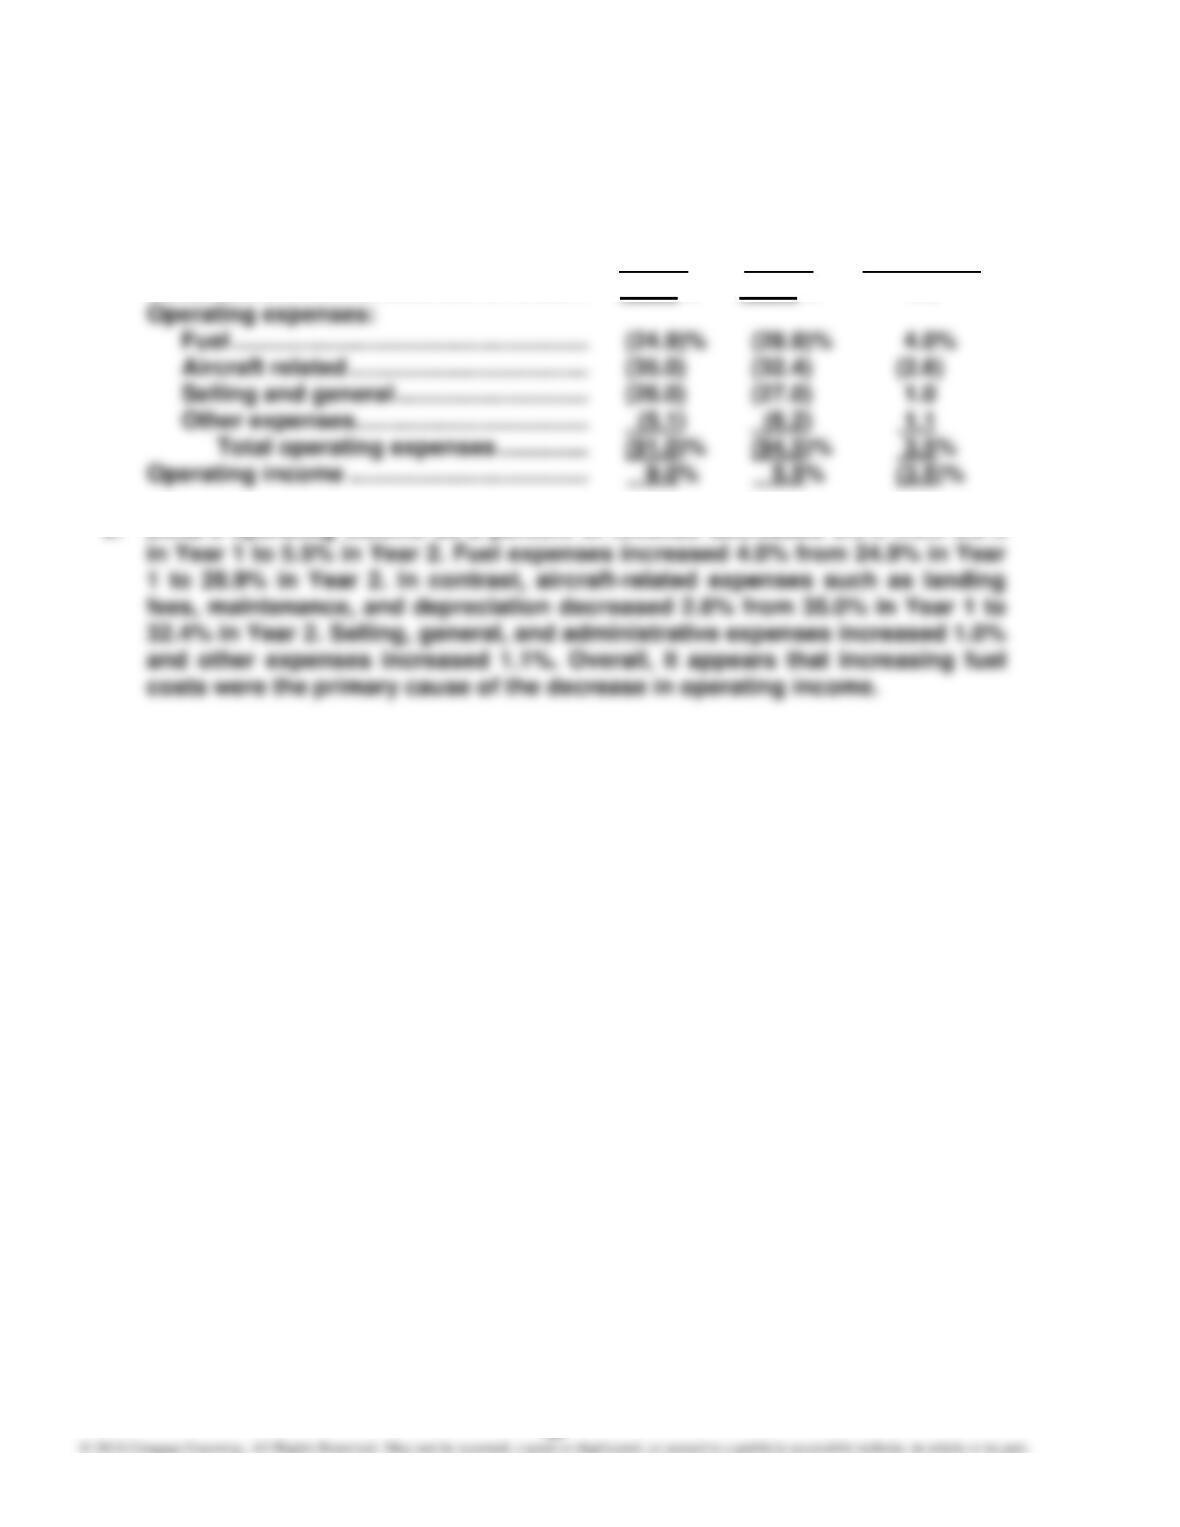
2. Delta’s operating income as a percent of revenue decreased 3.5% from 9.0%
MBA 2–4
1.
Increase
Year 1 Year 2 (Decrease)
Revenue ……………………………………………. 100.0% 100.0% n/a
Operating expenses:
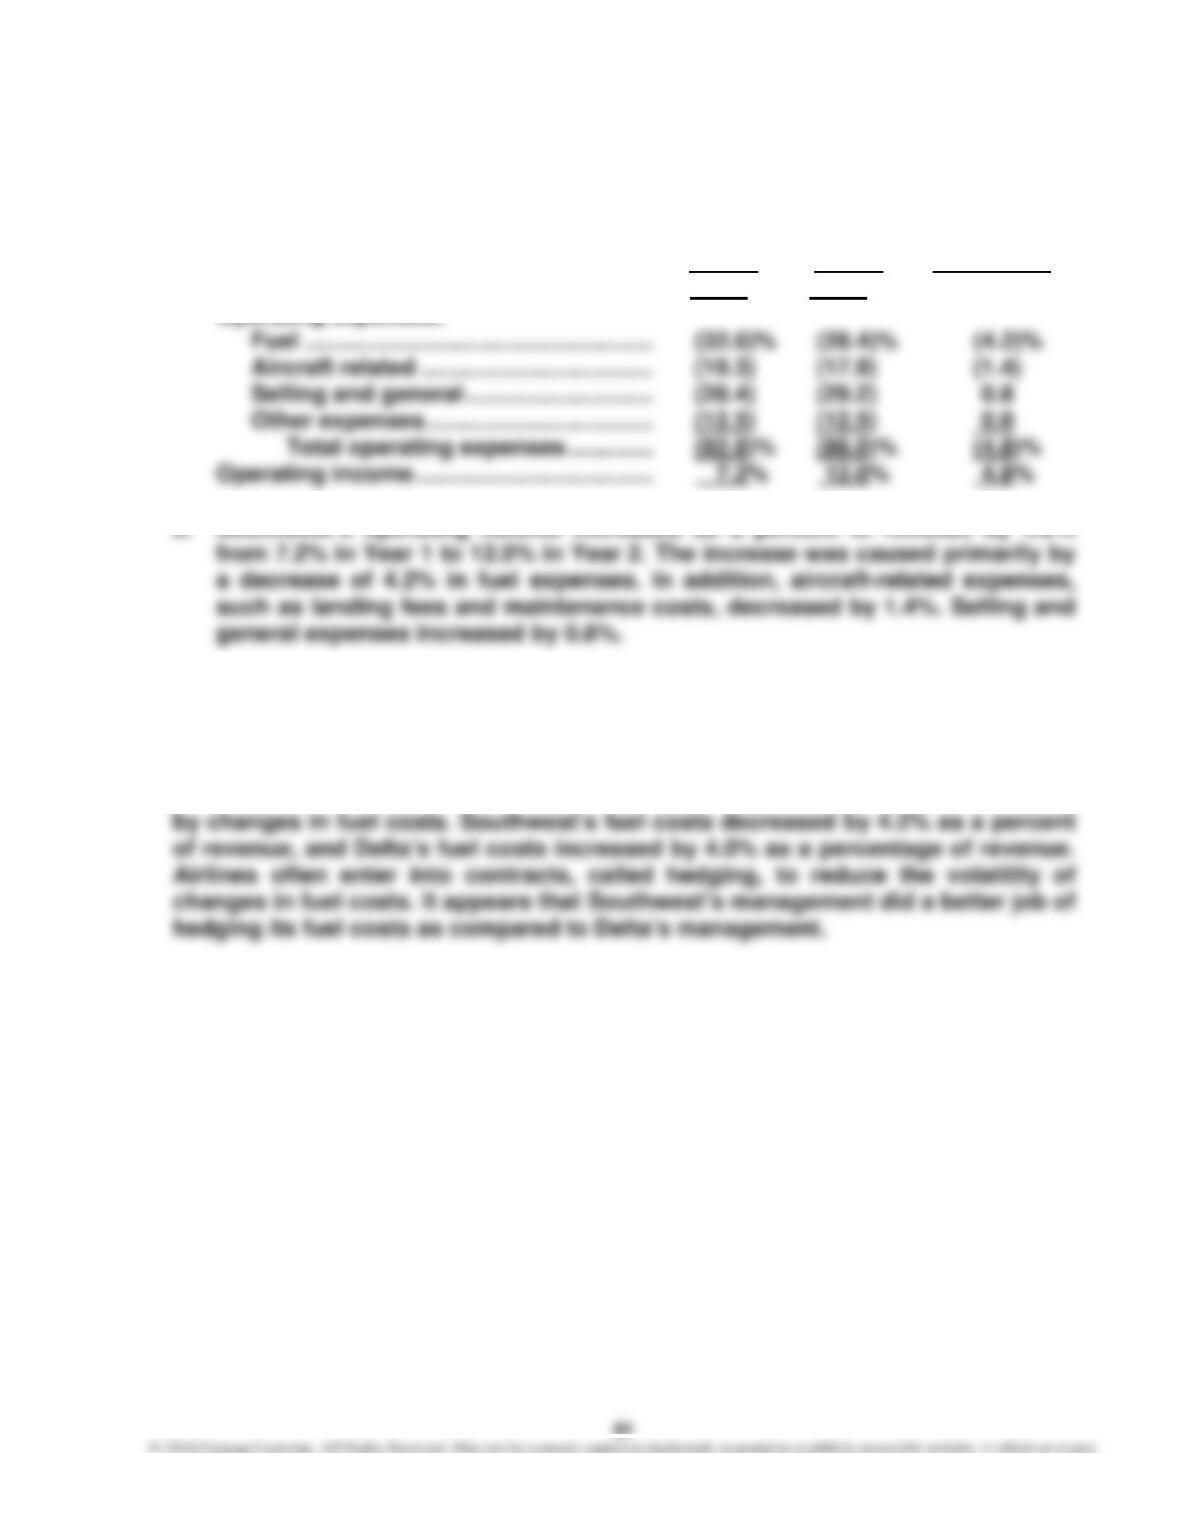
MBA 2–5
Southwest’s operating income as a percent of revenue increased by 4.8% com-
pared to Delta’s decrease of 3.5%. The difference in operating results was caused
62
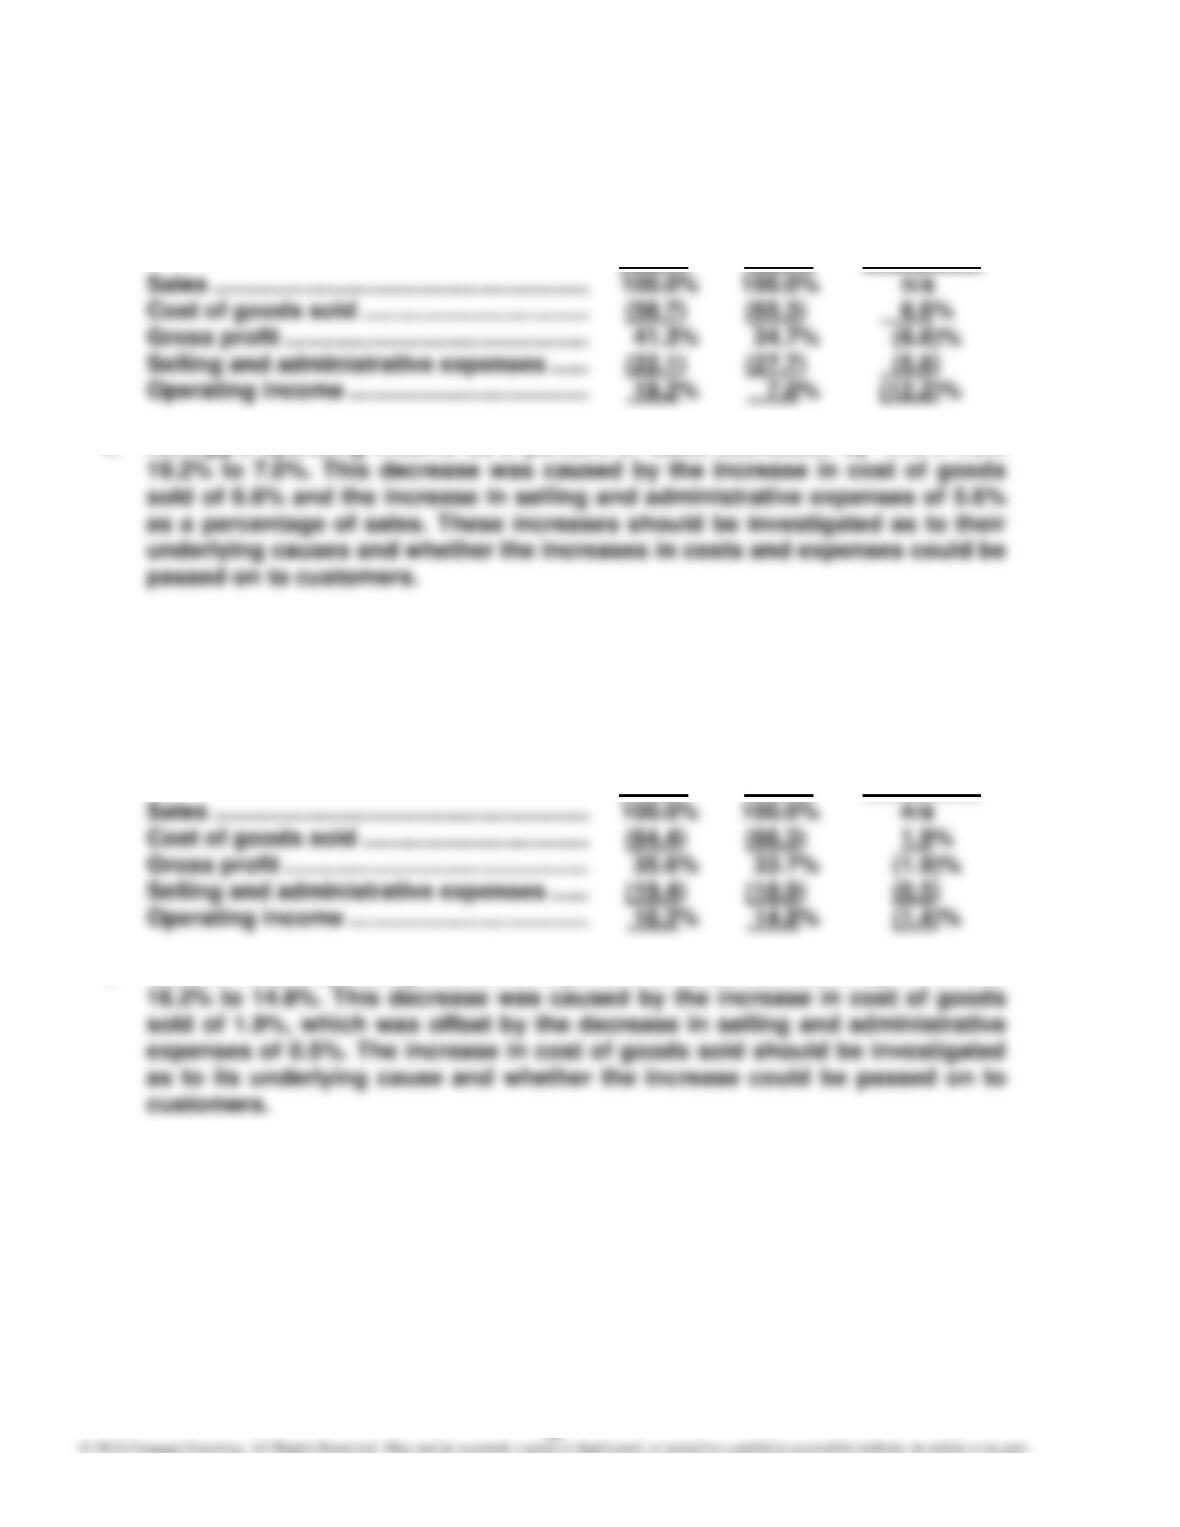
MBA 2–6
1.
Increase
Year 1 Year 2 (Decrease)
2. Kellogg’s operating income as a percent of sales decreased by 12.2% from
MBA 2–7
1.
Increase
Year 1 Year 2 (Decrease)
2. General Mills’s operating income as a percent of sales decreased by 1.4% from
63
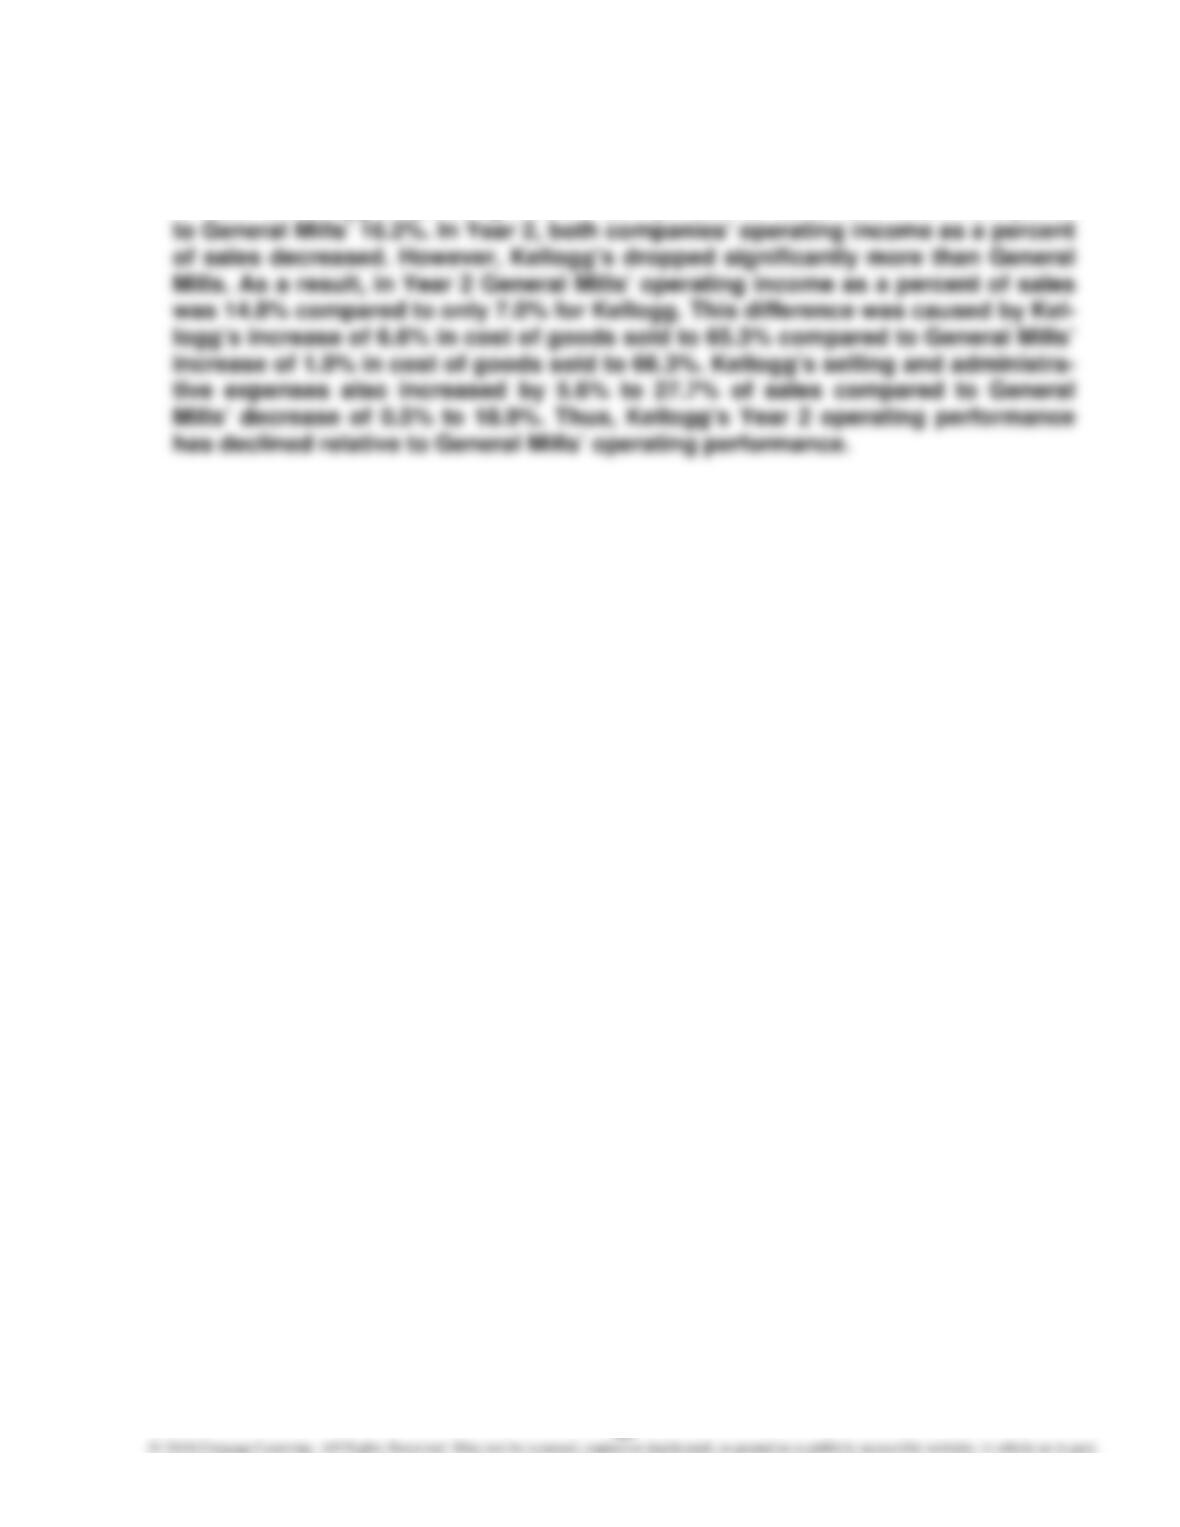
MBA 2–8
In Year 1, Kellogg’s operating income as a percent of sales was 19.2% compared
64
MBA 2–9
1.
Increase
Year 1 Year 2 (Decrease)
Current assets:
Cash …………………………………………………….. 6.0% 7.3% 1.3%
Current liabilities:
Accounts payable and similar liabilities …. 21.0% 20.9% (0.1)%
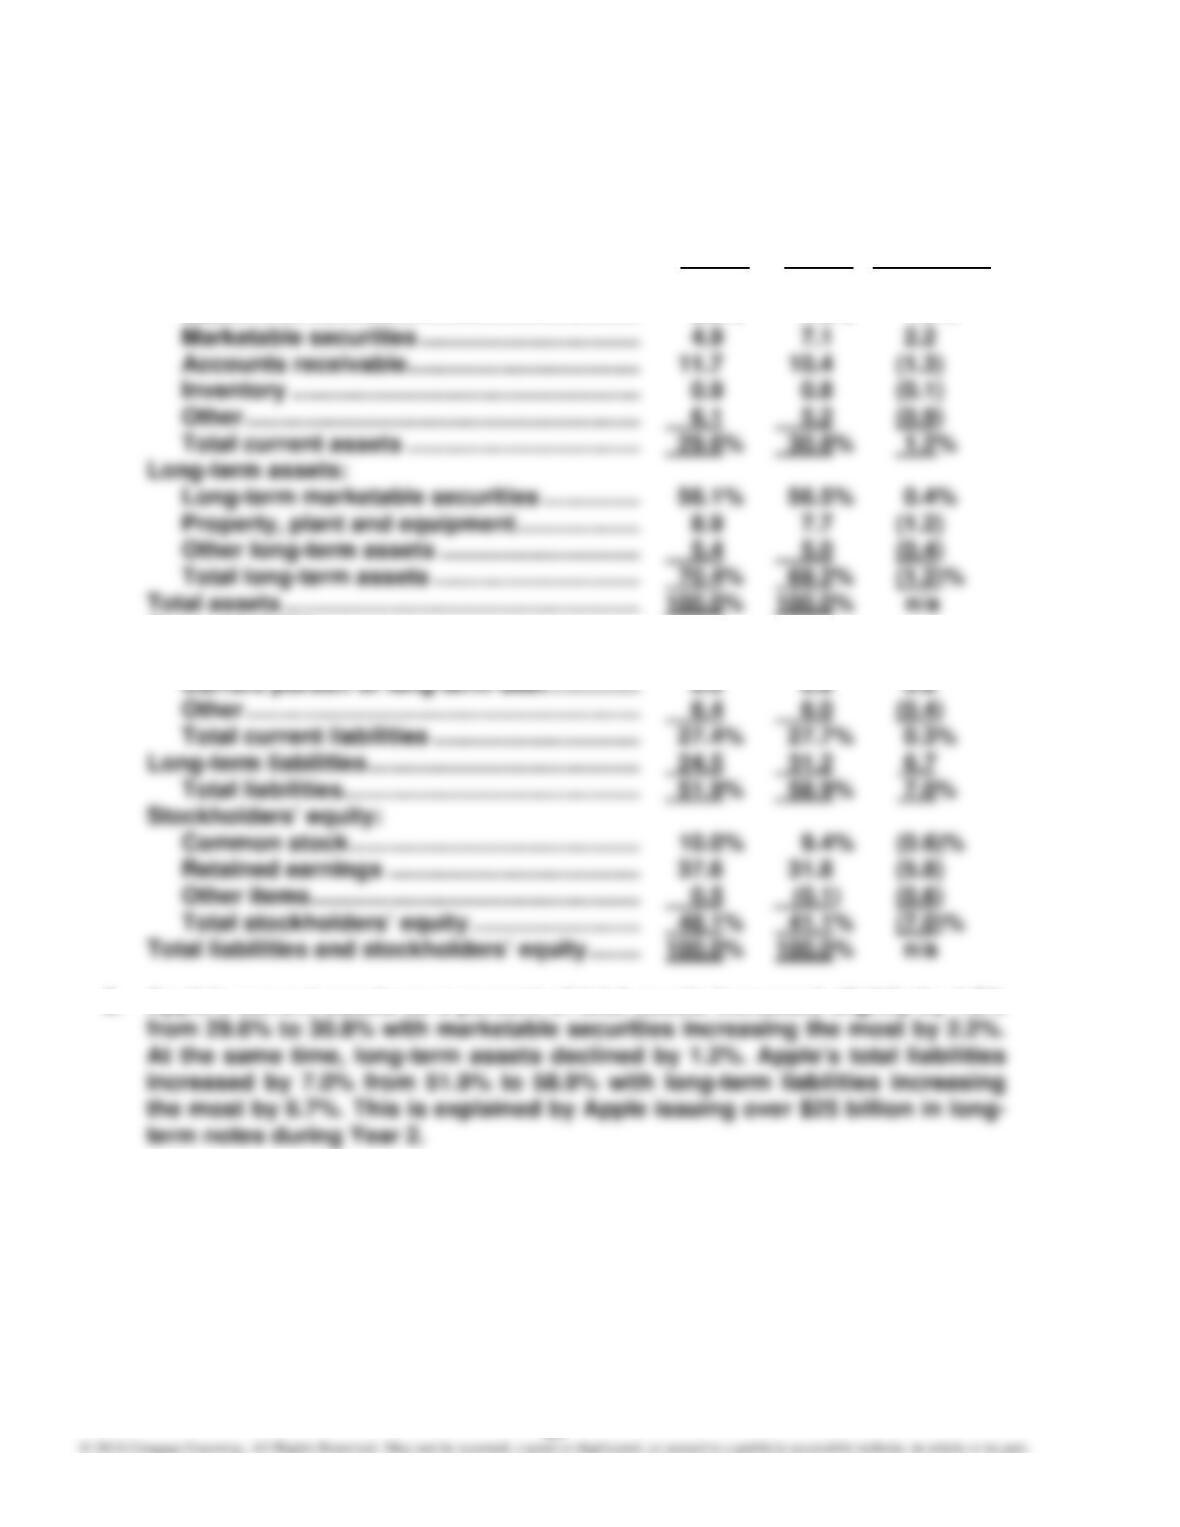
2. Apple’s current assets as a percent of total assets increased slightly by 1.2%
65
CASES
Case 2–1
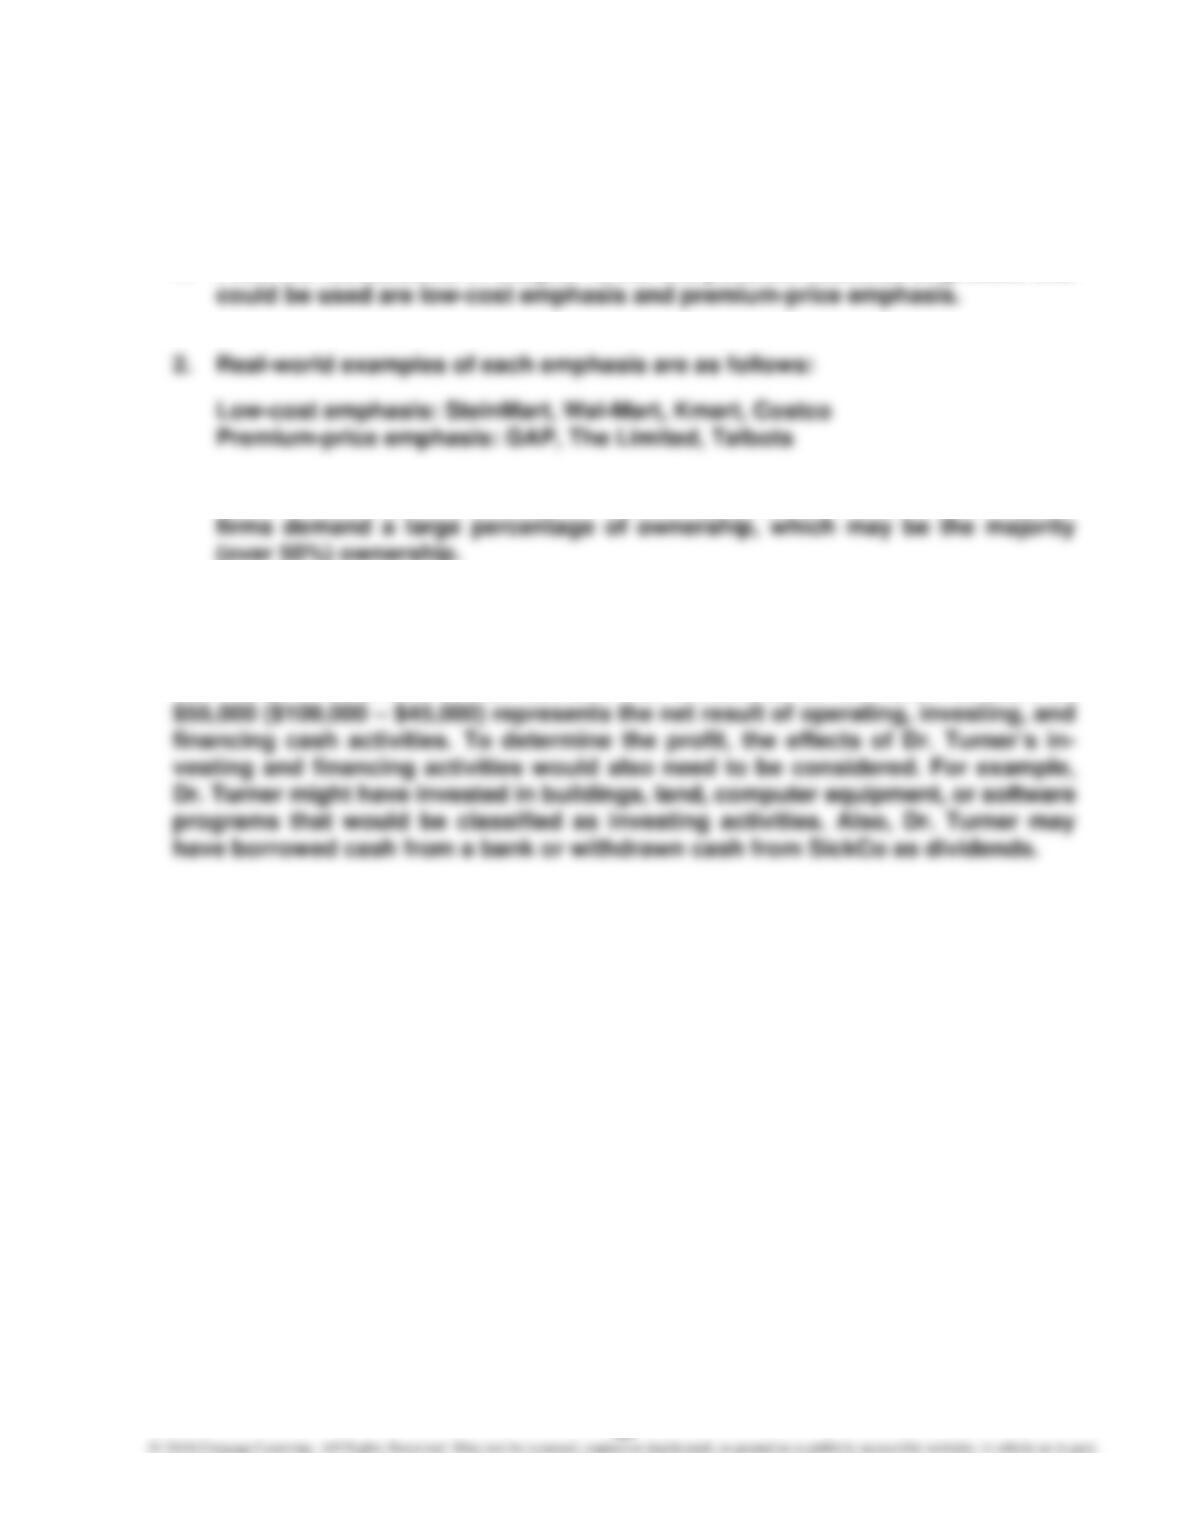
1. From our discussions in Chapter 1, the two possible business emphases that
3. The answers will vary among the student groups. Normally, venture capital
Case 2–2
Dr. Turner’s comment is not correct. The difference in the cash balance of
66
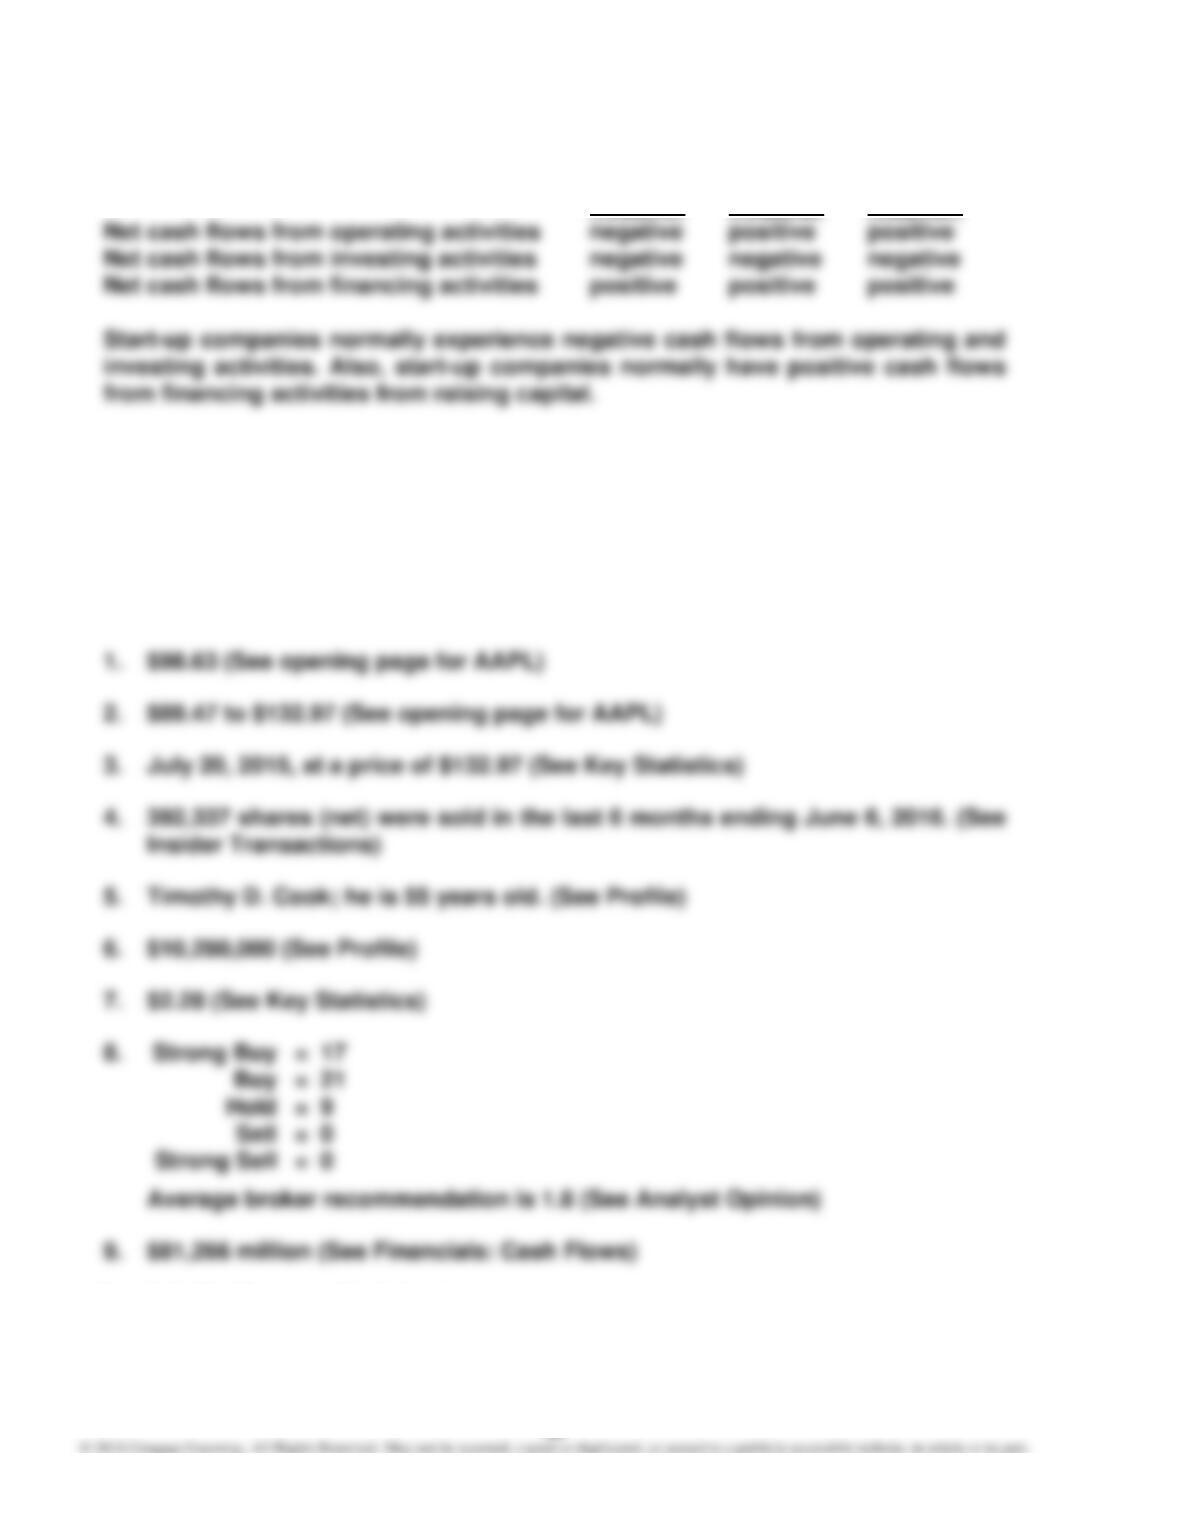
Case 2–3
Year 1 Year 2 Year 3
Case 2–4
Note to Instructors: Answers will vary based upon the date students do their
research. The objective of this case is to familiarize students with financial re-
porting resources available on the Internet. The following solution is based upon
the Apple Inc. data as of June 6, 2016, from Yahoo.com’s finance Web site.
10. 29.39% (See Key Statistics)