511
P15–3, Concluded
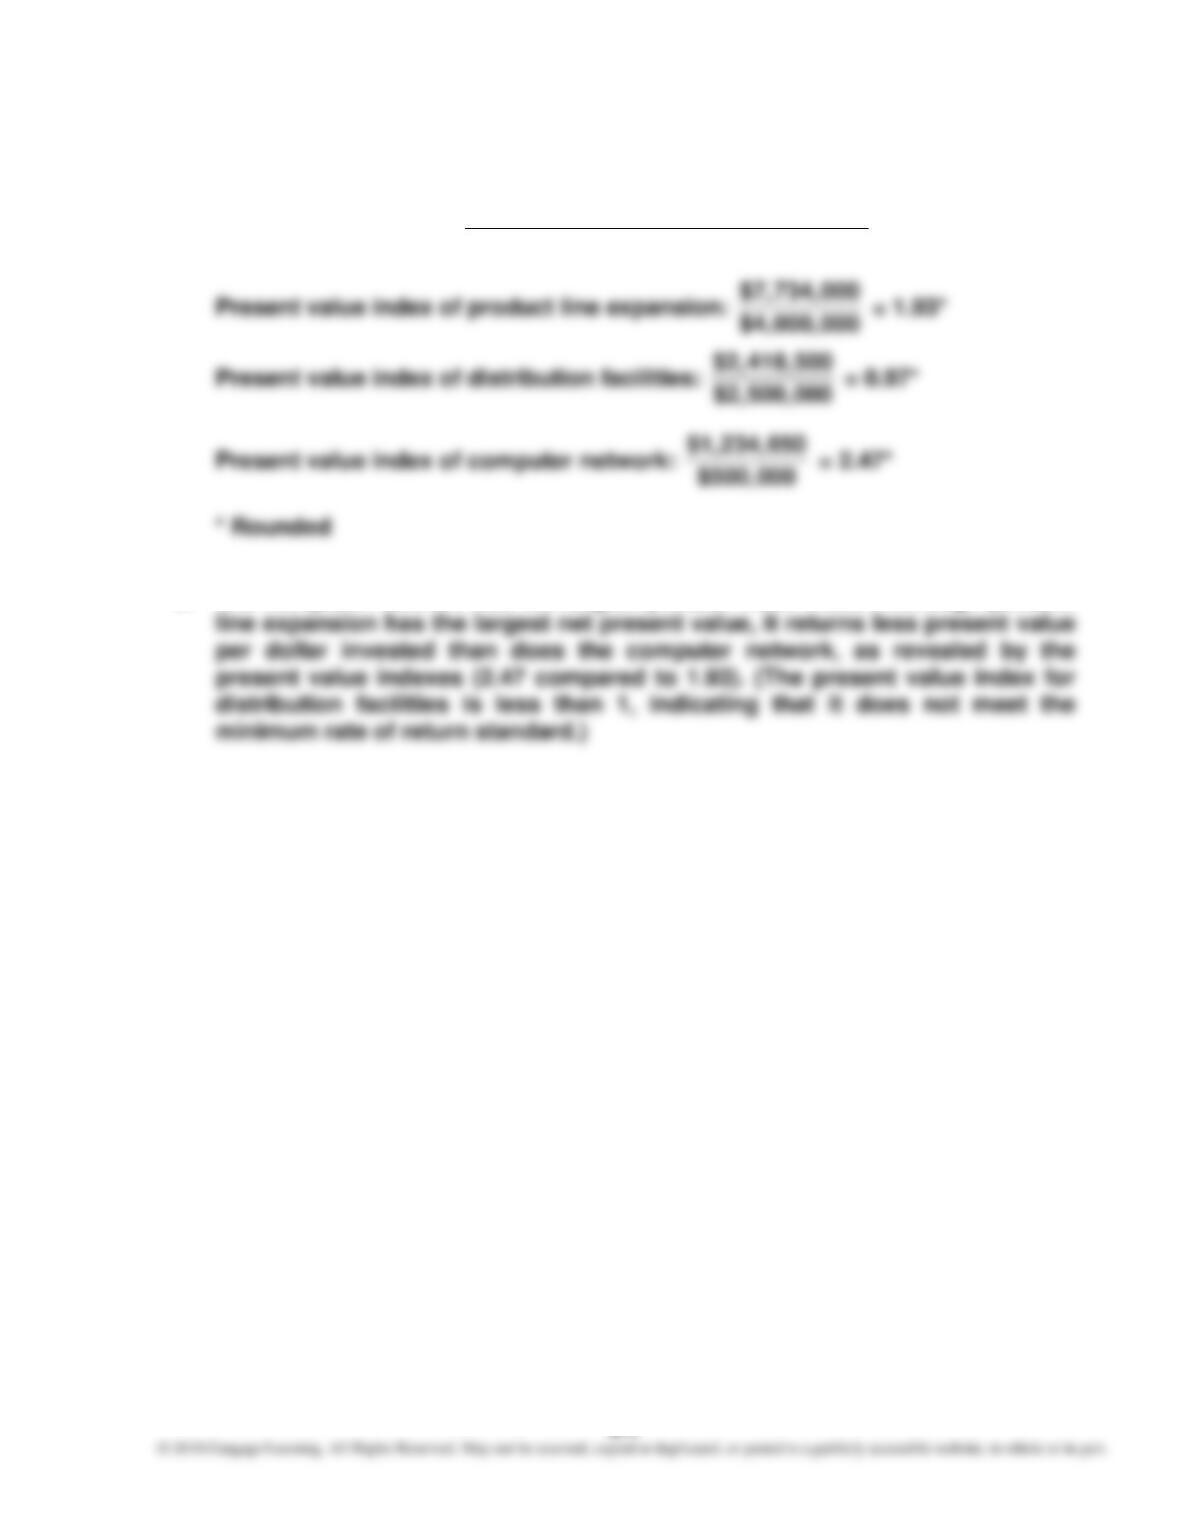
2. Present Value Index = Total Present Value of Net Cash Flow
Amount to Be Invested
3. The computer network has the largest present value index. Although product
512
P15–4
1. a. Radio Station
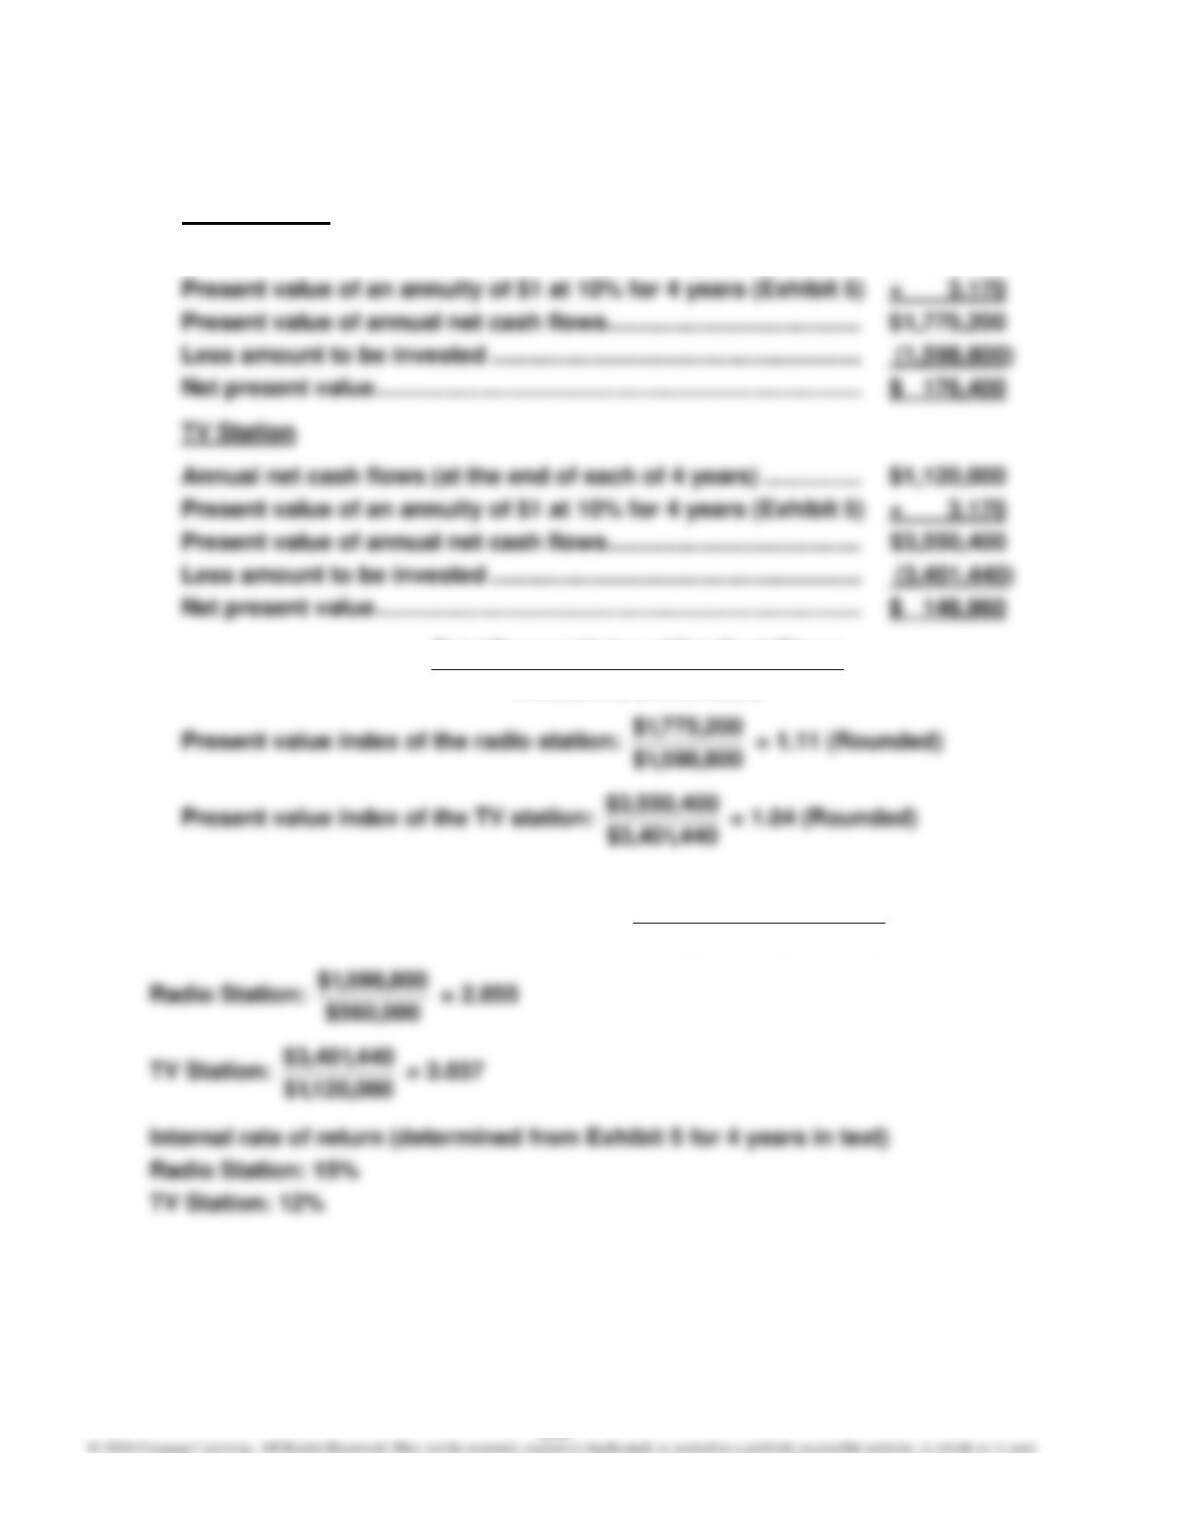
Annual net cash flows (at the end of each of 4 years) …………… $ 560,000
b. Present Value Index = Invested Be to Amount
Flows Cash Net of ValuePresent Total
2. Present Value Factor for an Annuity of $1 = Flows Cash Net Annual
Invested Be to Amount

513
P15–4, Concluded
3. By using the internal rate of return method, all proposals are placed on a
514
P15–5
1. Net present value analysis:
Site A
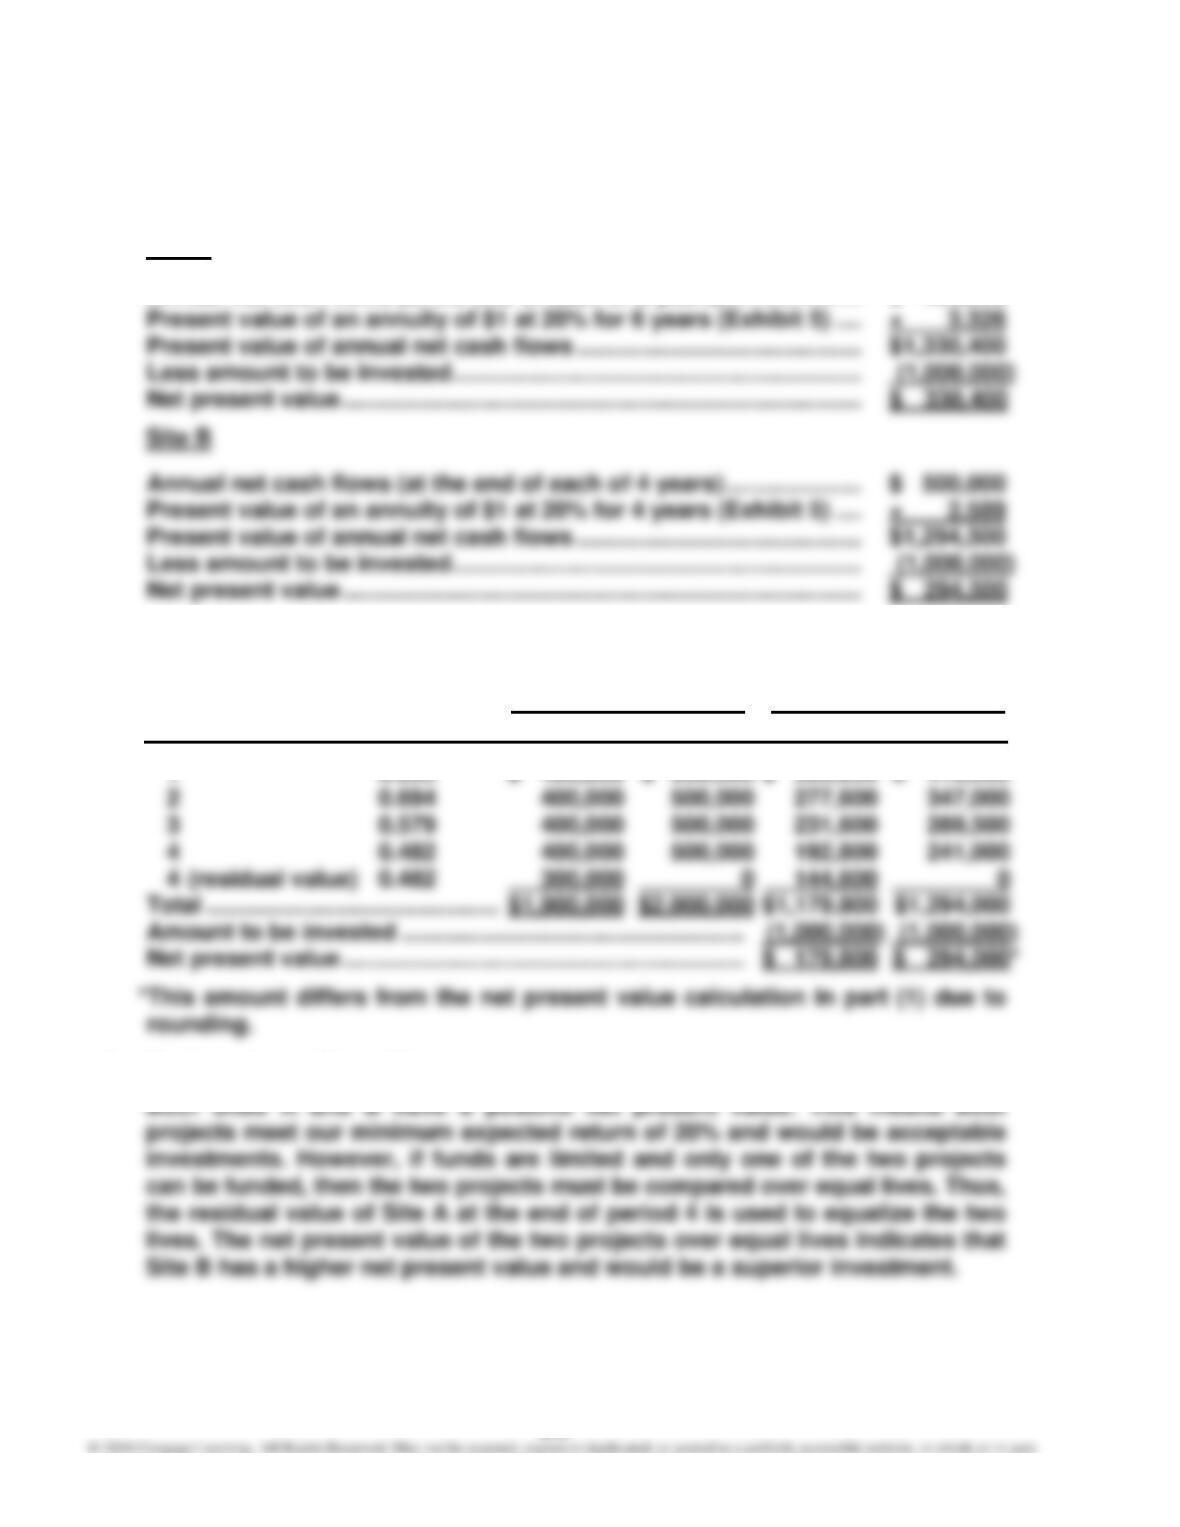
Annual net cash flows (at the end of each of 6 years) ………………… $ 400,000
2. Net present value analysis:
Present Value of
Present Value of Net Cash Flows Net Cash Flows
Year $1 at 20% Site A Site B Site A Site B
1 0.833 $ 400,000 $ 500,000 $ 333,200 $ 416,500
3. To: Investment Committee
515
P15–6
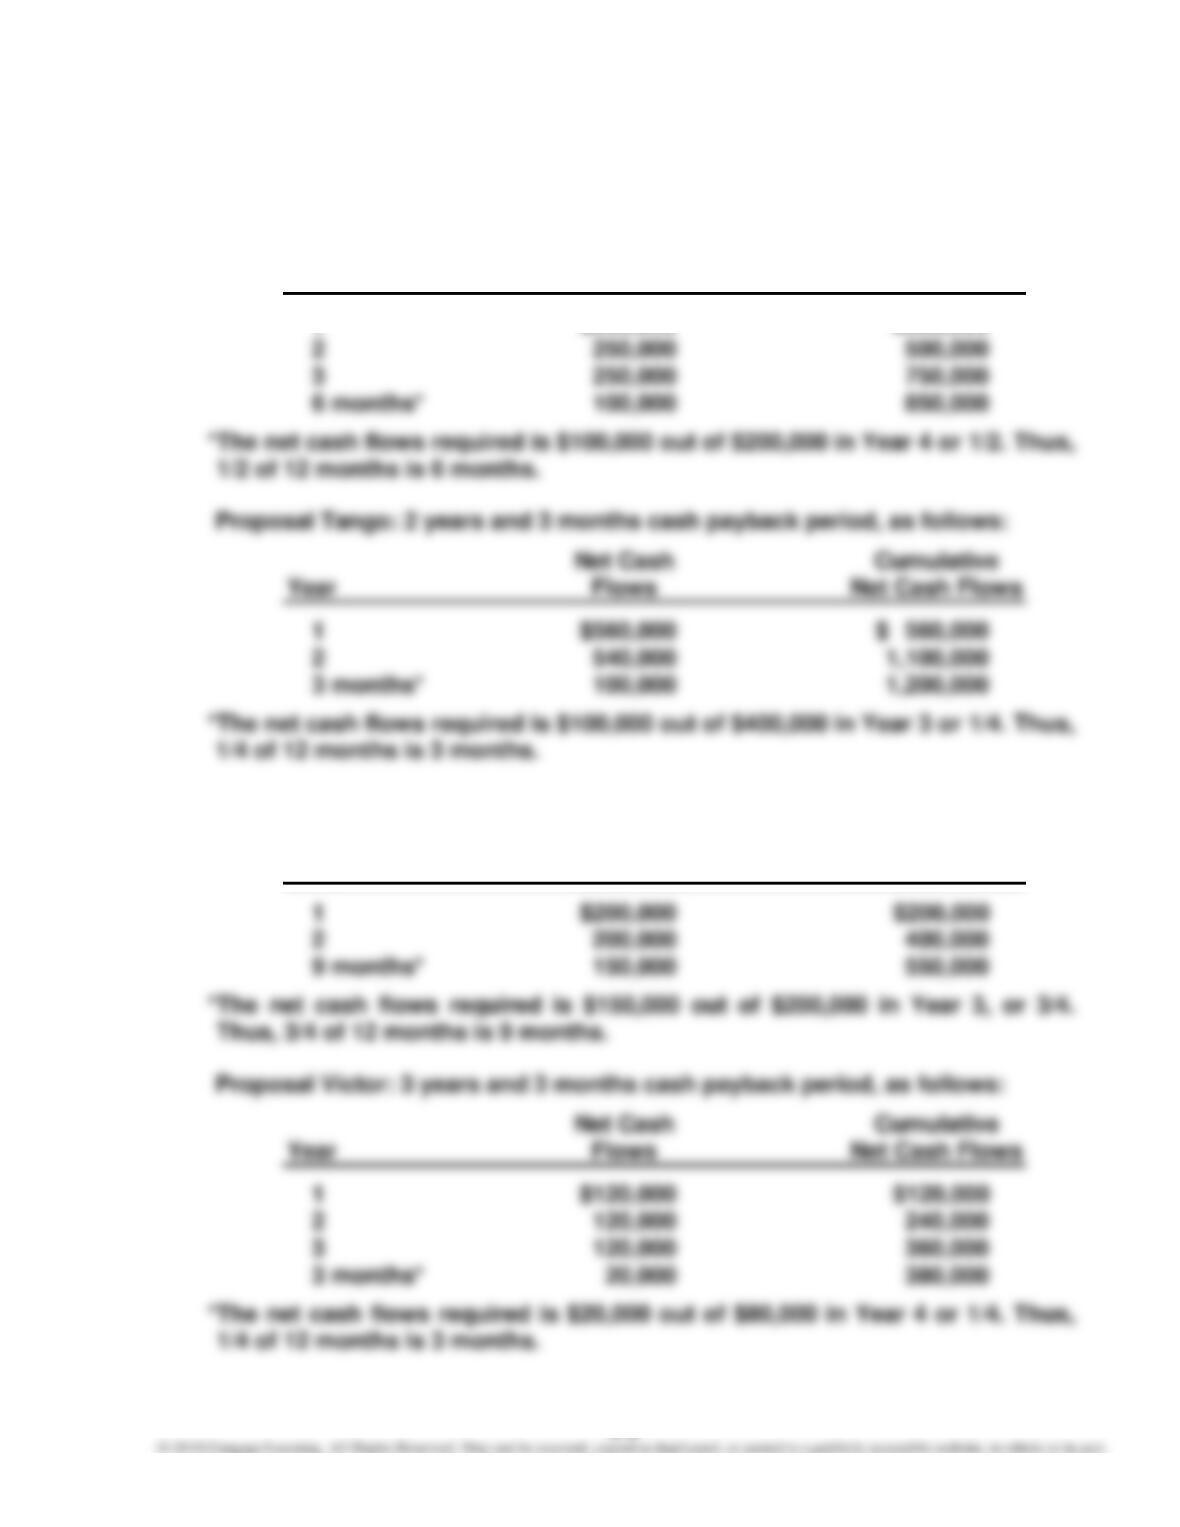
1. Proposal Sierra: 3 years and 6 months cash payback period, as follows:
Net Cash Cumulative
Year Flows Net Cash Flows
1 $250,000 $250,000
Proposal Uniform: 2 years and 9 months cash payback period, as follows:
Net Cash Cumulative
Year Flows Net Cash Flows
516
P15–6, Continued
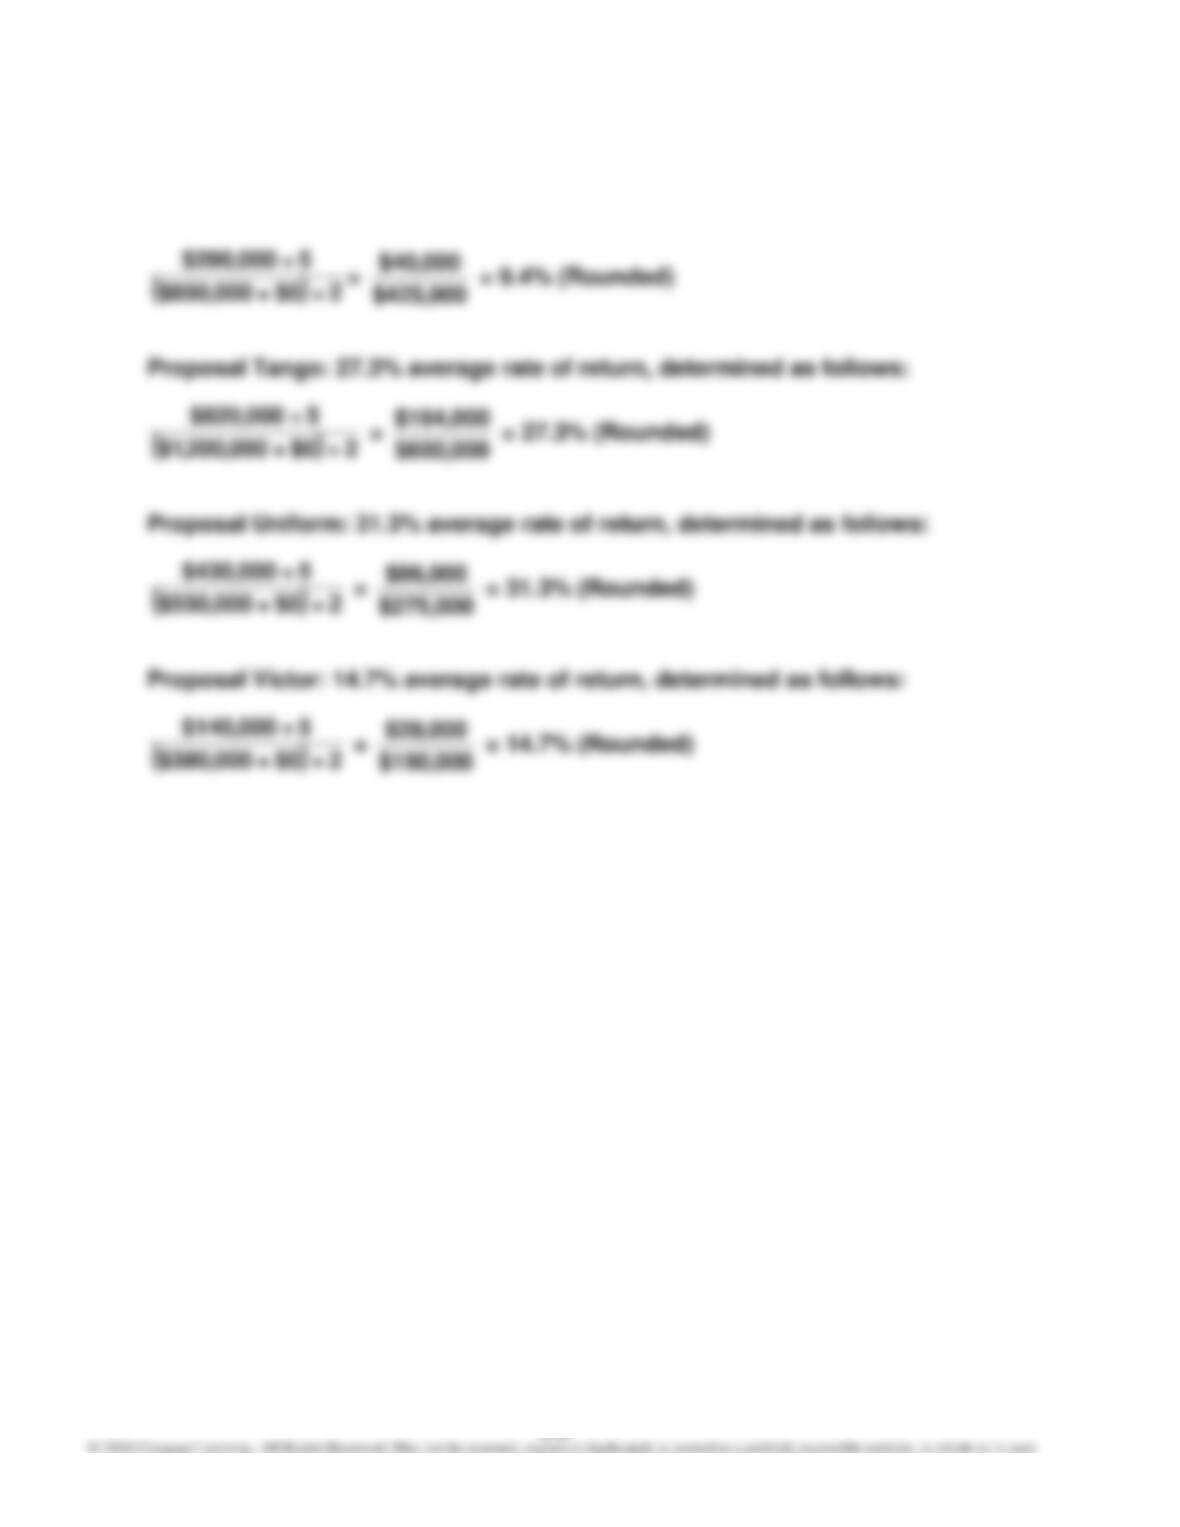
2. Proposal Sierra: 9.4% average rate of return, determined as follows:
517
P15–6, Continued
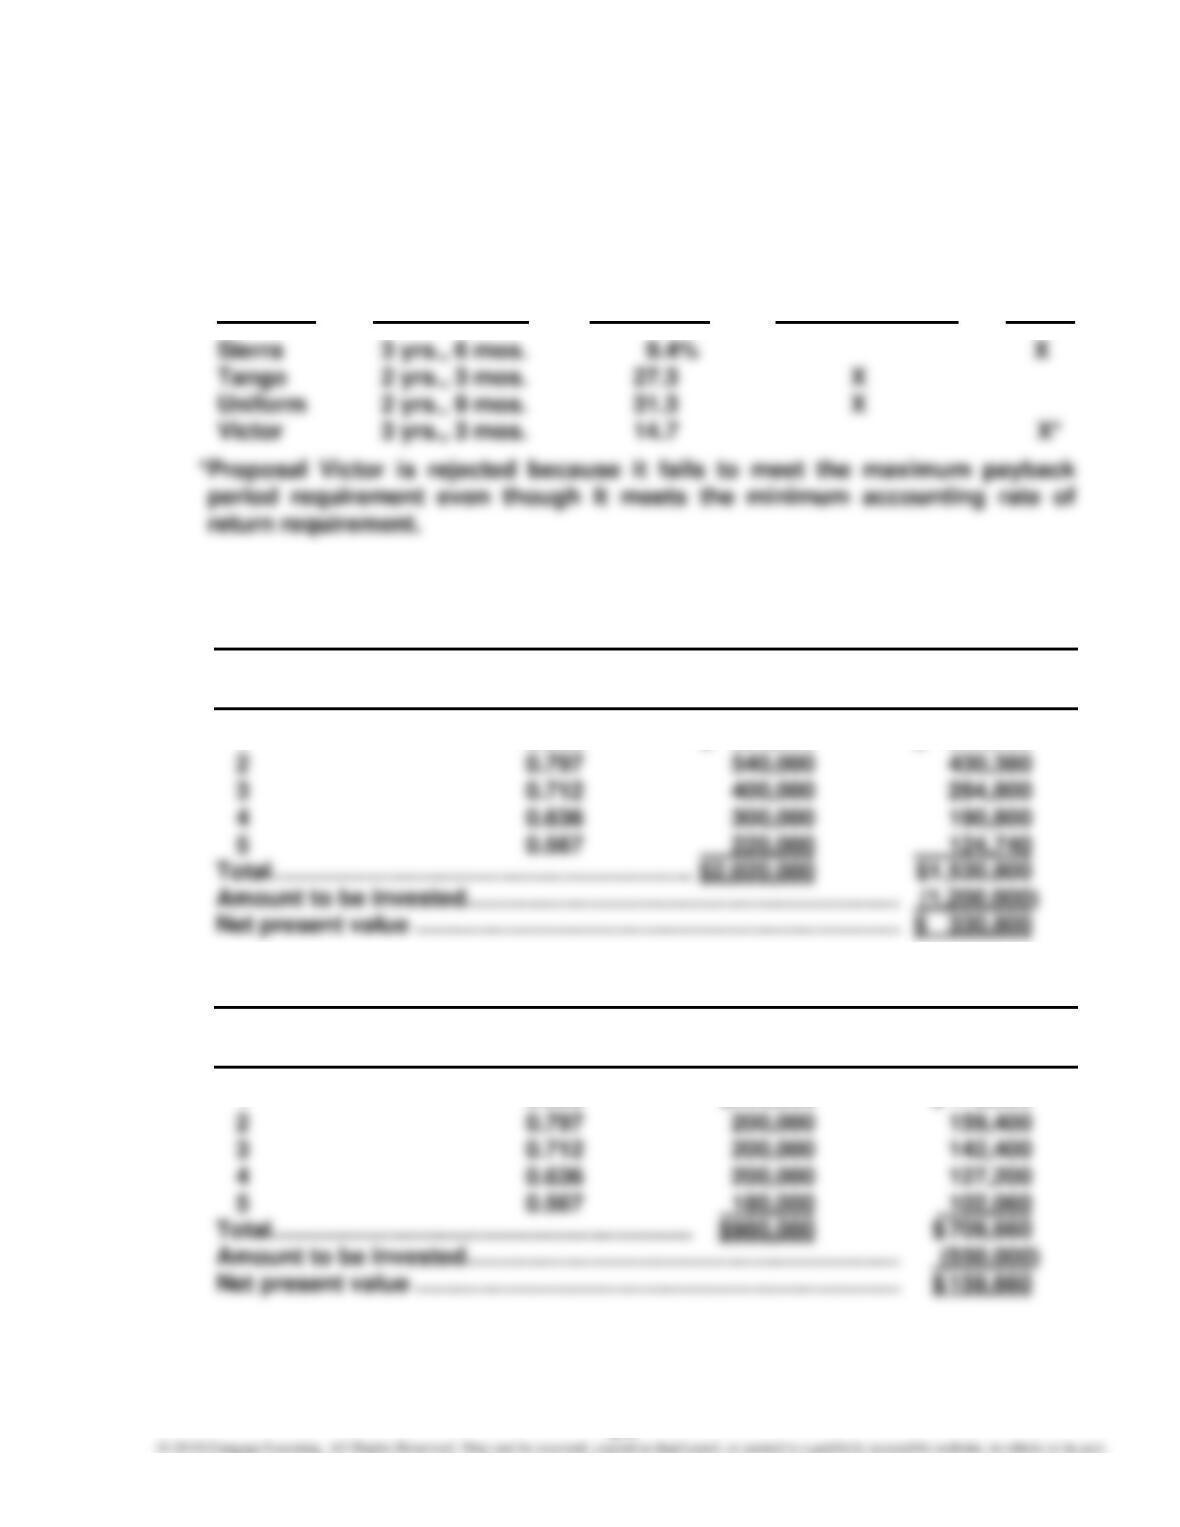
3. Of the four proposed investments, only Proposals Tango and Uniform meet
the company’s requirements as the following table indicates:
Cash Payback Average Rate Accept for
Proposal Period of Return Further Analysis Reject
4.
Proposal Tango
Present Value Net Cash Present Value of
Year of $1 at 12% Flows Net Cash Flows
1 0.893 $ 560,000 $ 500,080
Proposal Uniform
Present Value Net Cash Present Value of
Year of $1 at 12% Flows Net Cash Flows
1 0.893 $200,000 $ 178,600
518
P15–6, Concluded
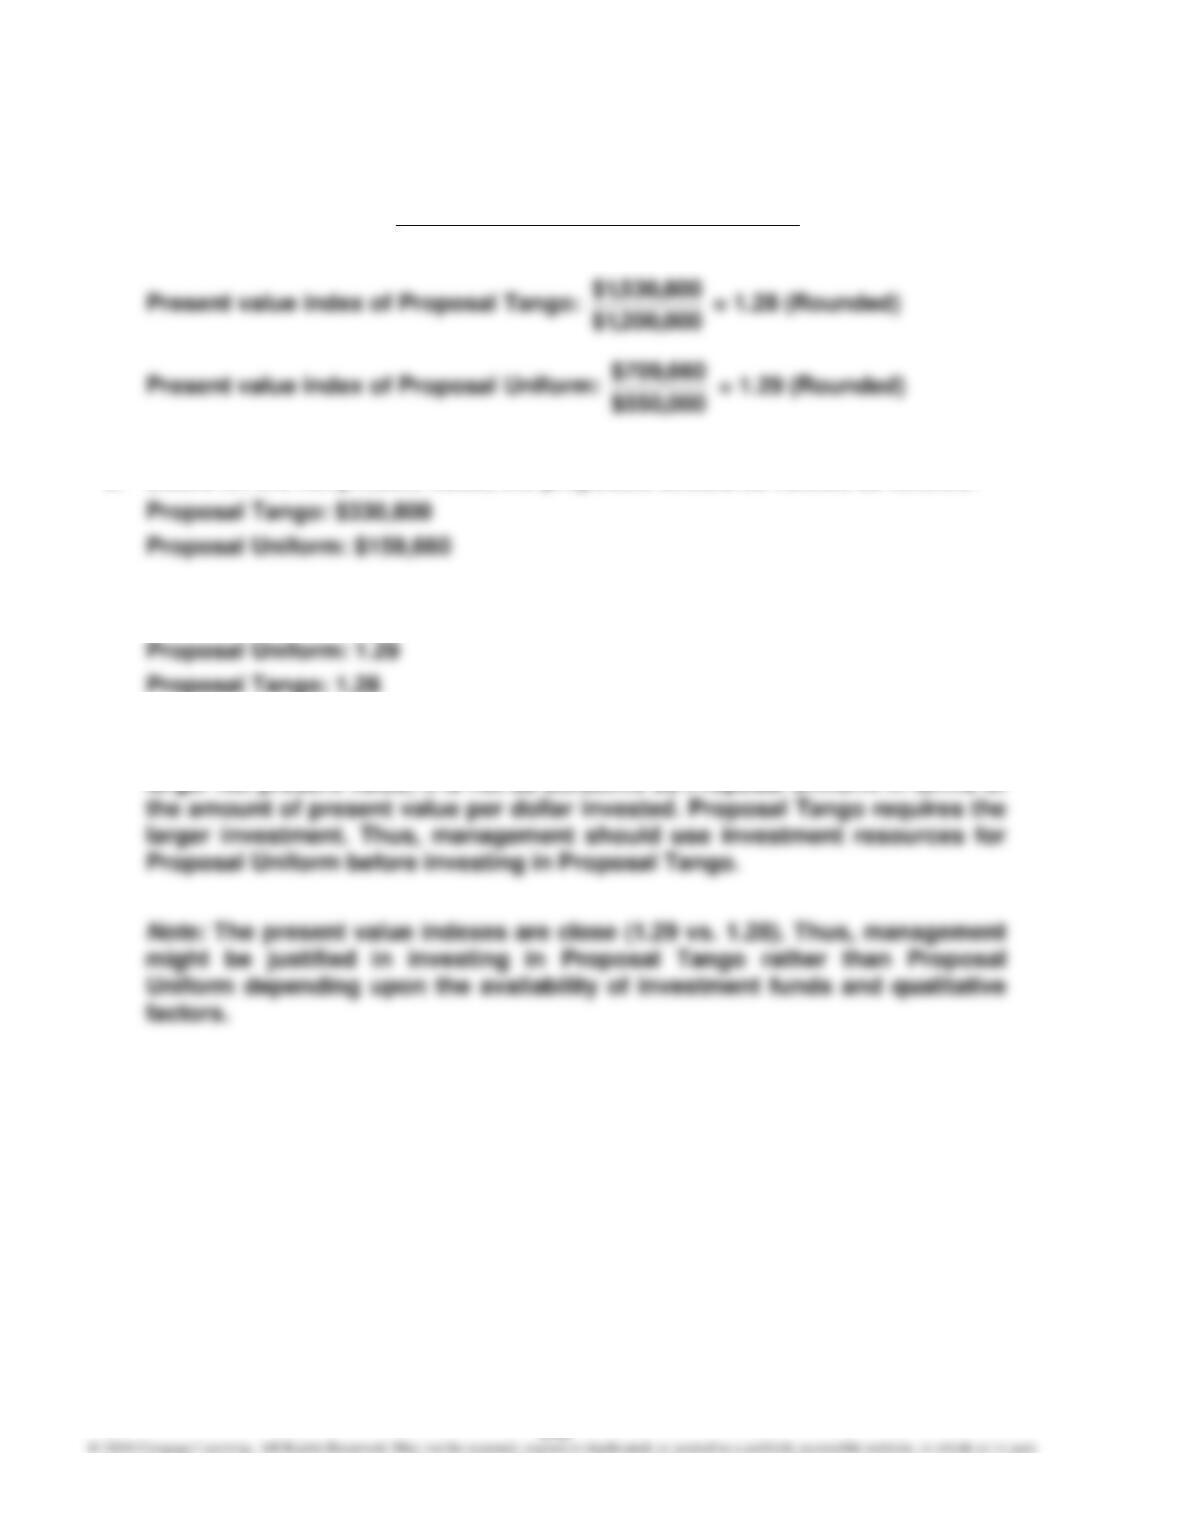
5. Present Value Index = Invested Be toAmount
Flow CashNet of luePresent Va Total
6. Based on the net present value, the proposals should be ranked as follows:
7. Based on the present value index, the proposals should be ranked as follows:
8. The present value indexes indicate that although Proposal Tango has the
larger net present value, it is not as attractive as Proposal Uniform in terms of
519
METRIC-BASED ANALYSIS
MBA 15–1
1. Return on Total Assets = $12,193
$174,304 = 7.0%
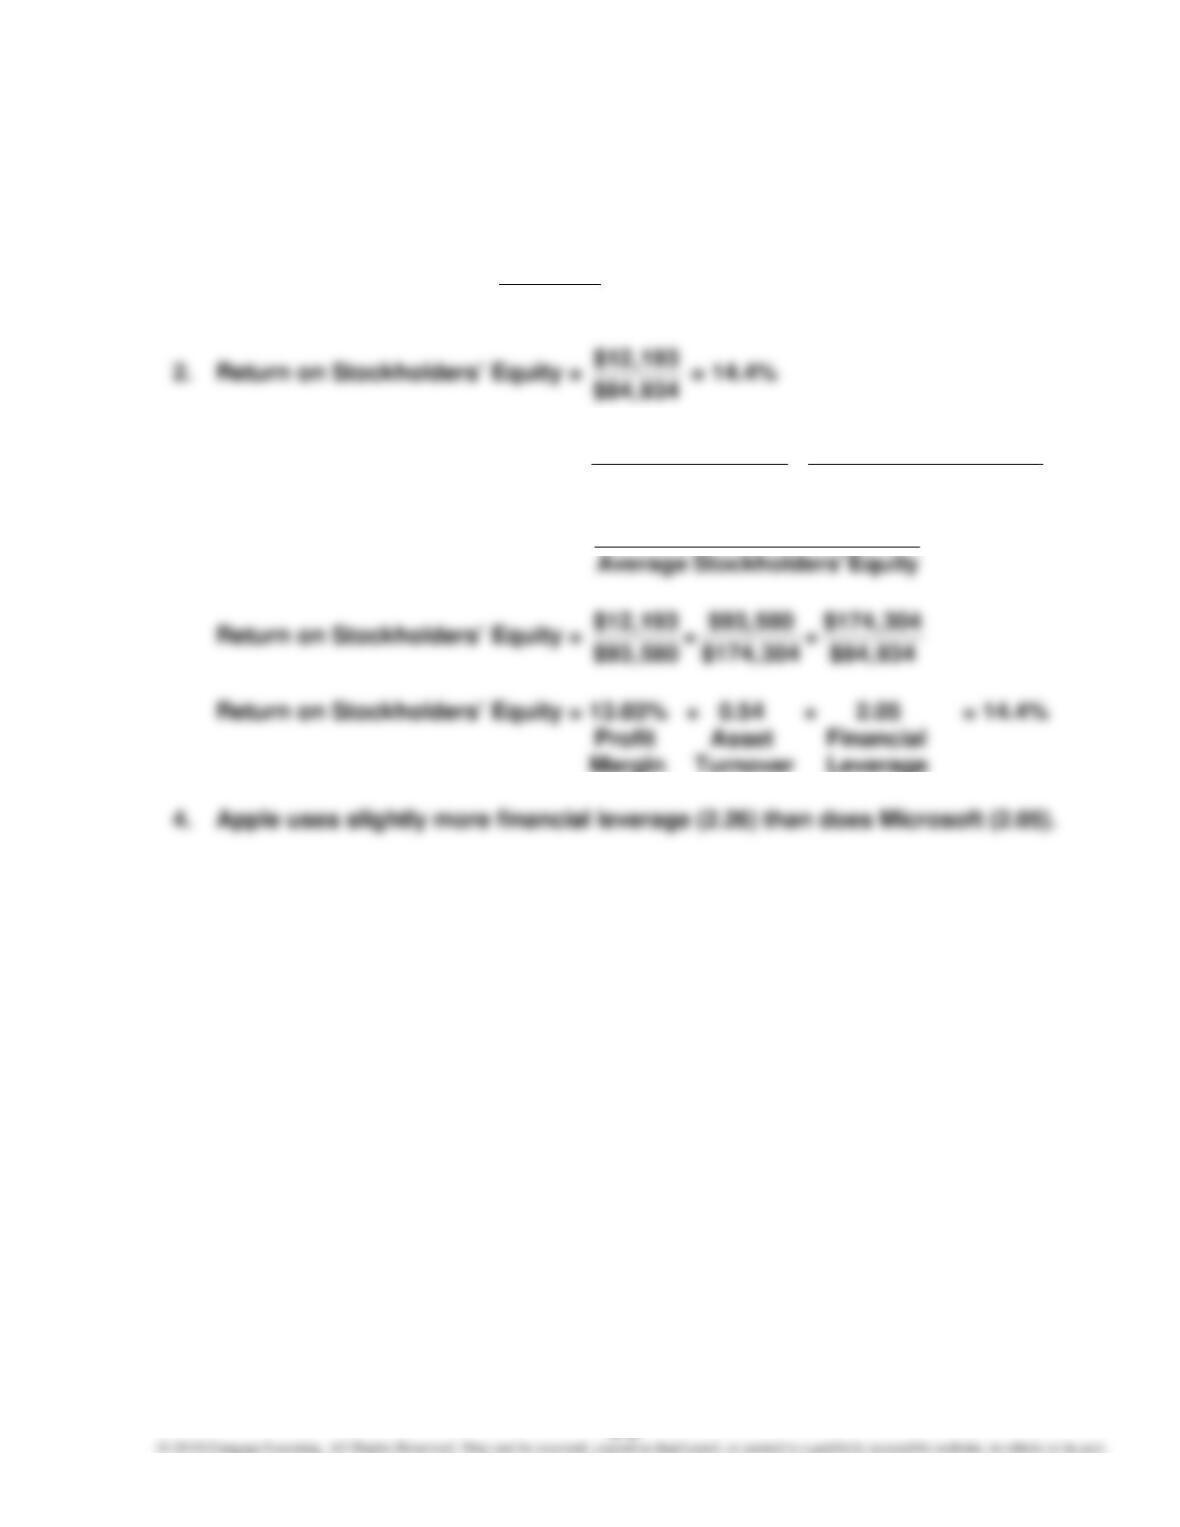
3. Return on Stockholders’ Equity = Operating Income Sales
××
Sales Average Total Assets
Average Total Assets
520
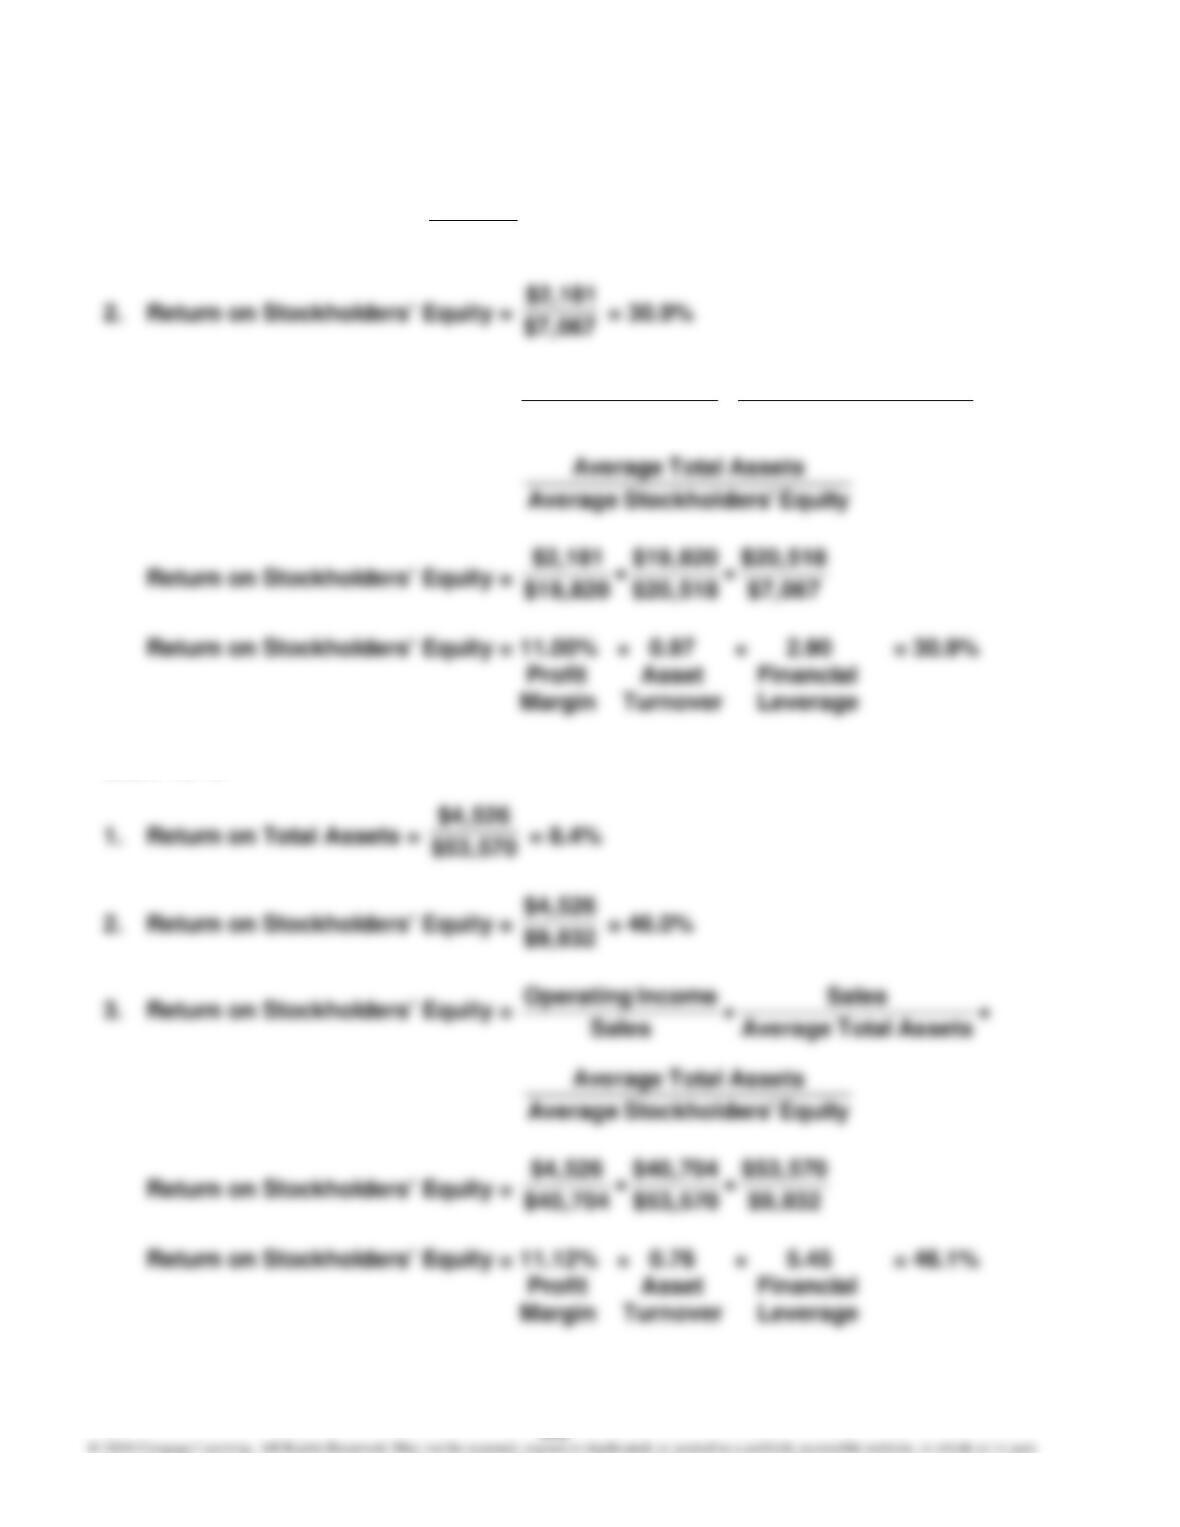
MBA 15–2
1. Return on Total Assets = $2,181
$20,518 = 10.6%
3. Return on Stockholders’ Equity = Operating Income Sales
××
Sales Average Total Assets
MBA 15–3