331
CHAPTER 11
COST-VOLUME-PROFIT ANALYSIS
CLASS DISCUSSION QUESTIONS
1. Total variable costs vary in direct proportion
11. A high contribution margin ratio, coupled
with idle capacity, indicates a potential for
sales to maximum capacity and to take
17. Operating leverage measures the relative
mix of a business’s variable costs and fixed
costs. It is computed as follows:
332
EXERCISES
E11–1
1. Fixed
9. Fixed
E11–2
E11–3
333
E11–4
E11–5
334
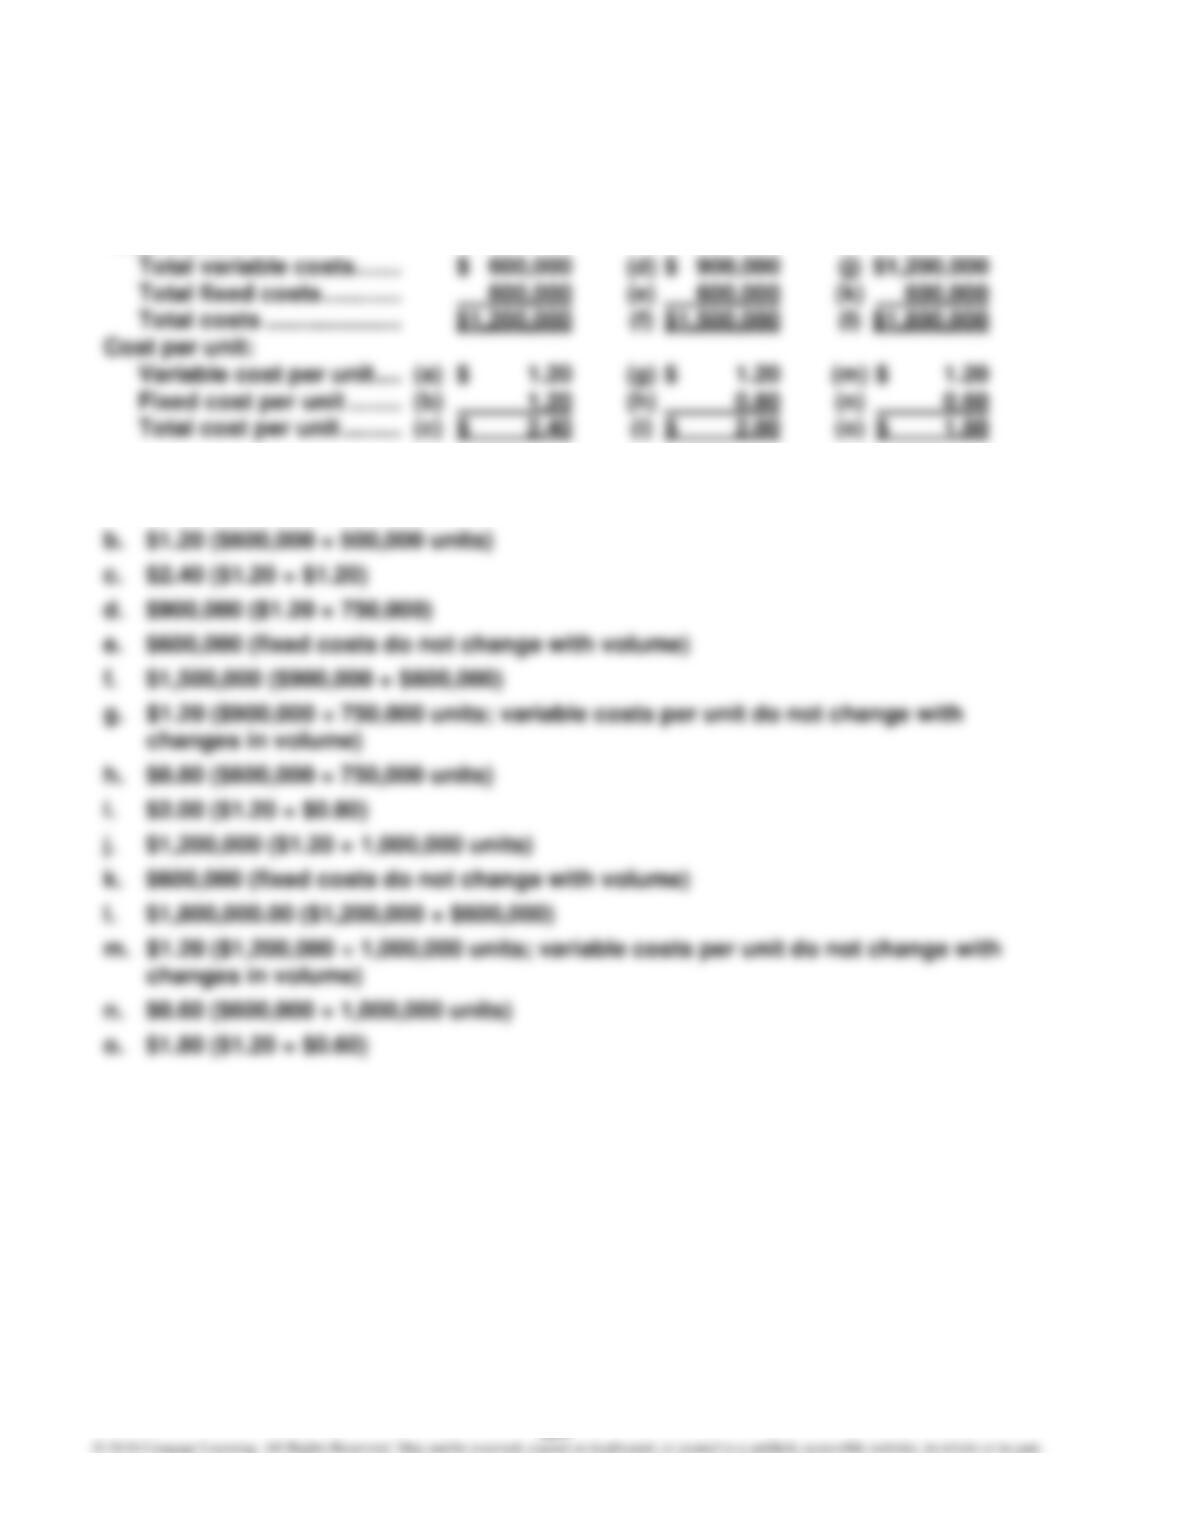
E11–6
Components produced …… 500,000 750,000 1,000,000
Total costs:
Supporting calculations:
a. $1.20 ($600,000 ÷ 500,000 units)
335
E11–7
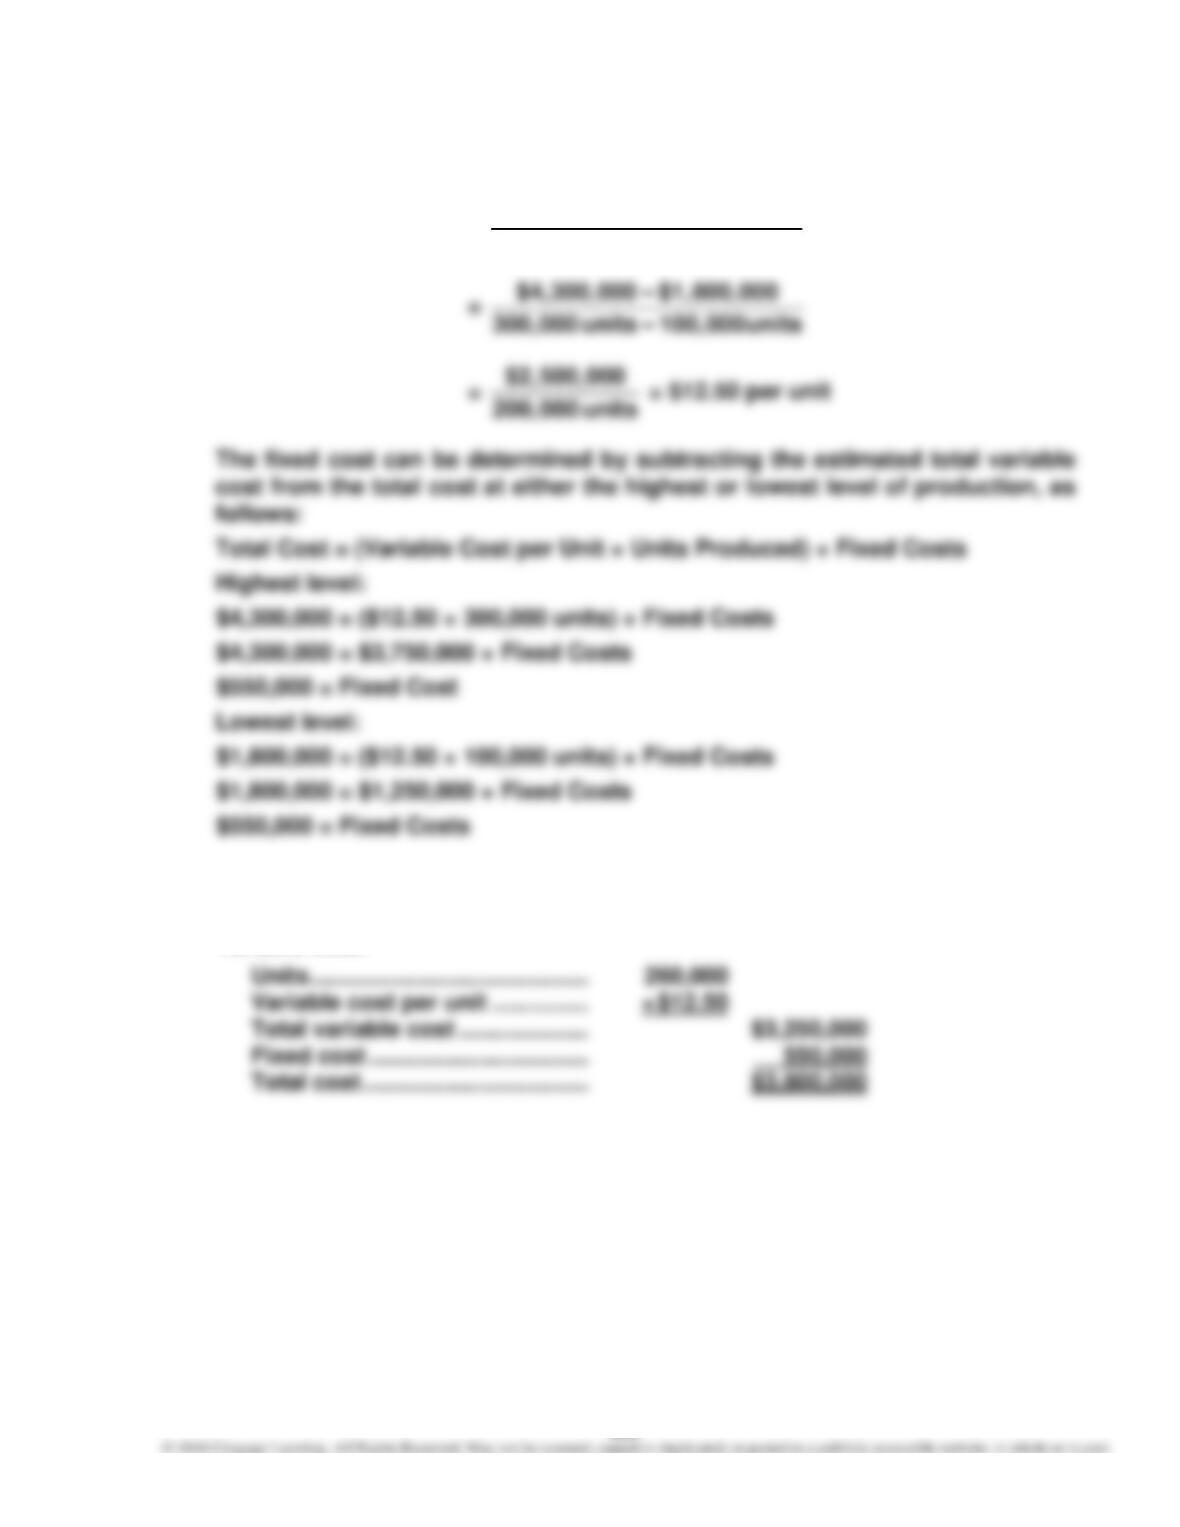
a. Variable Cost per Unit = Difference in Total Costs
Difference in Units Produced
b. Total Cost = (Variable Cost per Unit × Units Produced) + Fixed Costs
Total cost for 260,000 units:
Variable cost:
336
E11–8
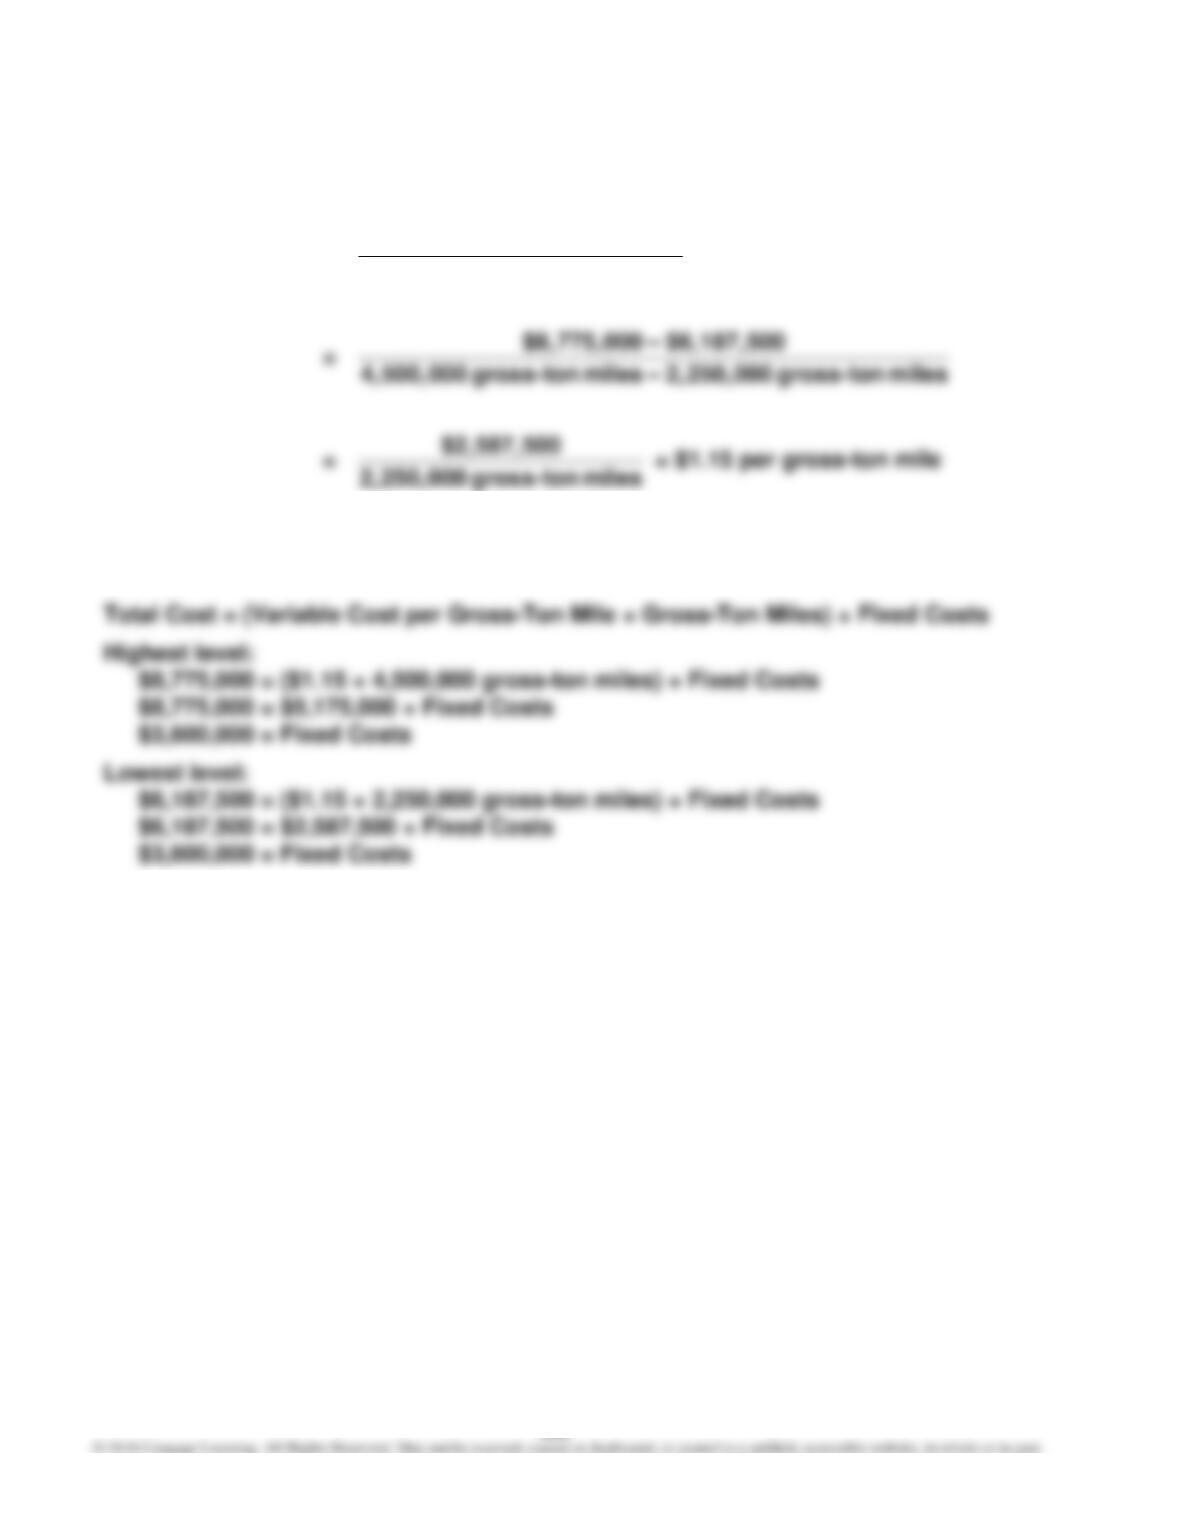
Gross-Ton Mile = Miles Ton–Gross in Difference
Costs Total in Difference
The fixed costs can be determined by subtracting the estimated total variable
cost from the total cost at either the highest or lowest level of gross-ton mile, as
follows:
Variable Cost per
337
E11–9
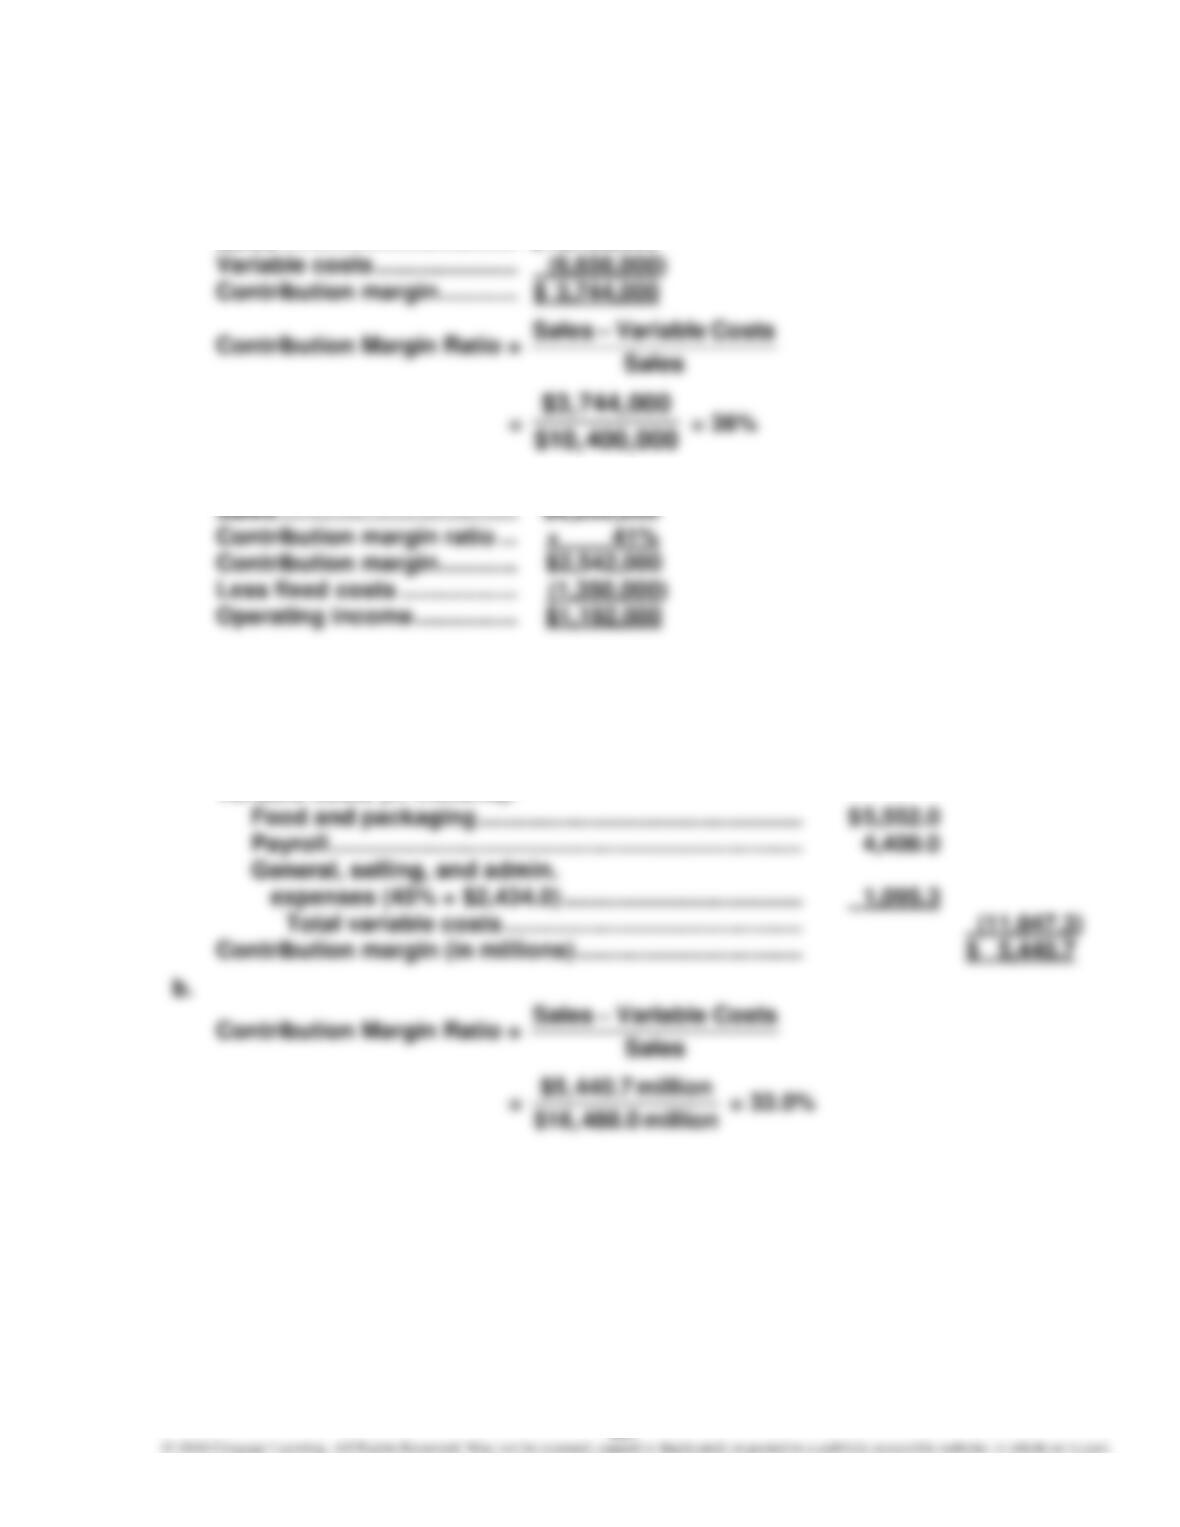
a.
Sales ………………………………. $10,400,000
b.
E11–10
a.
Sales (in millions) …………………………………………………… $ 16,488.0
Variable costs (in millions):
338
E11–10, Concluded
E11–11
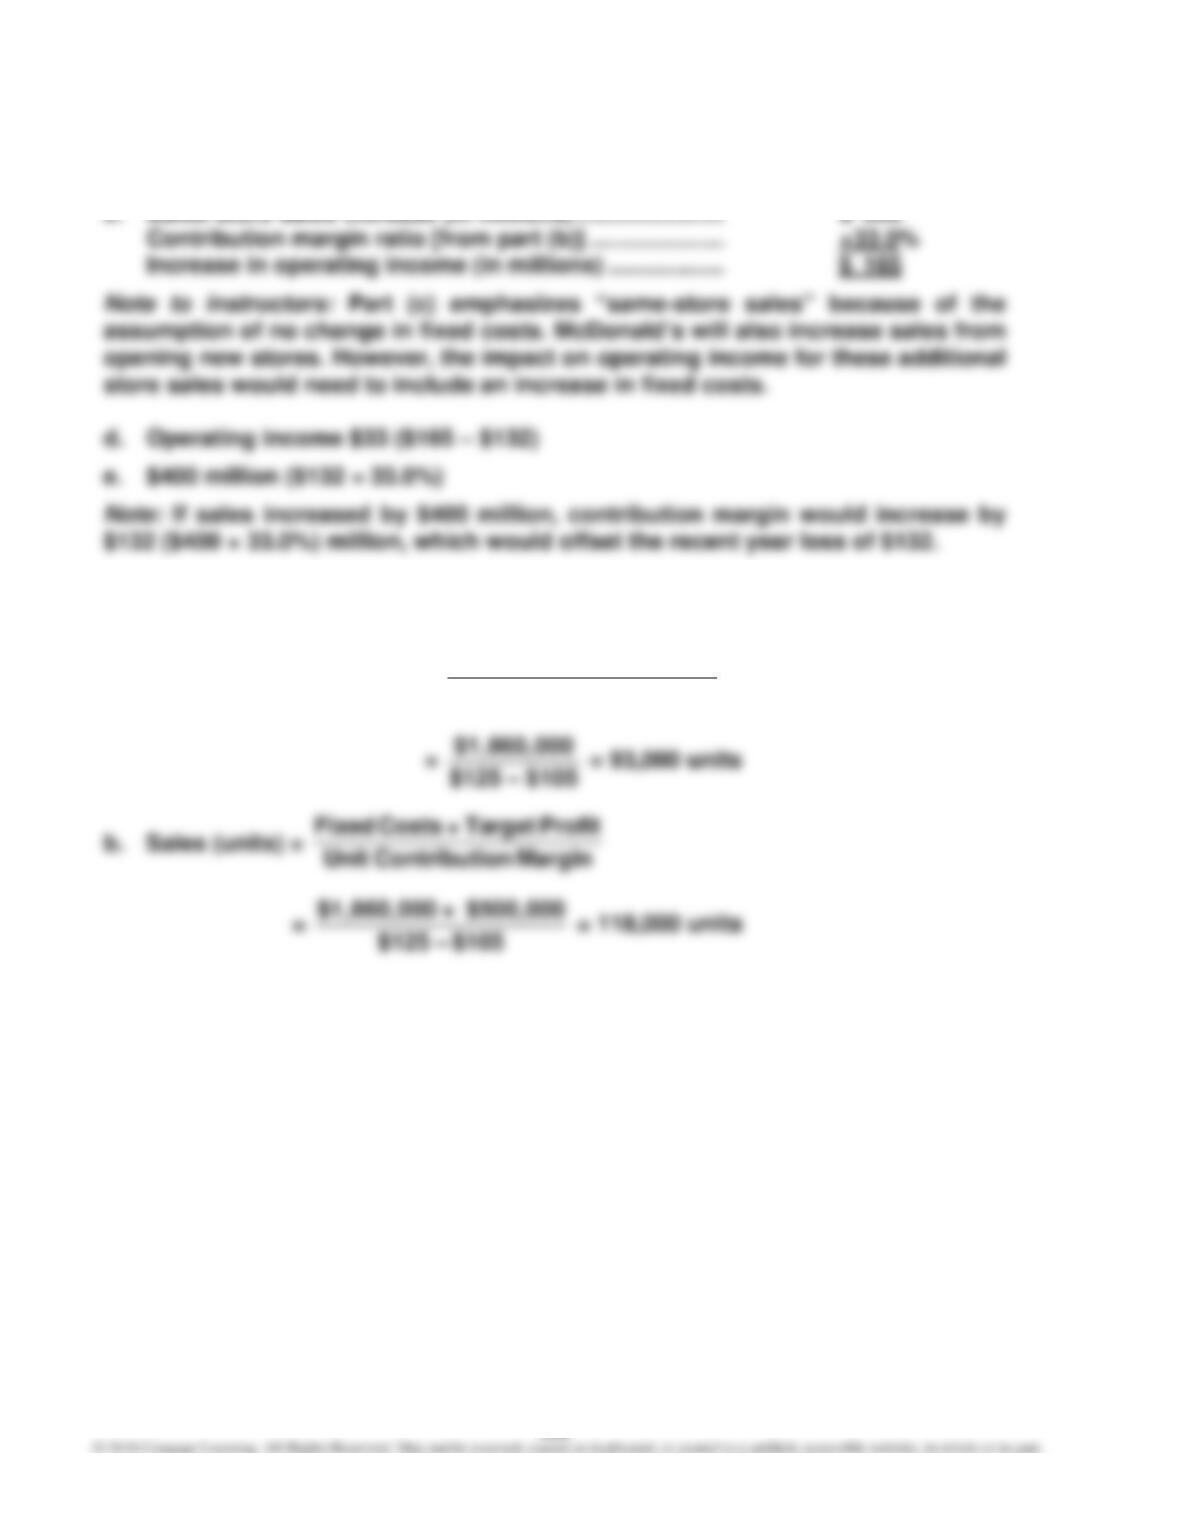
a. Break-Even Sales (units) = Margin onContributiUnit
Costs Fixed
339
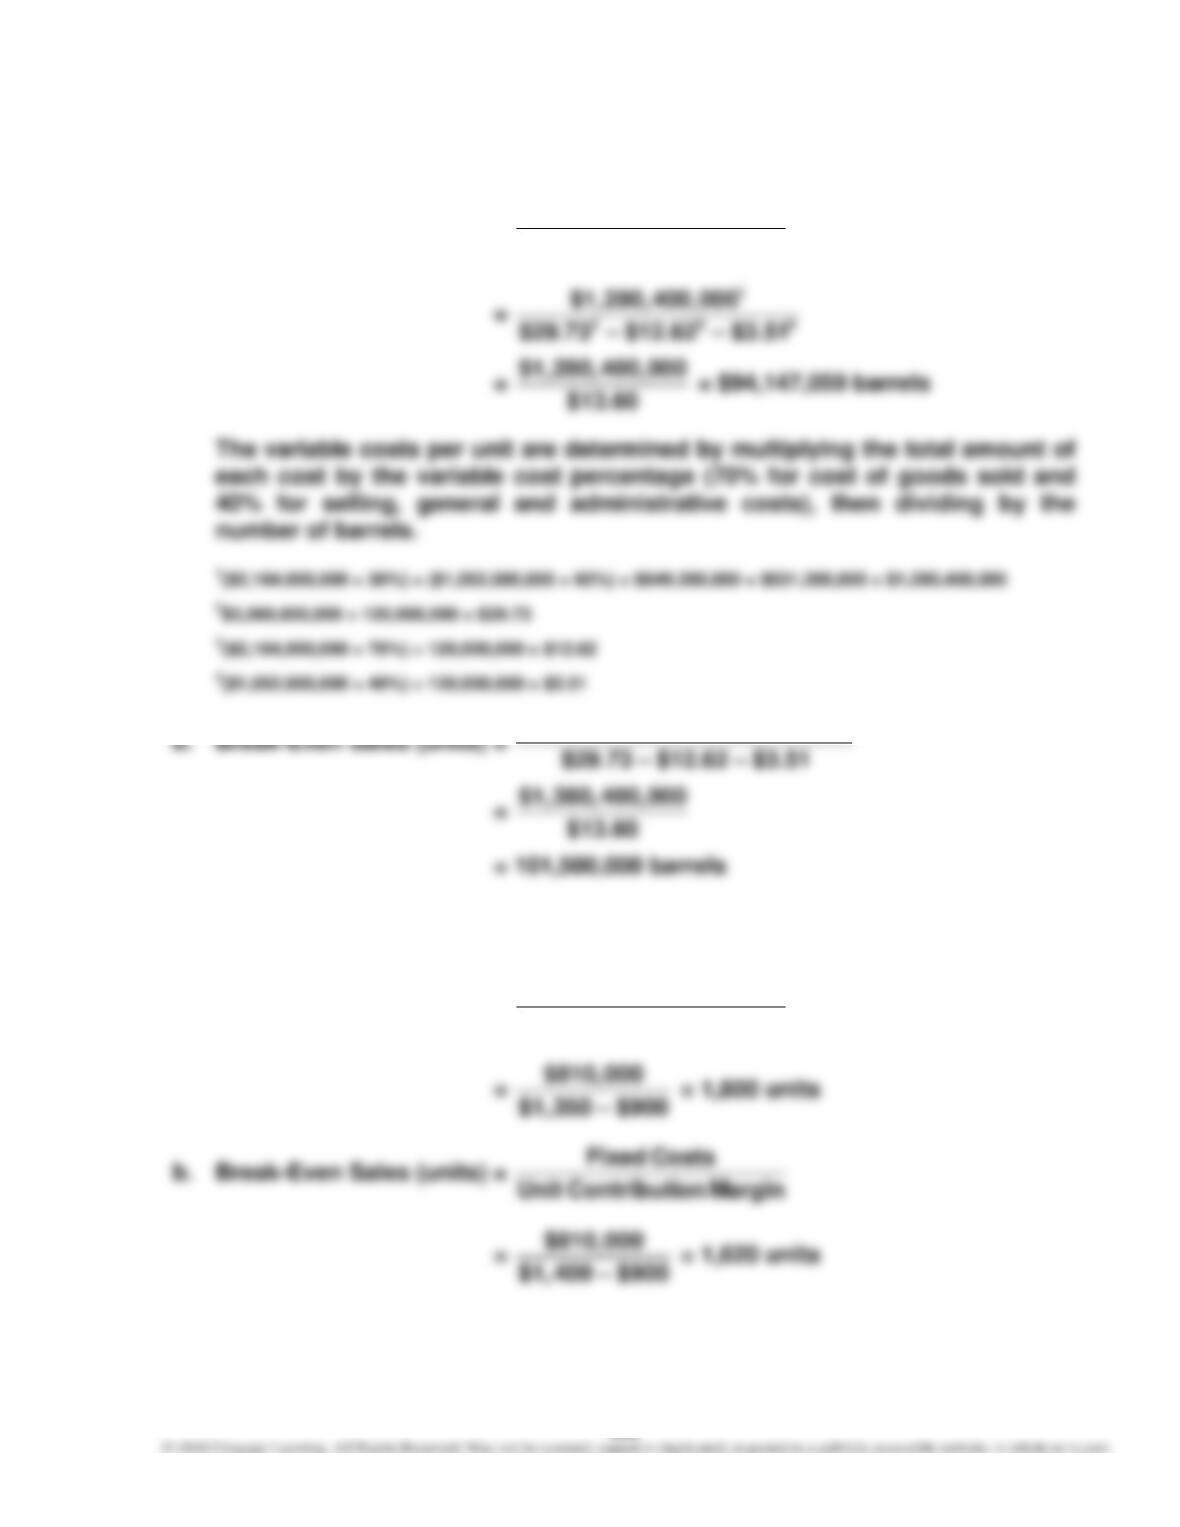
E11–12
a. Break-Even Sales (units) = Margin onContributiUnit
Costs Fixed
E11–13
a. Break-Even Sales (units) = arginM onContributiUnit
Costs Fixed