Chapter 12 CFIN5
Chapter 12 Solutions
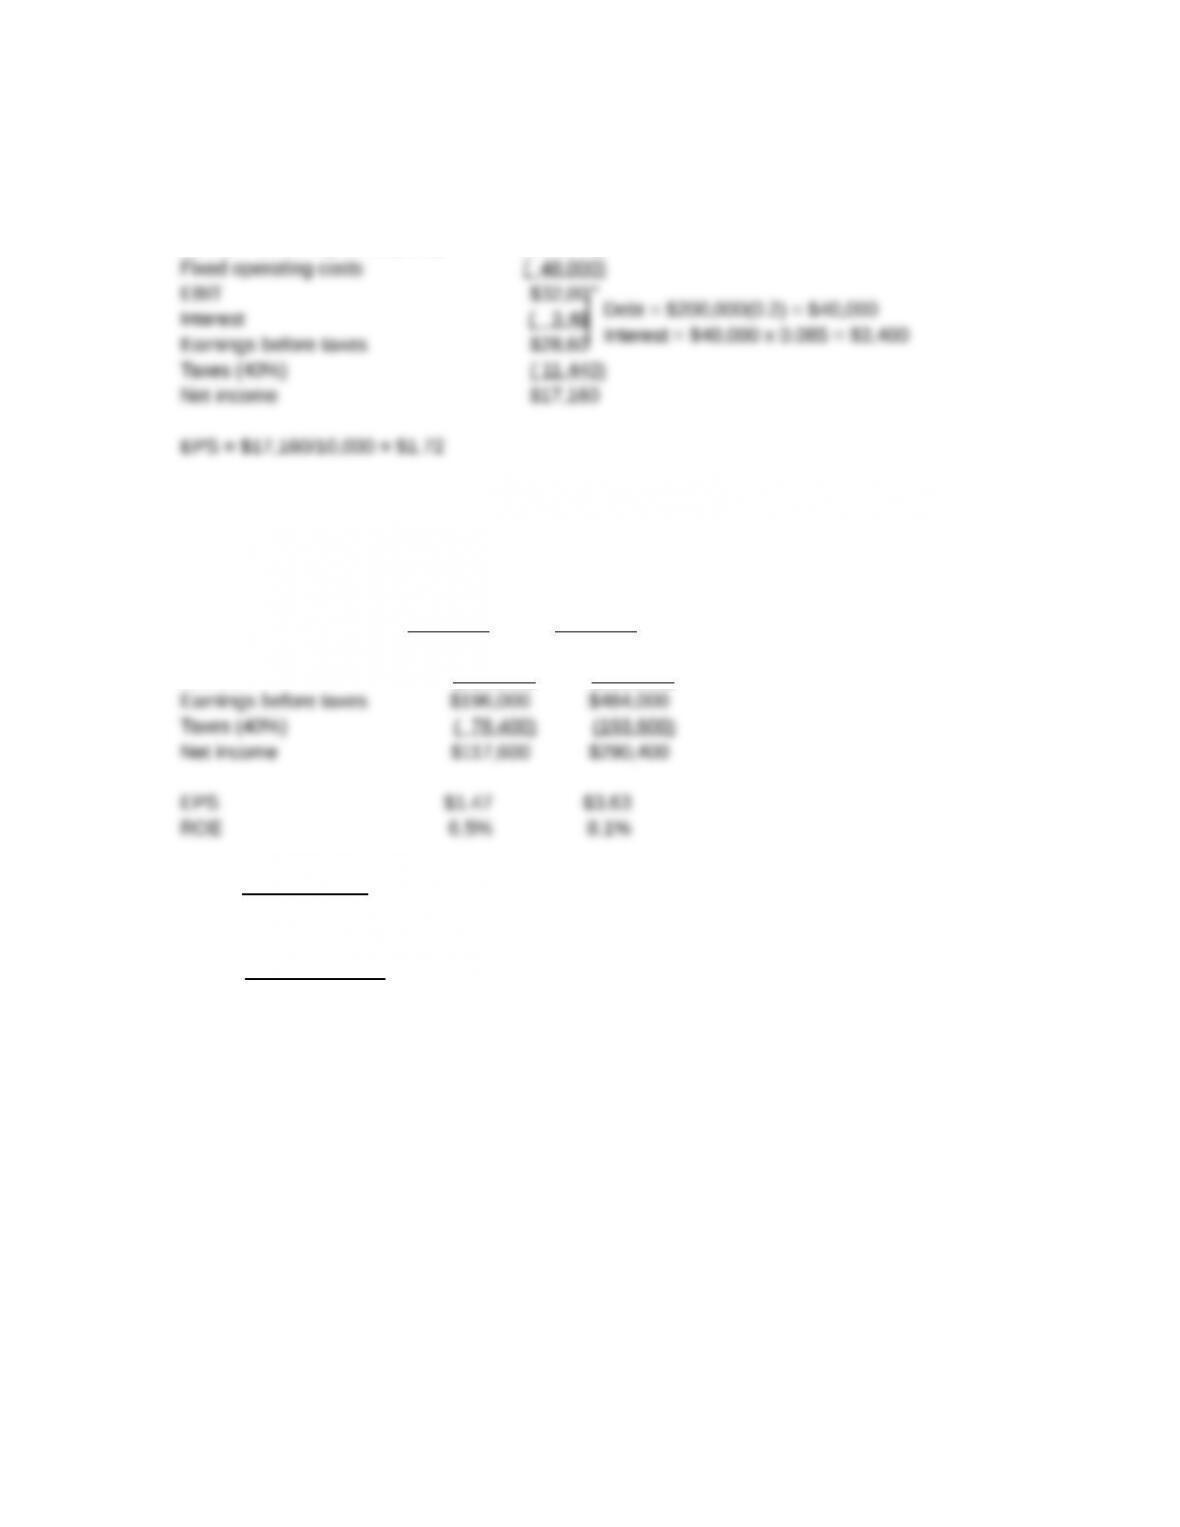
12-1 Sales $200,000
Variable operating costs (60%) (120,000)
12-2 Total assets = $6,000,000
Shares of stock = 80,000
EBIT = $700,000
70% debt 40% debt
EBIT $700,000 $700,000
Interest (504 ,000) (216 ,000)
Net income
EPS 80,000 shares
=
Net income
ROE Common equity
=
Amount of debt = Total assets x Debt/Assets ratio:
70% Debt: Total debt = $6,000,000(0.7) = $4,200,000; Equity = $6,000,000(0.3) = $1,800,000
40% debt: Total debt = $6,000,000(0.4) = $2,400,000; Equity = $6,000,000(0.6) = $3,600,000
Interest = Debt x Cost of debt
70% Debt: Interest = $4,200,000(0.12) = $504,000
40% debt: Interest = $2,400,000(0.09) = $ 216,000
The capital structure with 40 percent debt appears to be better, because both the EPS and ROE are
higher with this capital structure.
© 2017 Cengage Learning. All Rights Reserved. May not be scanned, copied or duplicated, or posted to a publicly
accessible website, in whole or in part.
Chapter 12 CFIN5
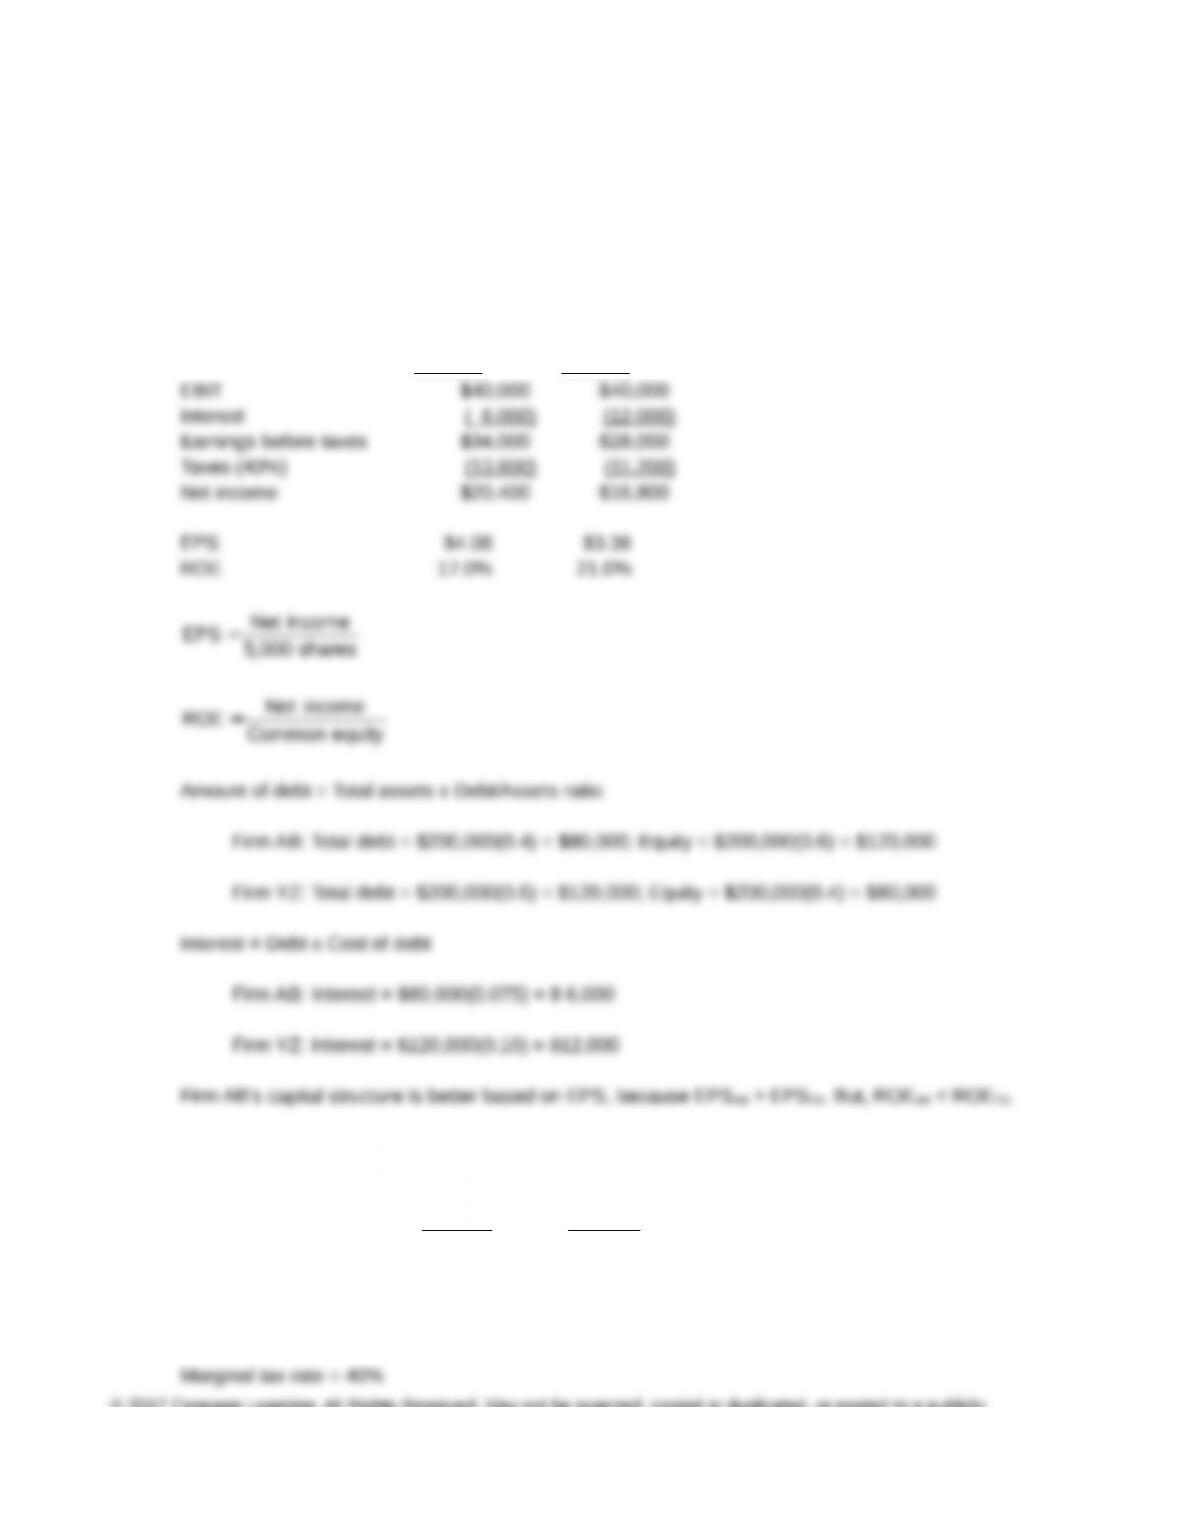
12-3 Both firms have the following characteristics:
Total assets = $200,000
Shares of stock = 5,000
EBIT = $40,000
Marginal tax rate = 40%
Firm AB Firm YZ
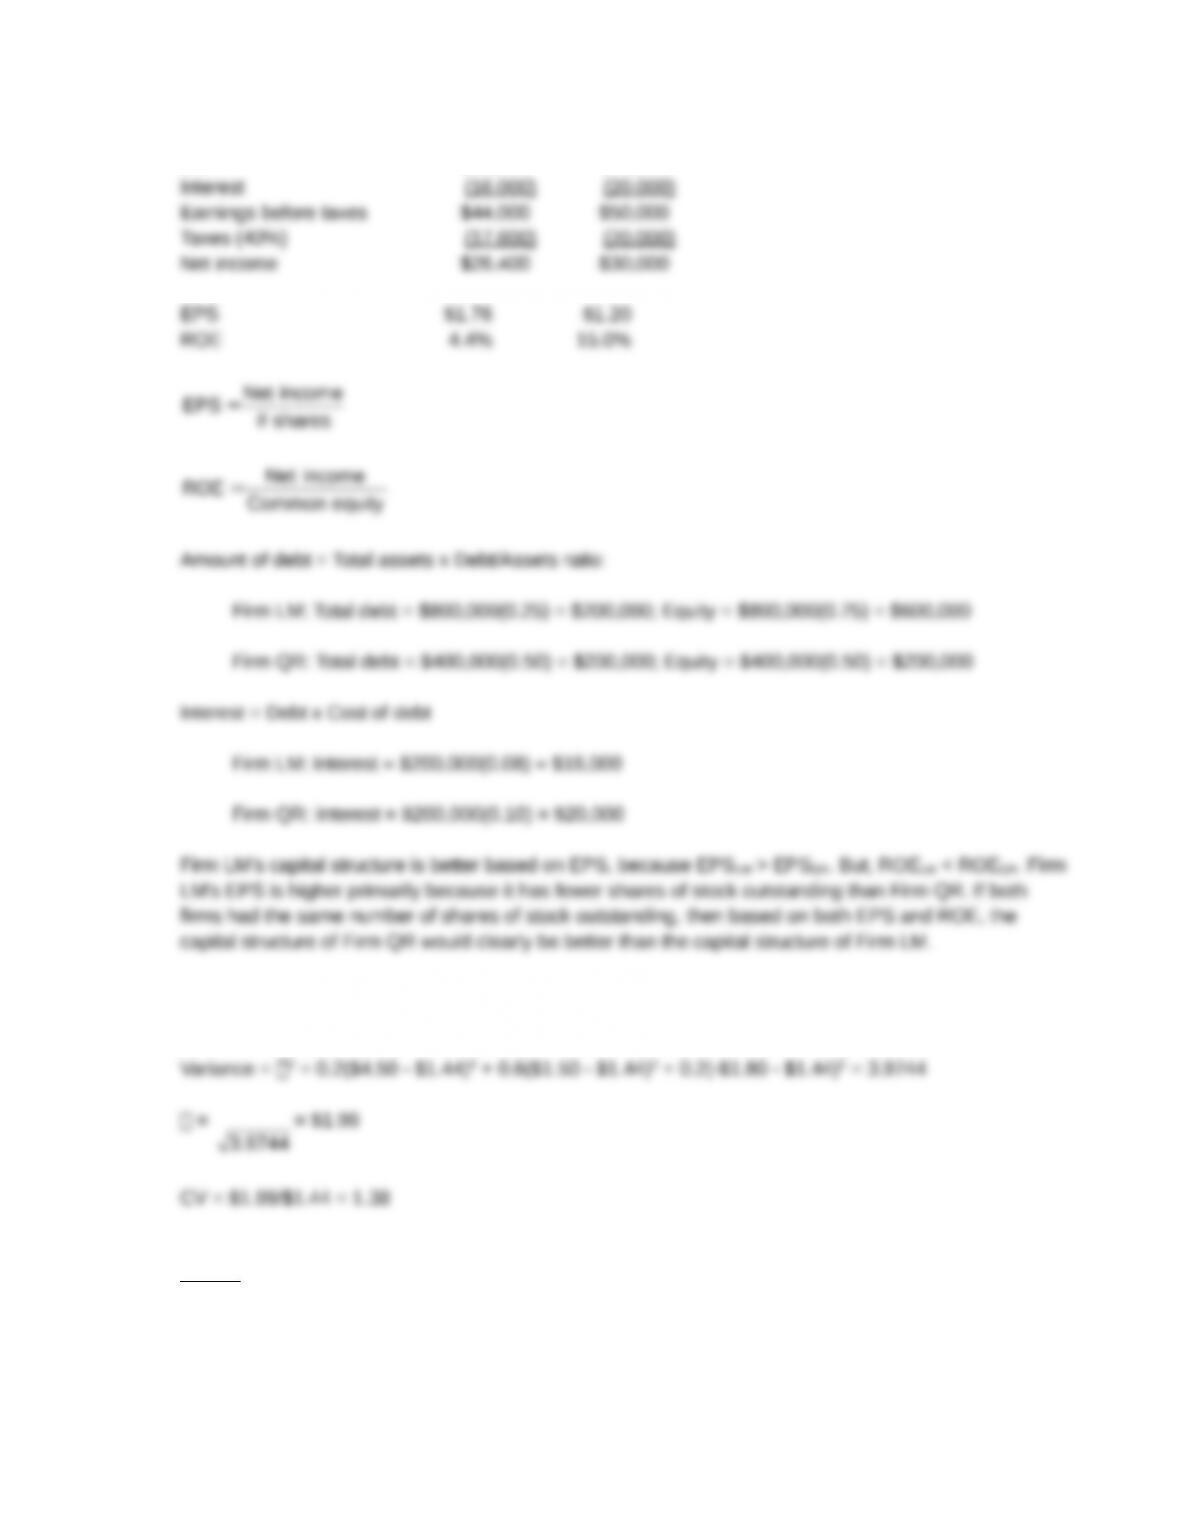
12-4 The following information is given:
Firm LM Firm QR
Total assets $800,000 $400,000
Shares of stock 15,000 25,000
EBIT $60,000 $70,000
Interest rate on debt 8% 10%
© 2017 Cengage Learning. All Rights Reserved. May not be scanned, copied or duplicated, or posted to a publicly
accessible website, in whole or in part.
Chapter 12 CFIN5
EBIT $60,000 $70,000
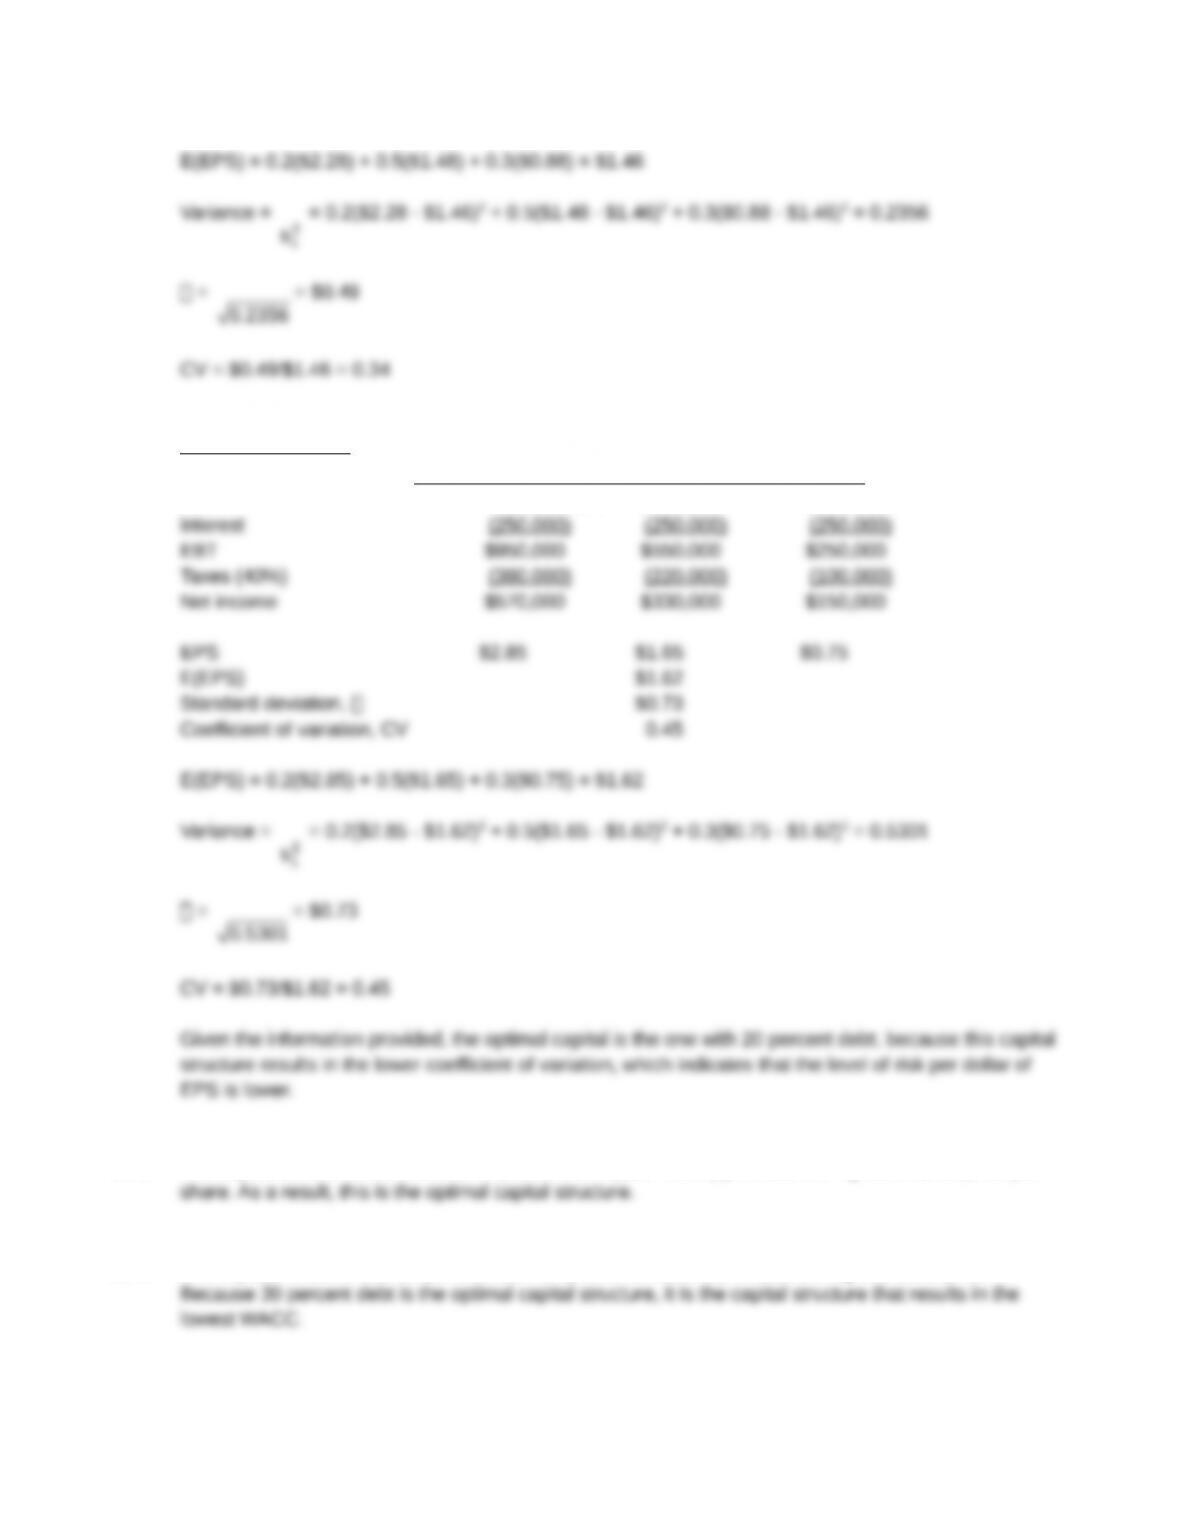
12-5 E(EPS) = 0.2($4.50) + 0.6($1.50) + 0.2(-$1.80) = $1.44
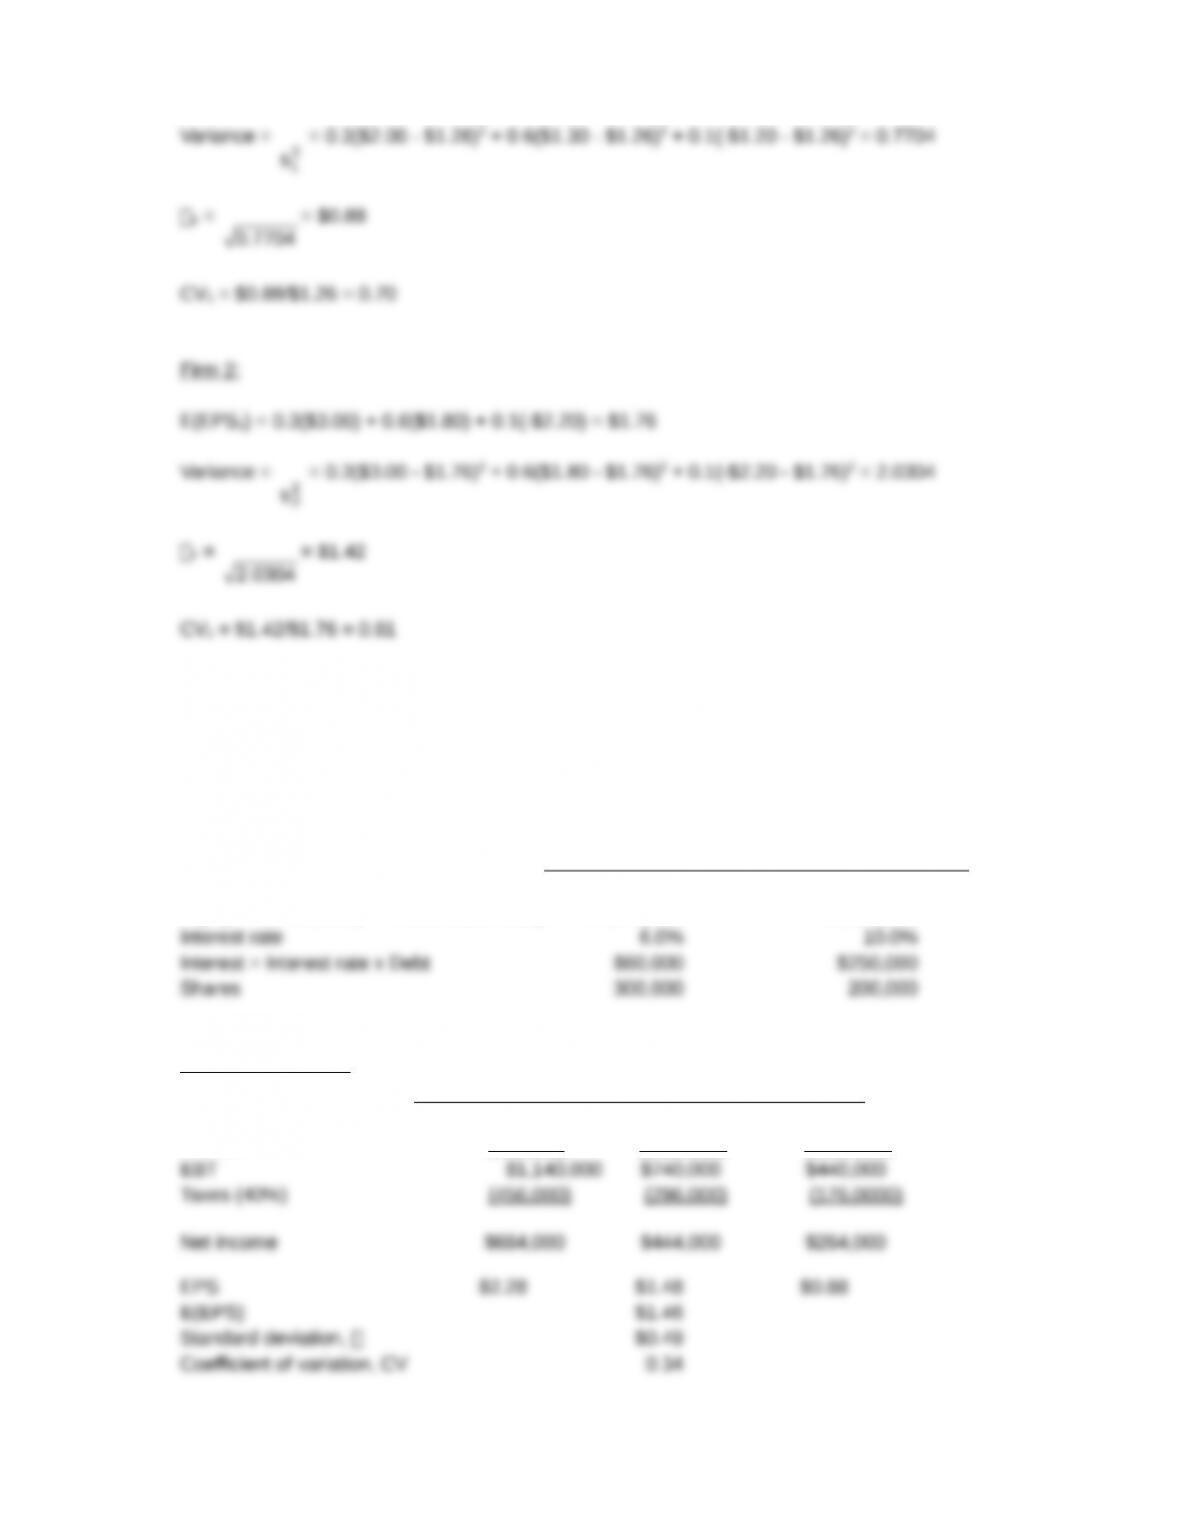
12-6 Firm 1:
E(EPS1) = 0.3($2.00) + 0.6($1.30) + 0.1(-$1.20) = $1.26
© 2017 Cengage Learning. All Rights Reserved. May not be scanned, copied or duplicated, or posted to a publicly
accessible website, in whole or in part.
Chapter 12 CFIN5
Chapter 12 CFIN5
Debt/Assets = 50%:
0.2 0.5 0.3
EBIT $1,200,000 $800,000 $500,000
12-8 The capital structure that contains 40 percent debt ($20 million) provides the highest market price per
12-9 The capital structure with 30 percent debt is optimal because it provides the highest stock price.
© 2017 Cengage Learning. All Rights Reserved. May not be scanned, copied or duplicated, or posted to a publicly
accessible website, in whole or in part.
Chapter 12 CFIN5
12-10
= = =
Gross profit $45,000
DOL 1.8
NOI $25,000
= = =
NOI $25,000
DFL 2.5
Earnings before taxes $10,000
= = =
= ´ = ´ =
Gross profit $45,000
DTL 4.5
Earnings before taxes $10,000
DOL DFL 1.8 2.5 4.5
12-11 If they turn out to be $940,500, sales will be 4.5 percent higher than forecast:
Actual Forecasted
Forecasted
Sales Sales $313,500 $300,000
% Difference 0.045 4.5%
Sales $300,000
––
= = = =
Because DOL = 3.2,
EBITActual = $180,000[1 + (0.045)(3.2)] = $180,000(1.144) = $205,920
12-12
D
=D
% in NOI
DOL % in sales
( )
( )
é ù
–
ê ú
ë û
=é ù
–
ê ú
ë û
–
= =
–
$2,300,000 $2,500,000
$2,500,000
DOL $880,000 $1,000,000
$1,000,000
0.08 0.67
0.12
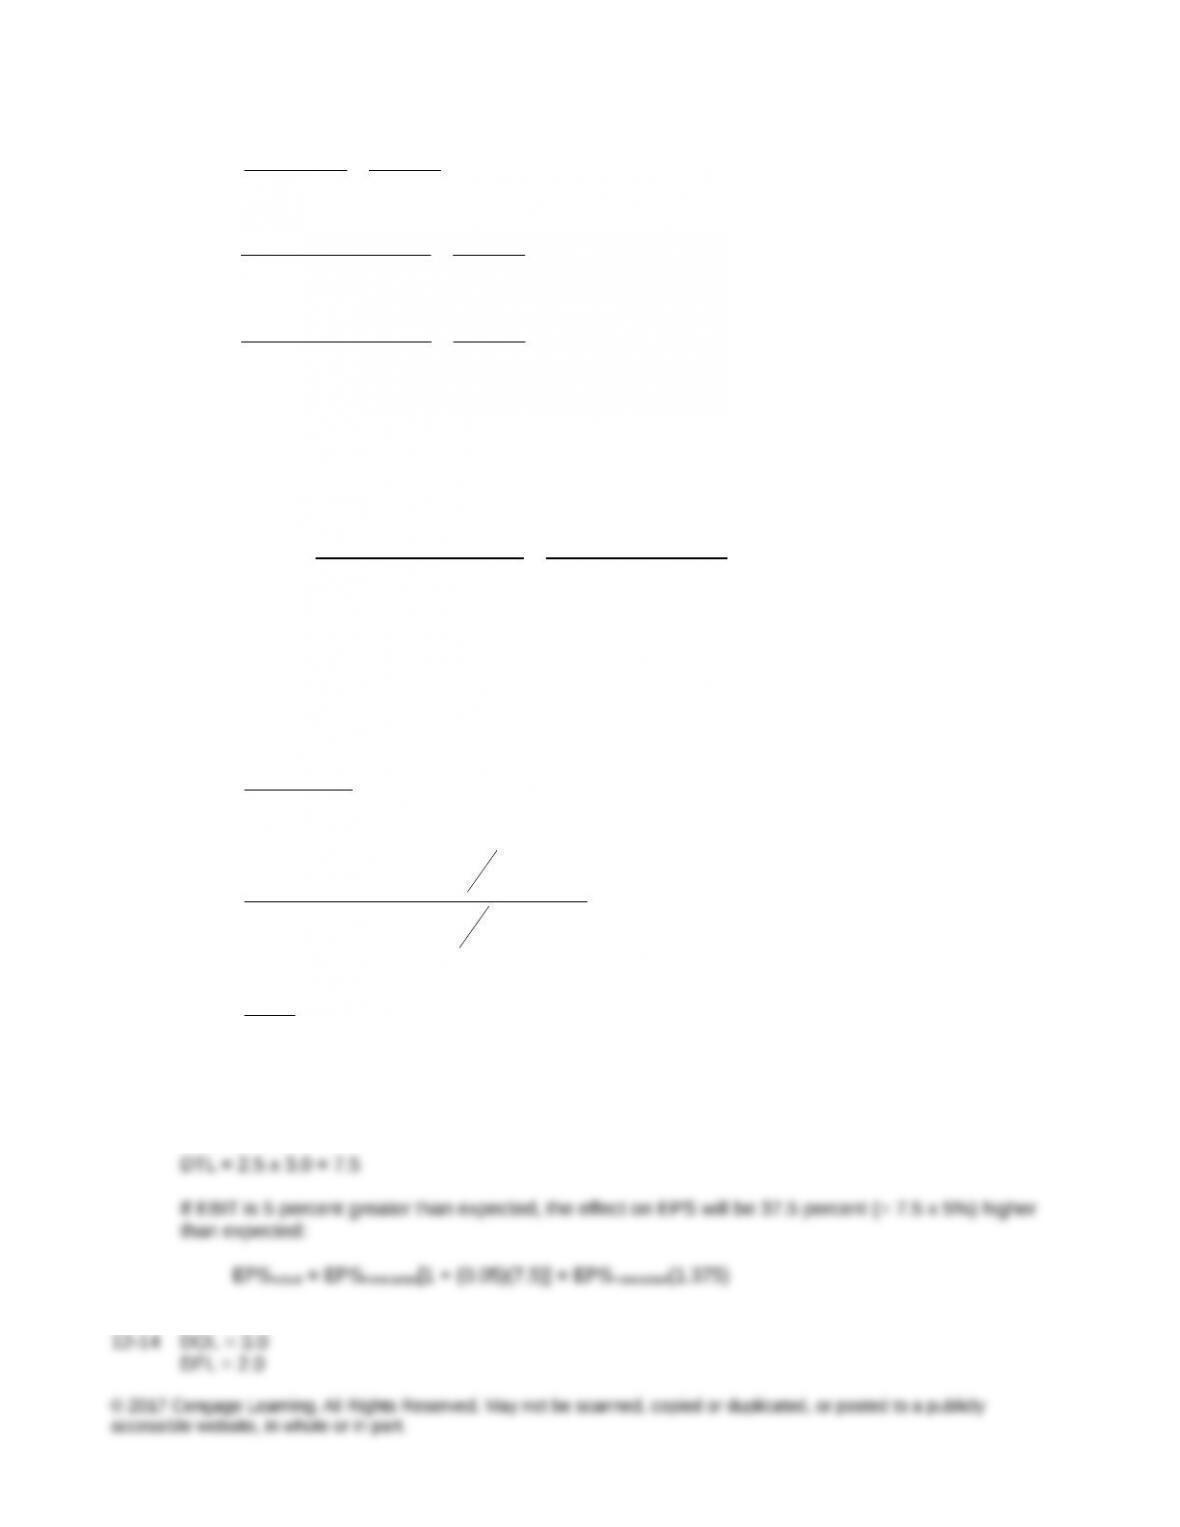
12-13 DOL = 2.5
DFL = 3.0
© 2017 Cengage Learning. All Rights Reserved. May not be scanned, copied or duplicated, or posted to a publicly
accessible website, in whole or in part.
Chapter 12 CFIN5
12-15 DFL = 4.0
D
= = =
D
% in EPS 36%
DTL 6.0
% in sales 6%
DTL = DOL x DFL
6.0 = DOL x 4.0
DOL = 6.0/4.0 = 1.5
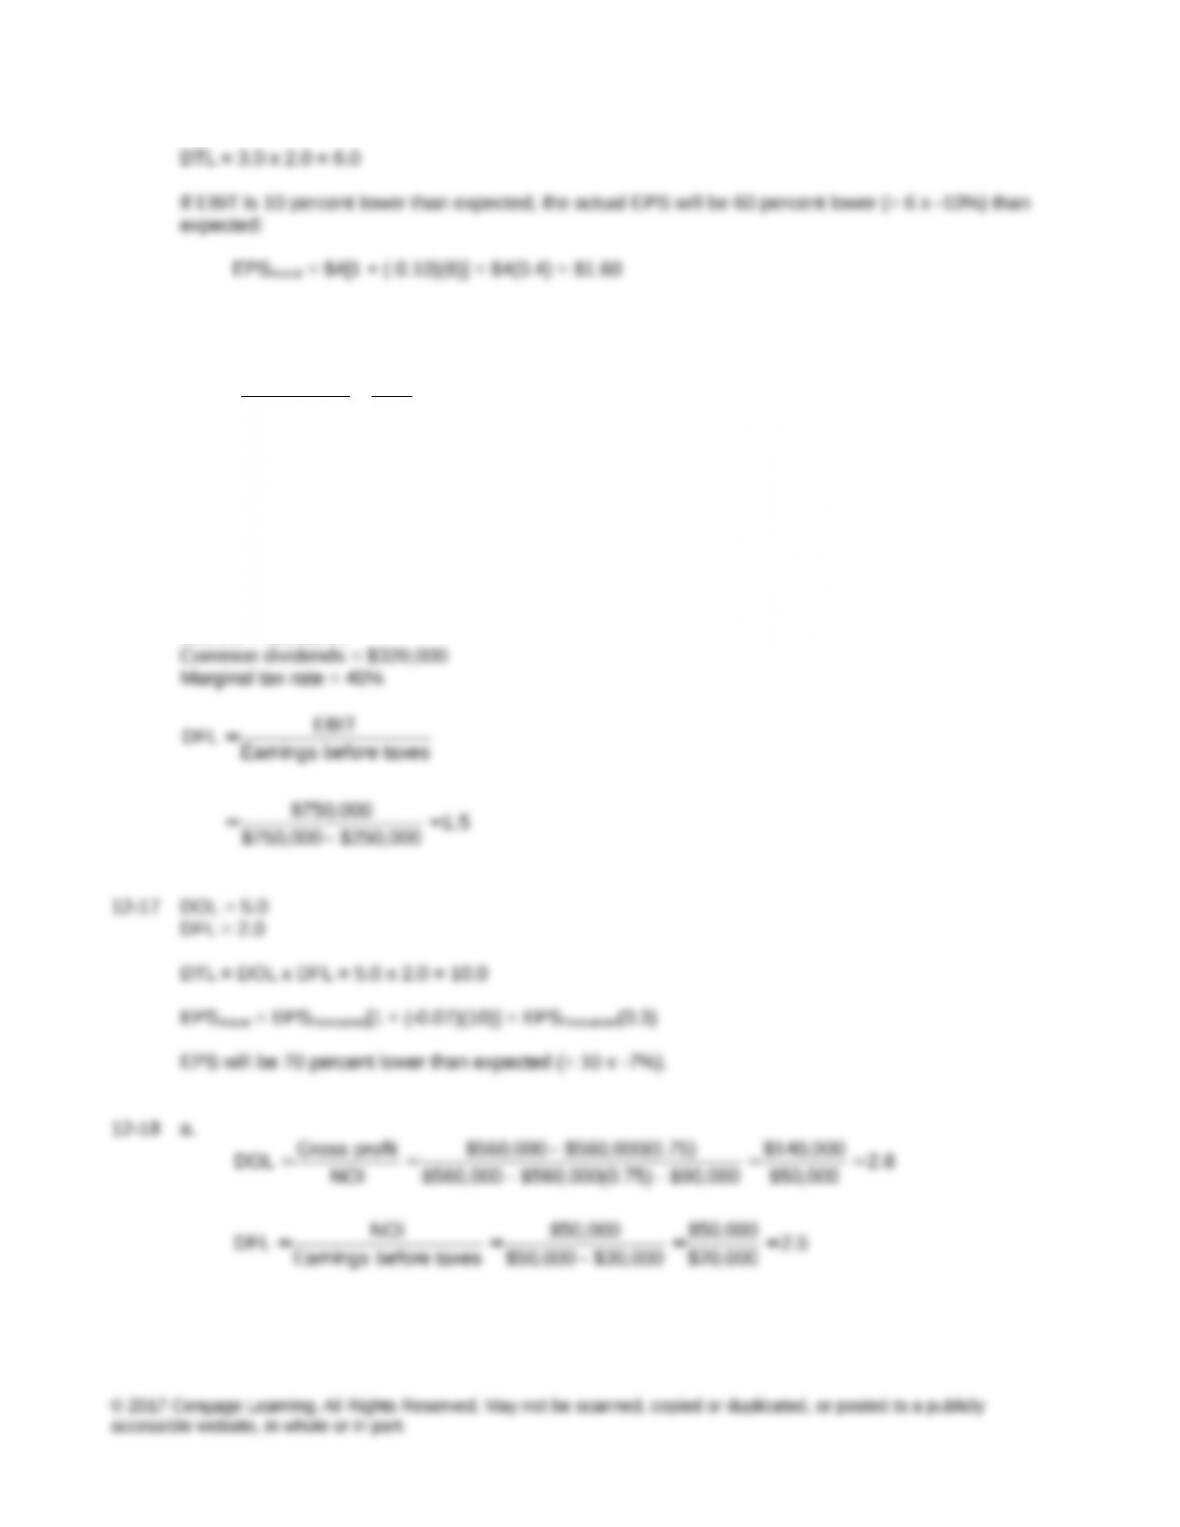
12-16 EBIT = $750,000
Interest = $250,000
Chapter 12 CFIN5
= = =
= ´ = ´ =
Gross profit $140,000
DTL 7.0
Earnings before taxes $20,000
DOL DFL 2.8 2.5 7.0
b. If sales turn out to be $588,000 rather than $560,000, the percent increase from the forecasted
amount is:
–= =
$588,000 $560,000
% difference in sales= 0.05 5.0%
$560,000
EBITActual = $50,000[1 + (0.05)(2.8)] = $50,000(1.14) = $57,000
EPSActual = $20,000(1 – 0.35)[1 + (0.05)(7.0)] = $13,000(1.35) = $17,550
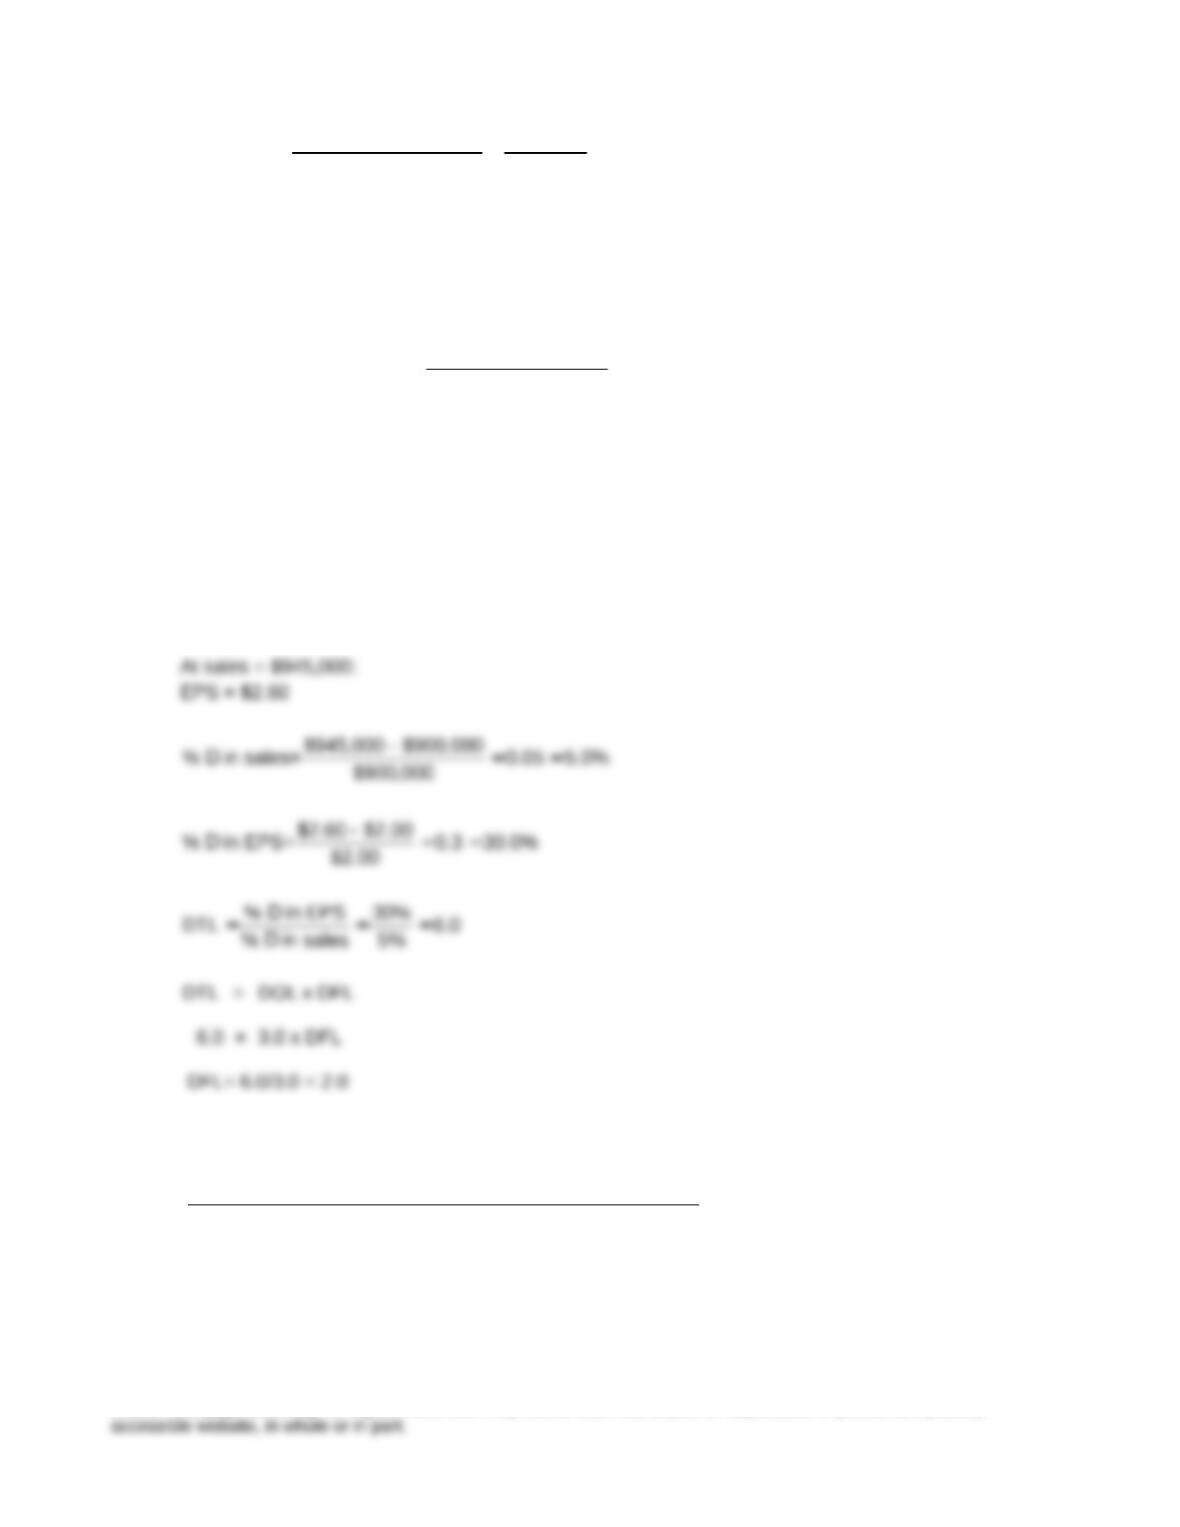
12-19 At sales = $900,000:
DOL = 3.0
Forecasted EPS = $2.00
12-20 The following table summarizes the degrees of leverage for EAR:
Company DOL DFL DTL
Acme 1.5 6.0 9.0
Apex 3.0 4.0 12.0
Alps 5.0 2.0 10.0
Because Apex has the highest DTL, it would be considered the riskiest firm.
© 2017 Cengage Learning. All Rights Reserved. May not be scanned, copied or duplicated, or posted to a publicly
Chapter 12 CFIN5
© 2017 Cengage Learning. All Rights Reserved. May not be scanned, copied or duplicated, or posted to a publicly
accessible website, in whole or in part.