1
2
3
4
5
6
7
8
9
10
11
12
19
20
21
22
23
30
31
32
33
34
41
42
43
44
45
52
53
54
55
56
A B C D E F G H I
Features of Common Stock
1. Common Stock represents ownership. 2. Ownership implies control. 3. Stockholders elect directors. 4. Directors hire
10/28/2015
Situation
Classified Stock
Classified Stock carries special provisions. For example, shares could be classified as founders’ shares which come with
voting rights but dividend restrictions.
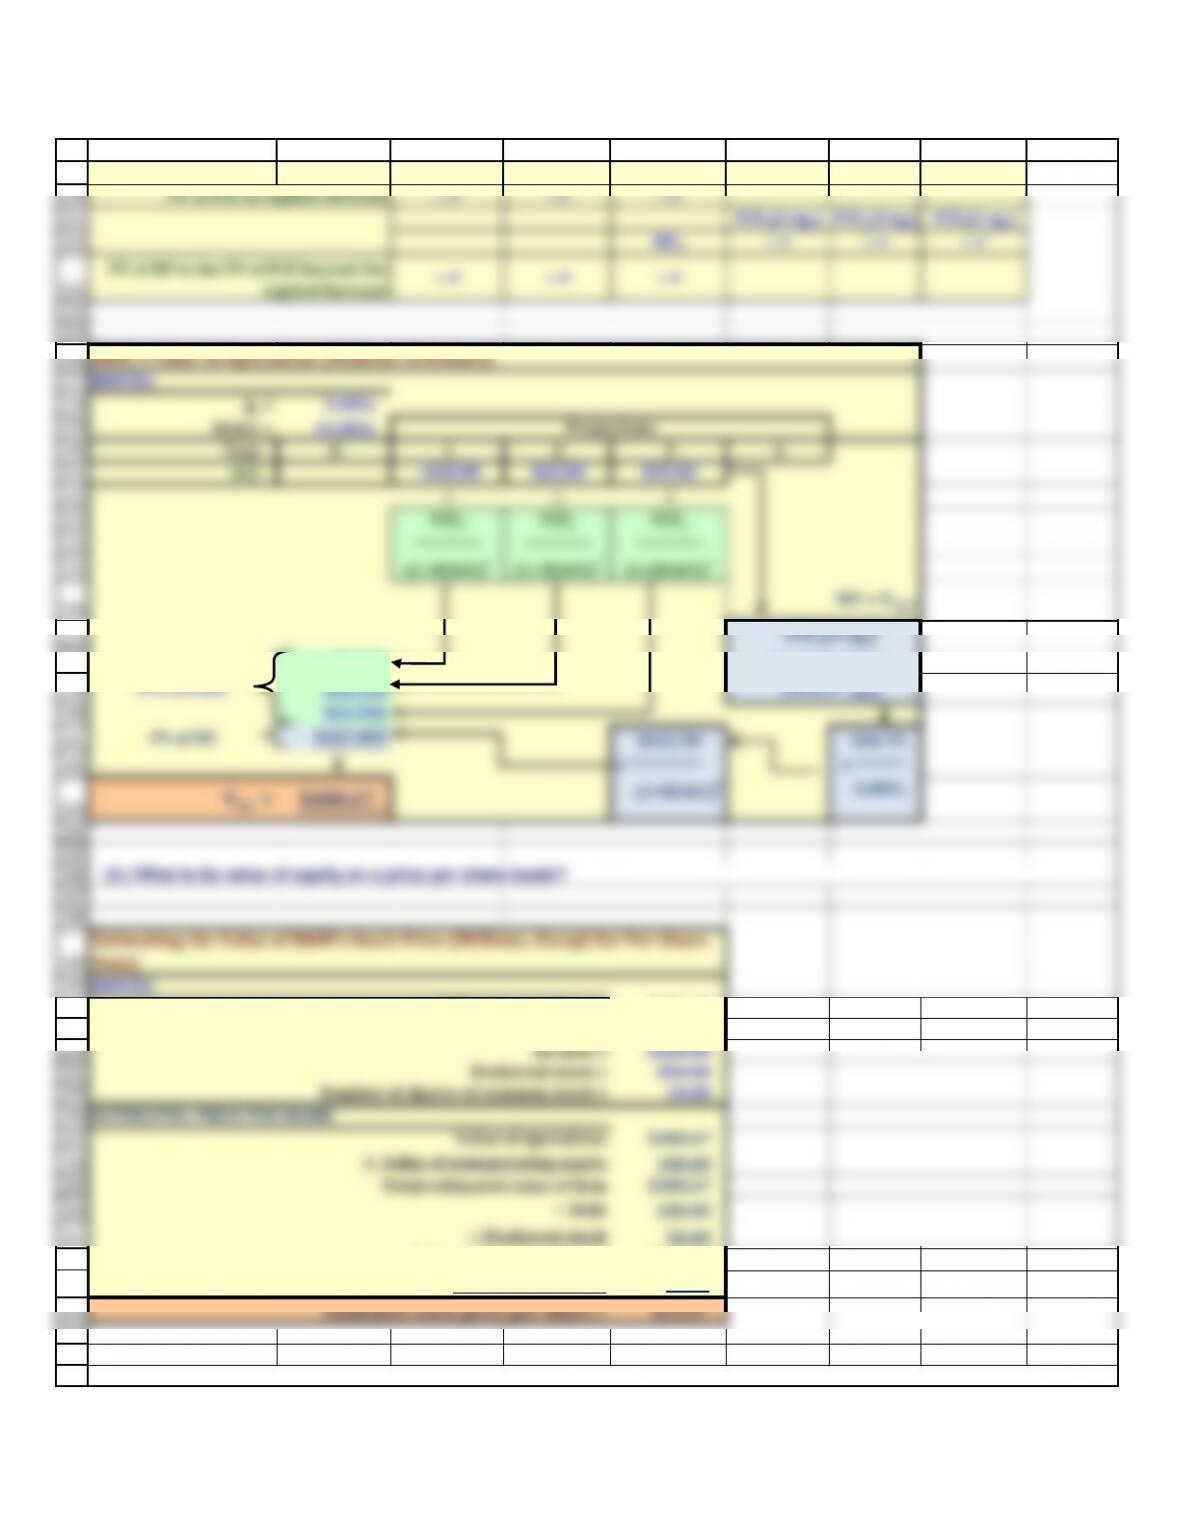
Chapter 7 Mini Case
Your employer, a mid-sized human resources management company, is considering expansion into related fields, including
the acquisition of Temp Force Company, an employment agency that supplies word processor operators and computer
programmers to businesses with temporary heavy workloads. Your employer is also considering the purchase of Biggerstaff &
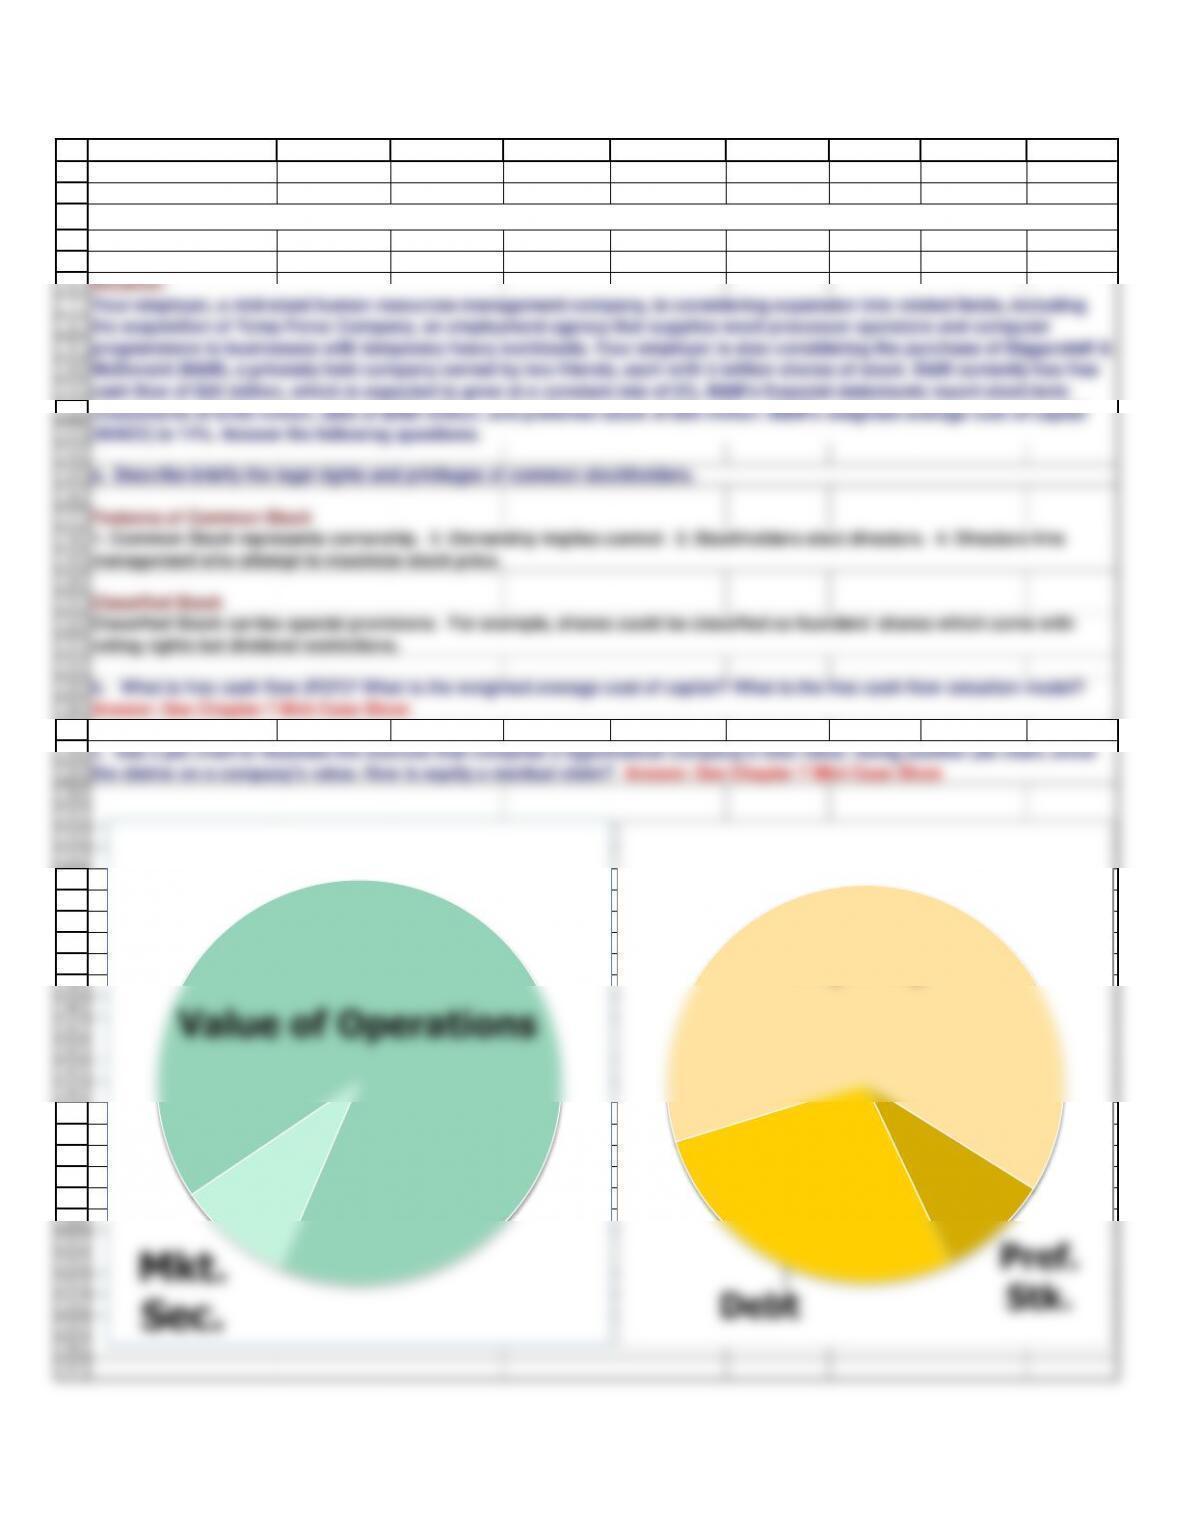
McDonald (B&M), a privately held company owned by two friends, each with 5 million shares of stock. B&M currently has free
cash flow of $24 million, which is expected to grow at a constant rate of 5%. B&M’s financial statements report short-term
investments of $100 million, debt of $200 million, and preferred stock of $50 million. B&M’s weighted average cost of capital
management who attempt to maximize stock price.
Mkt.
Sec.
Value of Operations
Pref.
Stk.
Debt
58
59
60
61
62
63
64
65
67
68
69
70
71
72
If constant growth begins at Time 0:
78
79
80
81
82
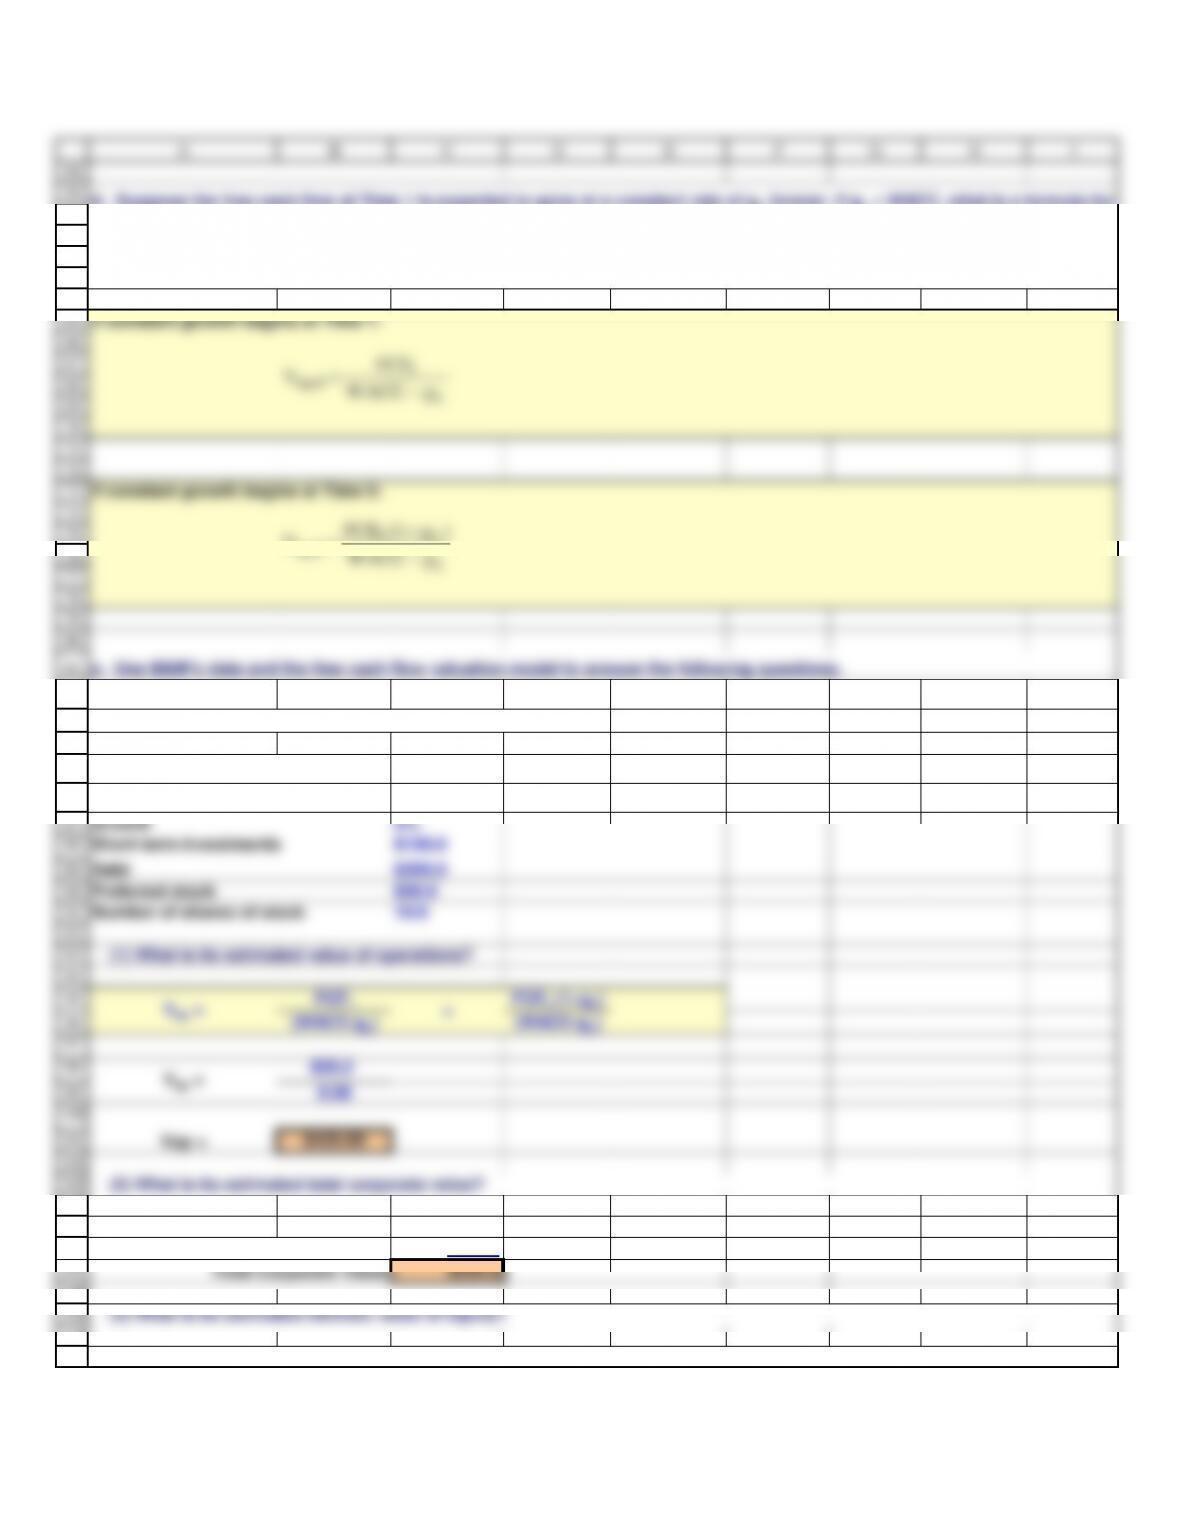
Free cash flow
WACC
Growth
88
89
90
91
92
93
94
95
96
97
98
100
101
102
103
104
105
106
(3) What is its estimated intrinsic value of equity?
111
A B C D E F G H I
If constant growth begins at Time 1:
$100.0
$200.0
$50.0
Number of shares of stock 10.0
(1) What is its estimated value of operations?
FCF1 FCF0 (1+gL)
(WACC-gL) (WACC-gL)
Vop = $420.00
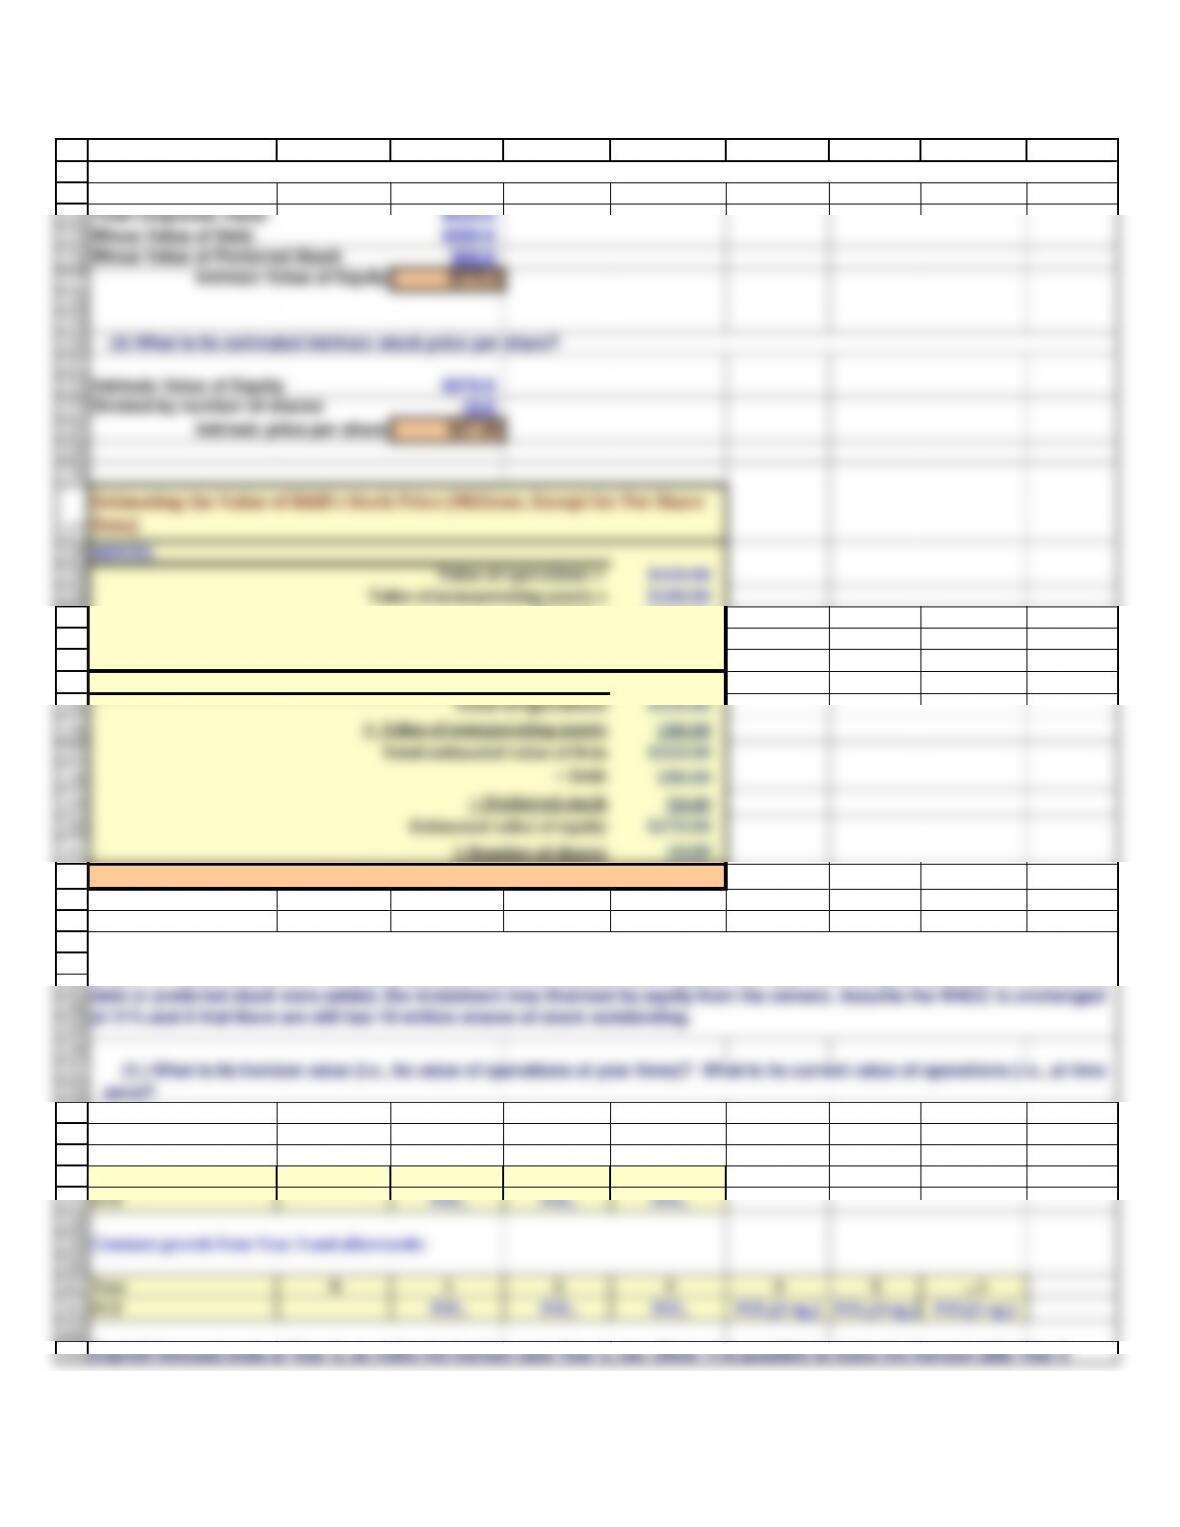
Value of Operation $420.0
Plus Value of Non-operating Assets $100.0
d. Suppose the free cash flow at Time 1 is expected to grow at a constant rate of gL forever. If gL < WACC, what is a formula for
the present value of expected free cash flows when discounted at the WACC? If the most recent free cash flow is expected to
grow at a constant rate of gL forever (and gL < WACC), what is a formula for the present value of expected free cash flows when
discounted at the WACC?
Short-term investments
Debt
e. Use B&M’s data and the free cash flow valuation model to answer the following questions.
Preferred stock
Debt holders have the first claim on corporate value. Preferred stockholders have the next claim and the remaining is left to
=
Vop =
(2) What is its estimated total corporate value?
L
1
0,op gWACC
FCF
V
112
113
114
115
116
117
118
119
120
121
127
128
129
130
138
139
140
141
142
149
150
151
152
153
154
FCF1FCF2FCF3
160
161
162
163
164
A B C D E F G H I
Intrinsic Value of Equity $270.0
Divided by number of shares 10.0
Intrinsic price per share $27.00
Total Corporate Value $520.0
Minus Value of Debt $200.0
Minus Value of Preferred Stock $50.0
Intrinsic Value of Equity $270.0
INPUTS:
Value of operations = $420.00
Value of nonoperating assets = $100.00
− Debt 200.00
− Preferred stock 50.00
Estimated value of equity $270.00
÷ Number of shares 10.00
Estimated stock price per share = $27.00
Explicit forecast:
Year
0 1 2 3 4 5 … t
FCF
FCF1FCF2FCF3FCF3(1+gL) FCF4(1+gL) FCFt(1+gL)
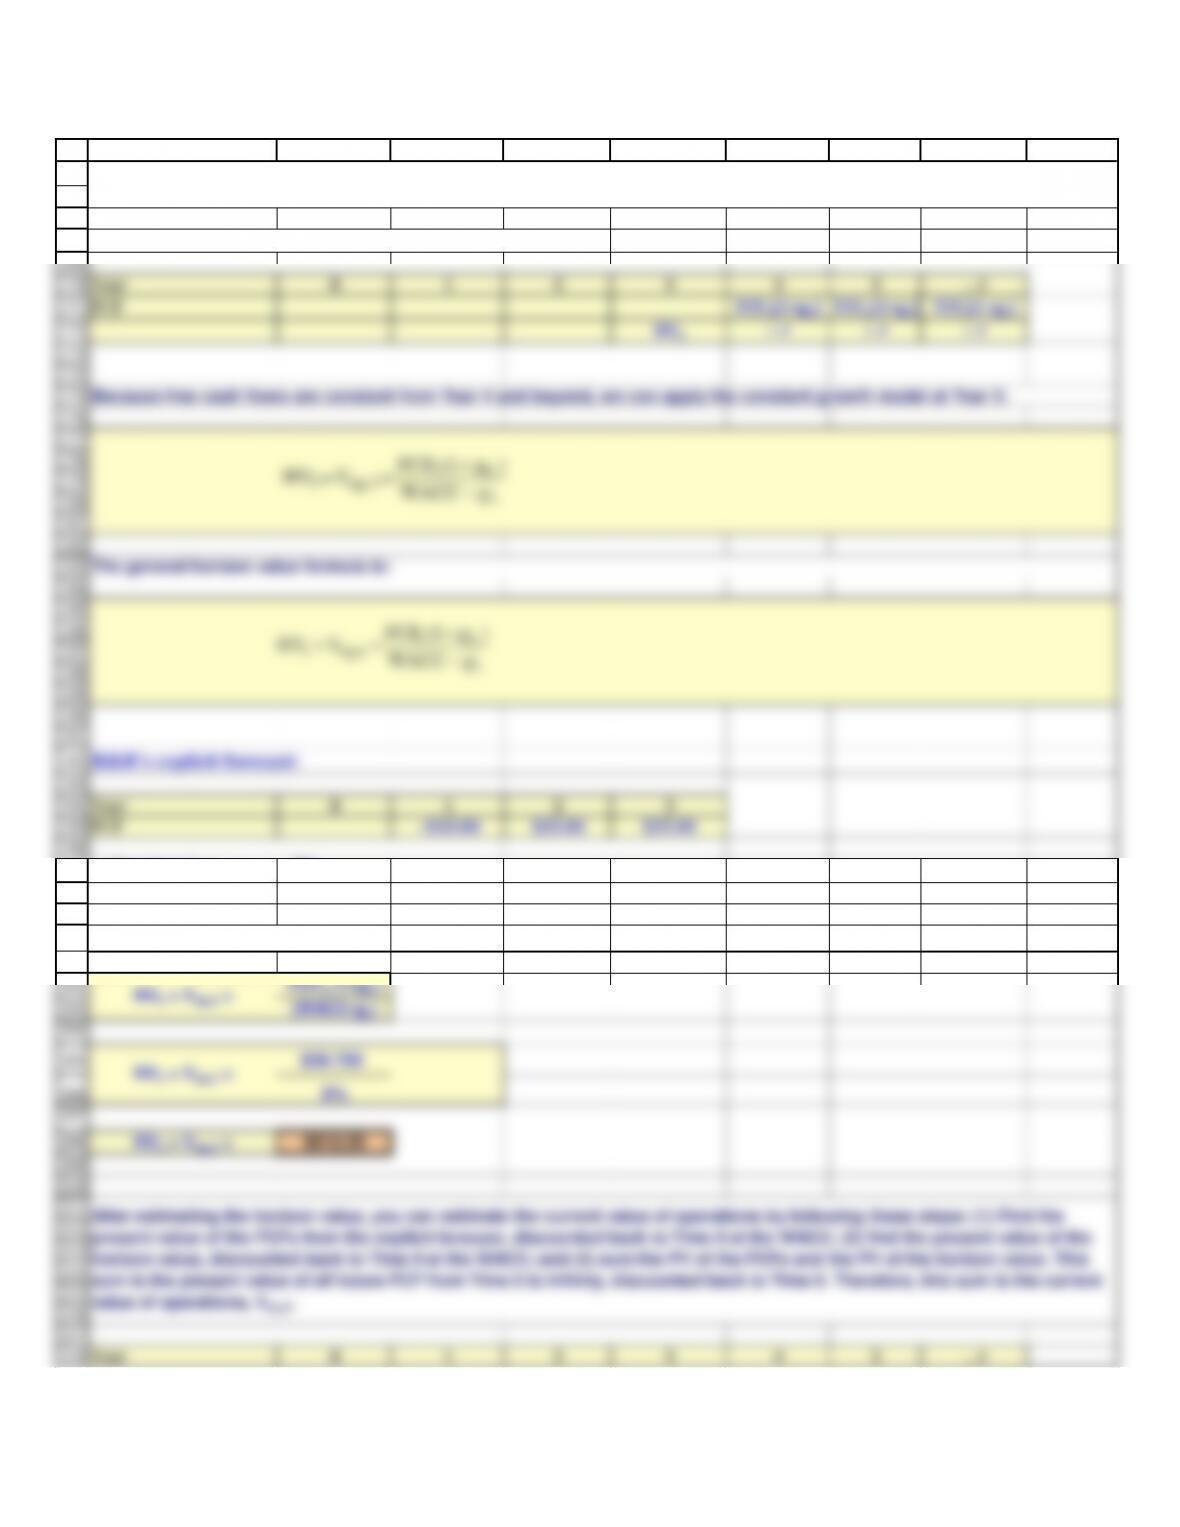
(1.) What is its horizon value (i.e., its value of operations at year three)? What is its current value of operations (i.e., at time
zero)?
common stockholders.
(4) What is its estimated intrinsic stock price per share?
Explicit forecast ends at Year 3, so make the horizon date Year 3, too. (Note: it is possible to make the horizon date Year 2
Estimating the Value of R&R’s Stock Price (Millions, Except for Per Share
Data)
165
166
167
168
169
170
171
172
173
174
175
176
182
183
184
185
186
187
193
194
195
196
197
204
205
206
207
A B C D E F G H I
HV3 = Vop,3 = PV of FCF4 and beyond discounted back to Year 3
Year
0 1 2 3 4 5 … t
FCF
FCF3(1+gL) FCF4(1+gL) FCFt(1+gL)
HV3←↵←↵←↵
Year
0 1 2 3
FCF
−$. $20.00 $35.00
After Year 3, gL = 5%
$36.750
6%
Explicit forecast ends at Year 3, so make the horizon date Year 3, too. (Note: it is possible to make the horizon date Year 2
because FCF3 is known and grows at a constant rate, but it is easy to make mistakes if horizon year is not set equal to end of
explicit forecast.)
Because free cash flows are constant from Year 4 and beyond, we can apply the constant growth model at Year 3:
The general horizon value formula is:
HV3 = Vop,3 =
Lt
t,optgWACC
)g1(FCF
VHV
219
220
221
222
223
224
A B C D E F G H I
FCF
FCF1FCF2FCF3
PV of FCF in explicit forecast ←↵←↵←↵
FCF3(1+gL) FCF4(1+gL) FCFt(1+gL)
HV3←↵←↵←↵
←↵←↵←↵
PV of HV is the PV of FCF beyond the
explicit forecast
268
269
270
271
272
273
274
275
281
282
283
284
285
286
287
288
290
291
292
293
294
295
296
297
304
305
306
307
308
315
316
317
318
319
A B C D E F G H I
INPUTS:
Vop,0 = $480.67
HV3 = $612.50
PV of HV3
=
Vop,0
No Change Actual Forecast
Year 0 1 2 3 4
Inputs
WACC 9.0%
Sales $2,000
NOPAT $99 $107 $112 $117.879
OpCap $1,120 $1,232 $1,331 $1,397.088 #########
FCF −$3. $8.360 $45.738 $48.025
Growth in FCF -164% 447.1% 5.0%
ROIC 8.0% 8.0% 8.0% 8.0%
Percent of value
due to cash flows
beyond Year 3
Percent of value
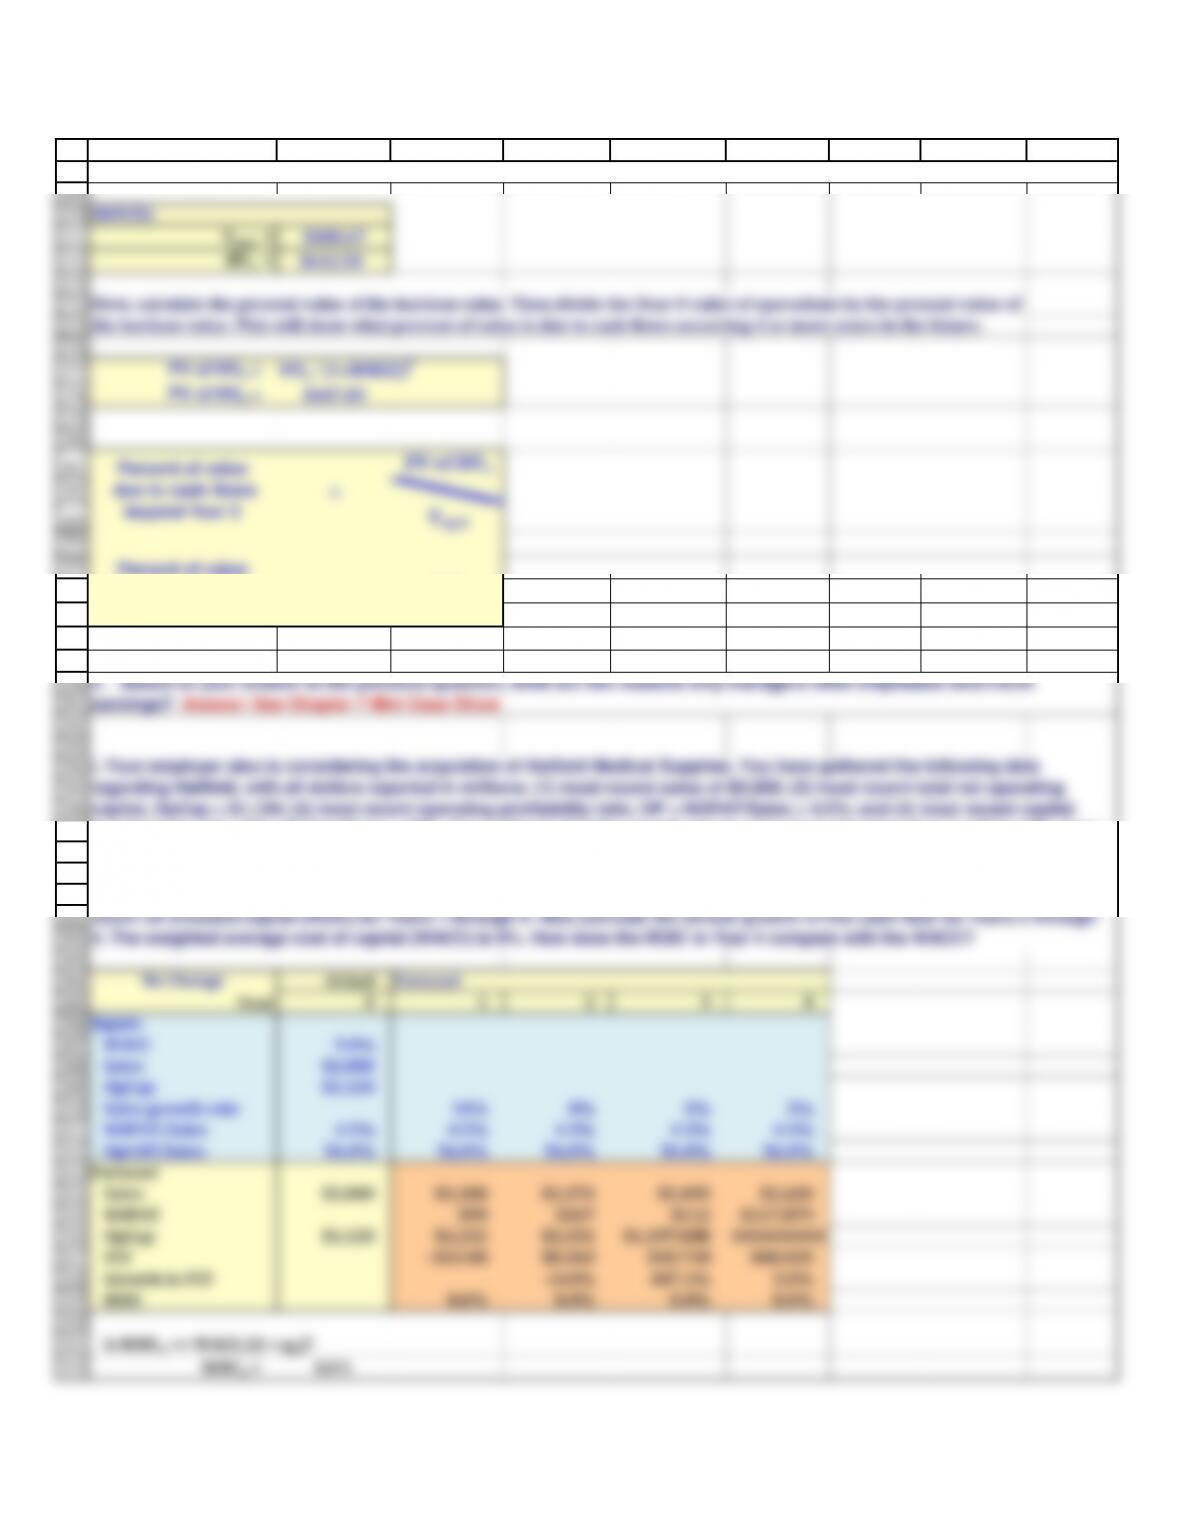
h. Based on your answer to the previous question, what are two reasons why managers often emphasize short-term
earnings? Answer: See Chapter 7 Mini Case Show
First, calculate the present value of the horizon value. Then divide the Year 0 value of operations by the present value of
the horizon value. This will show what percent of value is due to cash flows occurring 4 or more years in the future.
i. Your employer also is considering the acquistion of Hatfield Medical Supplies. You have gathered the following data
regarding Hatfield, with all dollars reported in millions: (1) most recent sales of $2,000; (2) most recent total net operating
capital, OpCap = $1,120; (3) most recent operating profitability ratio, OP = NOPAT/Sales = 4.5%; and (4) most recent capital
requirement ratio, CR = OpCap/Sales = 56%. You estimate that the growth rate in sales from Year 0 to Year 1 will be 10%, from
g. If B&M undertakes the expansion, what percent of B&M’s value of operations at Year 0 is due to cash flows from Years 4
and beyond? Hint: use the horizon value at t = 3 to help answer this question.
323
324
325
326
327
328
329
331
332
333
334
335
336
342
343
344
345
346
347
353
354
355
356
357
358
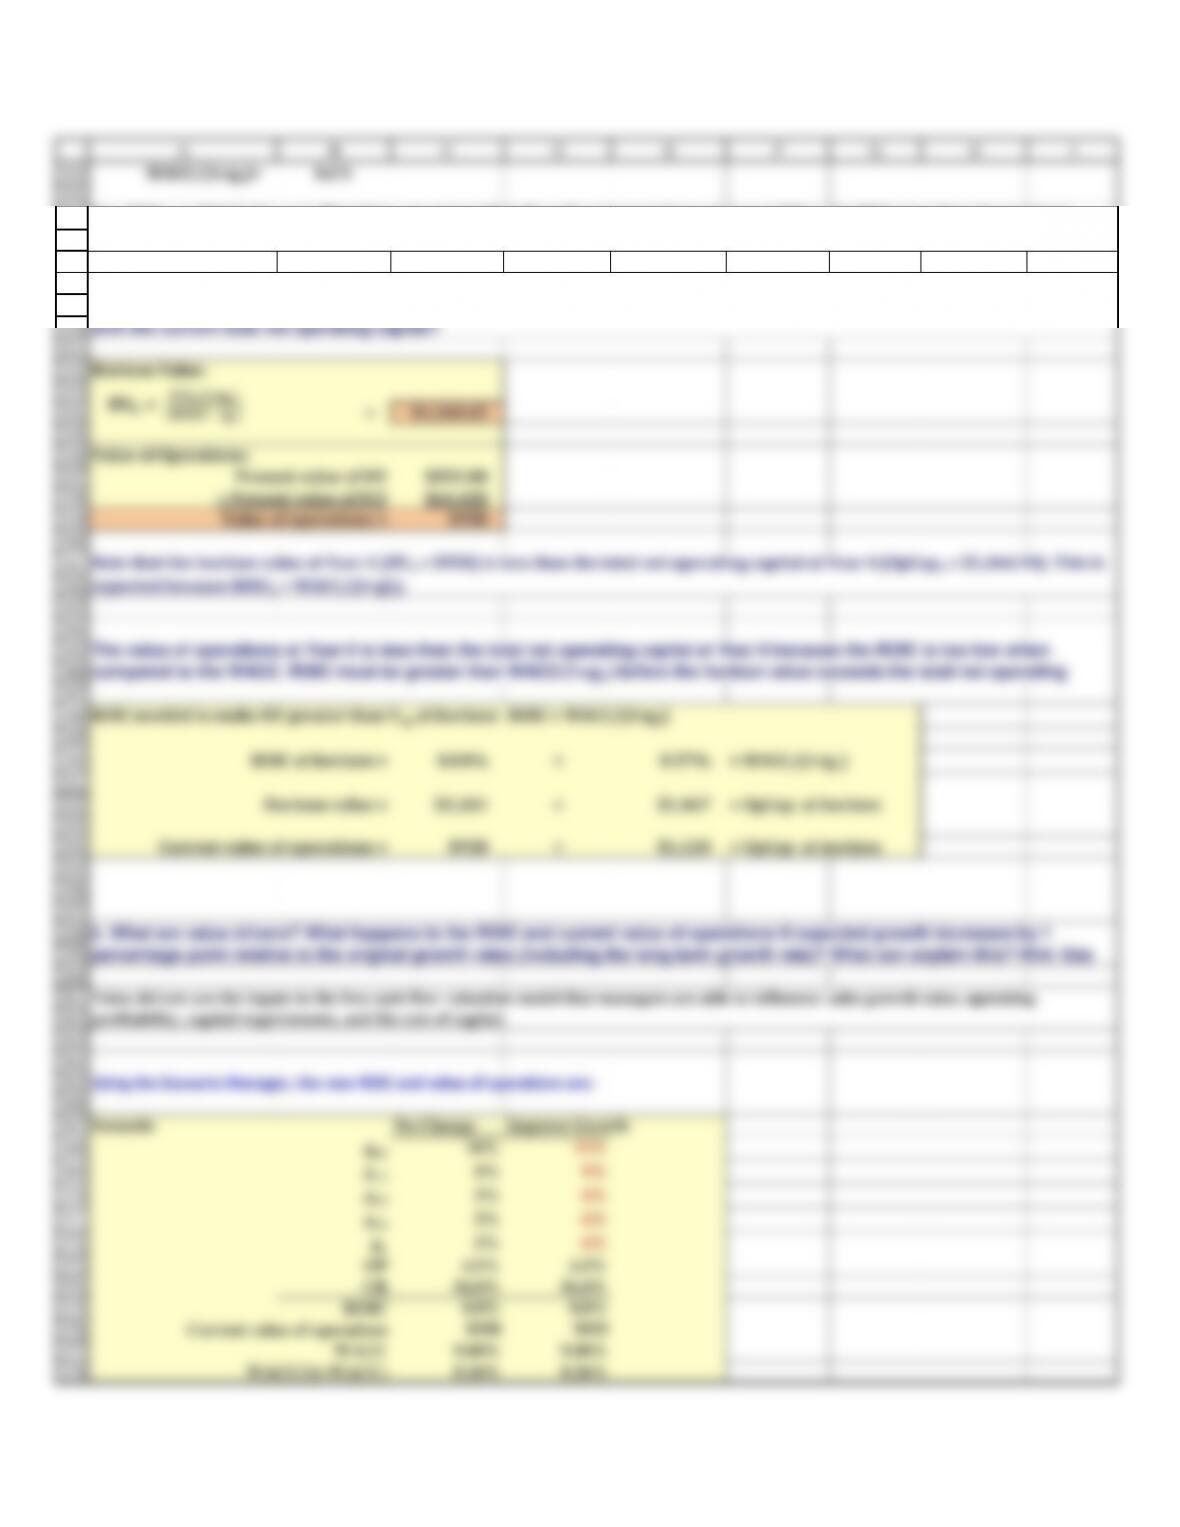
percentage point relative to the original growth rates (including the long-term growth rate)? What can explain this? Hint: Use
364
365
366
367
368
369
g2,3 5% 6%
g3,4 5% 6%
375
376
377
378
A B C D E F G H I
with the current total net operating capital?
WACC/(1+gL)= 8.6%
Horizon Value:
= $1,260.65
Value of Operations:
Current value of operations ≈ $958 < $1,120 = OpCap at horizon
Using the Scenario Manager, the new ROIC and value of operations are:
Scenario No Change Improve Growth
g0,1 10% 11%
g1,2 8% 9%
ROIC
8.0% 8.0%
Current value of operations
$958 $933
WACC
9.00% 9.00%
WACC/(1+WACC)
8.26% 8.26%
Yes, ROIC4 =< WACC/(1 + gL). Therefore, we expect that the value of operations at Year 4 (HV4) should be less than the total net
operating capital at Year 4 (OpCap4).
expected because ROIC4 < WACC/(1+gL).
k. What are value drivers? What happens to the ROIC and current value of operations if expected growth increases by 1
j. What is the horizon value at Year 4? What is the value of operations at Year 0? How does the value of operations compare
The value of operations at Year 0 is less than the total net operating capital at Year 0 because the ROIC is too low when
compared to the WACC. ROIC must be greater than WACC/(1+gL) before the horizon value exceeds the total net operating
�=���+��
��� − ��
379
380
381
382
383
384
385
387
388
389
390
391
g0,1 10% 10%
g1,2 8% 8%
g2,3 5% 5%
g3,4 5% 5%
398
399
400
401
402
9.00% 9.00%
8.26% 8.26%
Using the Scenario Manager and improving capital requirements, the new ROIC and value of operations are:
409
410
g1,2 8% 8%
412
413
gL5% 5%
8.0% 8.8%
$958 $1,191
9.00% 9.00%
420
421
422
423
g0,1 10% 10%
g1,2 8% 8%
g2,3 5% 5%
g3,4 5% 5%
gL5% 5%
430
431
432
433
A B C D E F G H I
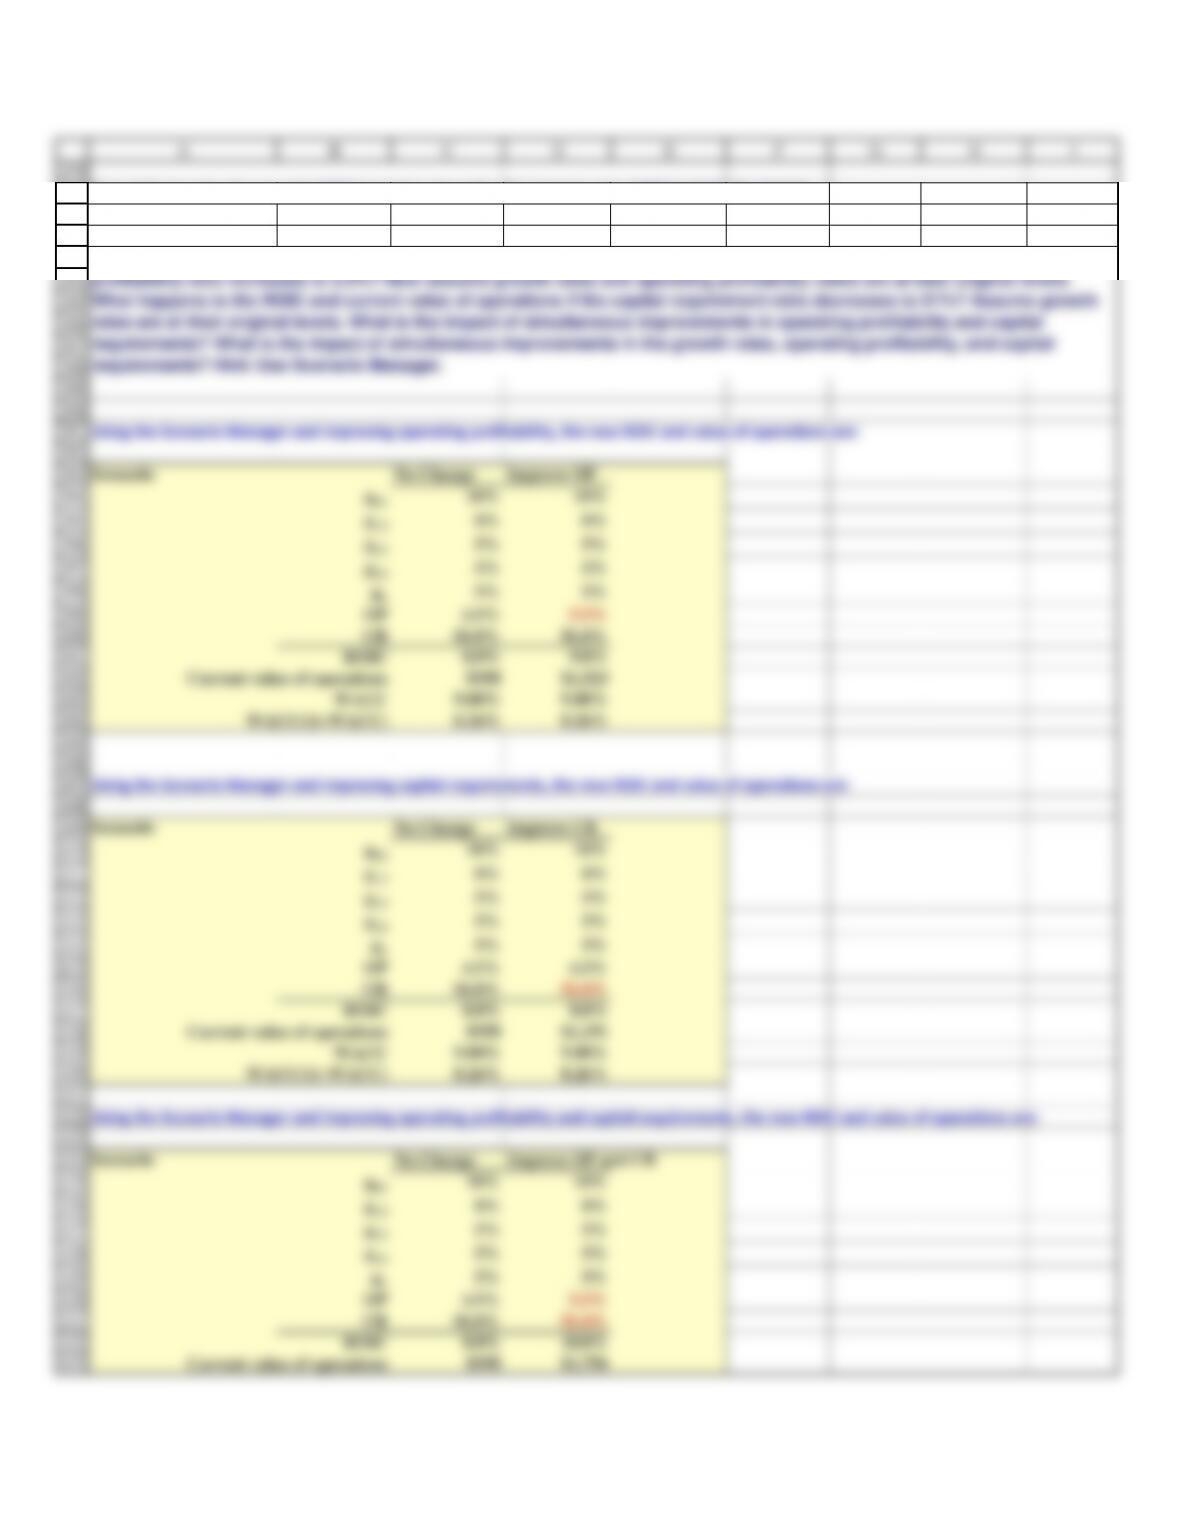
Growth hurts value because the ROIC is too low. Growth will only help value if ROIC>WACC/(1+WACC).
Using the Scenario Manager and improving operating profitability, the new ROIC and value of operations are:
gL5% 5%
OP 4.5% 5.5%
CR 56.0% 56.0%
ROIC
8.0% 9.8%
Current value of operations
$958 $1,523
Scenario No Change Improve CR
g0,1 10% 10%
g2,3 5% 5%
g3,4 5% 5%
WACC/(1+WACC)
8.26% 8.26%
Using the Scenario Manager and improving operating profitability and capital requirements, the new ROIC and value of operations are:
OP 4.5% 5.5%
CR 56.0% 51.0%
ROIC
8.0% 10.8%
Current value of operations
$958 $1,756
l. Assume growth rates are at their original levels. What happens to the ROIC and current value of operations if the operating
profitability ratio increases to 5.5%? Now assume growth rates and operating profitability ratios are at their original levels.
What happens to the ROIC and current value of operations if the capital requirement ratio decreases to 51%? Assume growth
requirements? What is the impact of simultaneous improvements in the growth rates, operating profitability, and capital
requirements? Hint: Use Scenario Manager.
434
435
436
437
438
439
440
442
443
444
445
446
9.00% 9.00%
8.26% 8.26%
453
454
455
464
465
466
467
468
475
476
477
478
479
486
487
488
489
A B C D E F G H I
g0,1 10% 11%
WACC
9.00% 9.00%
WACC/(1+WACC)
8.26% 8.26%
Using the Scenario Manager and improving growth rates, operating profitability, and capital requirements, the new ROIC and value of operations are
Scenario No Change Improve All
g1,2 8% 9%
g2,3 5% 6%
g3,4 5% 6%
gL5% 6%
OP 4.5% 5.5%
D1D2DN
( 1 + rs ) ( 1 + rs ) 2 ( 1 + rs ) N
+
+
. . . .
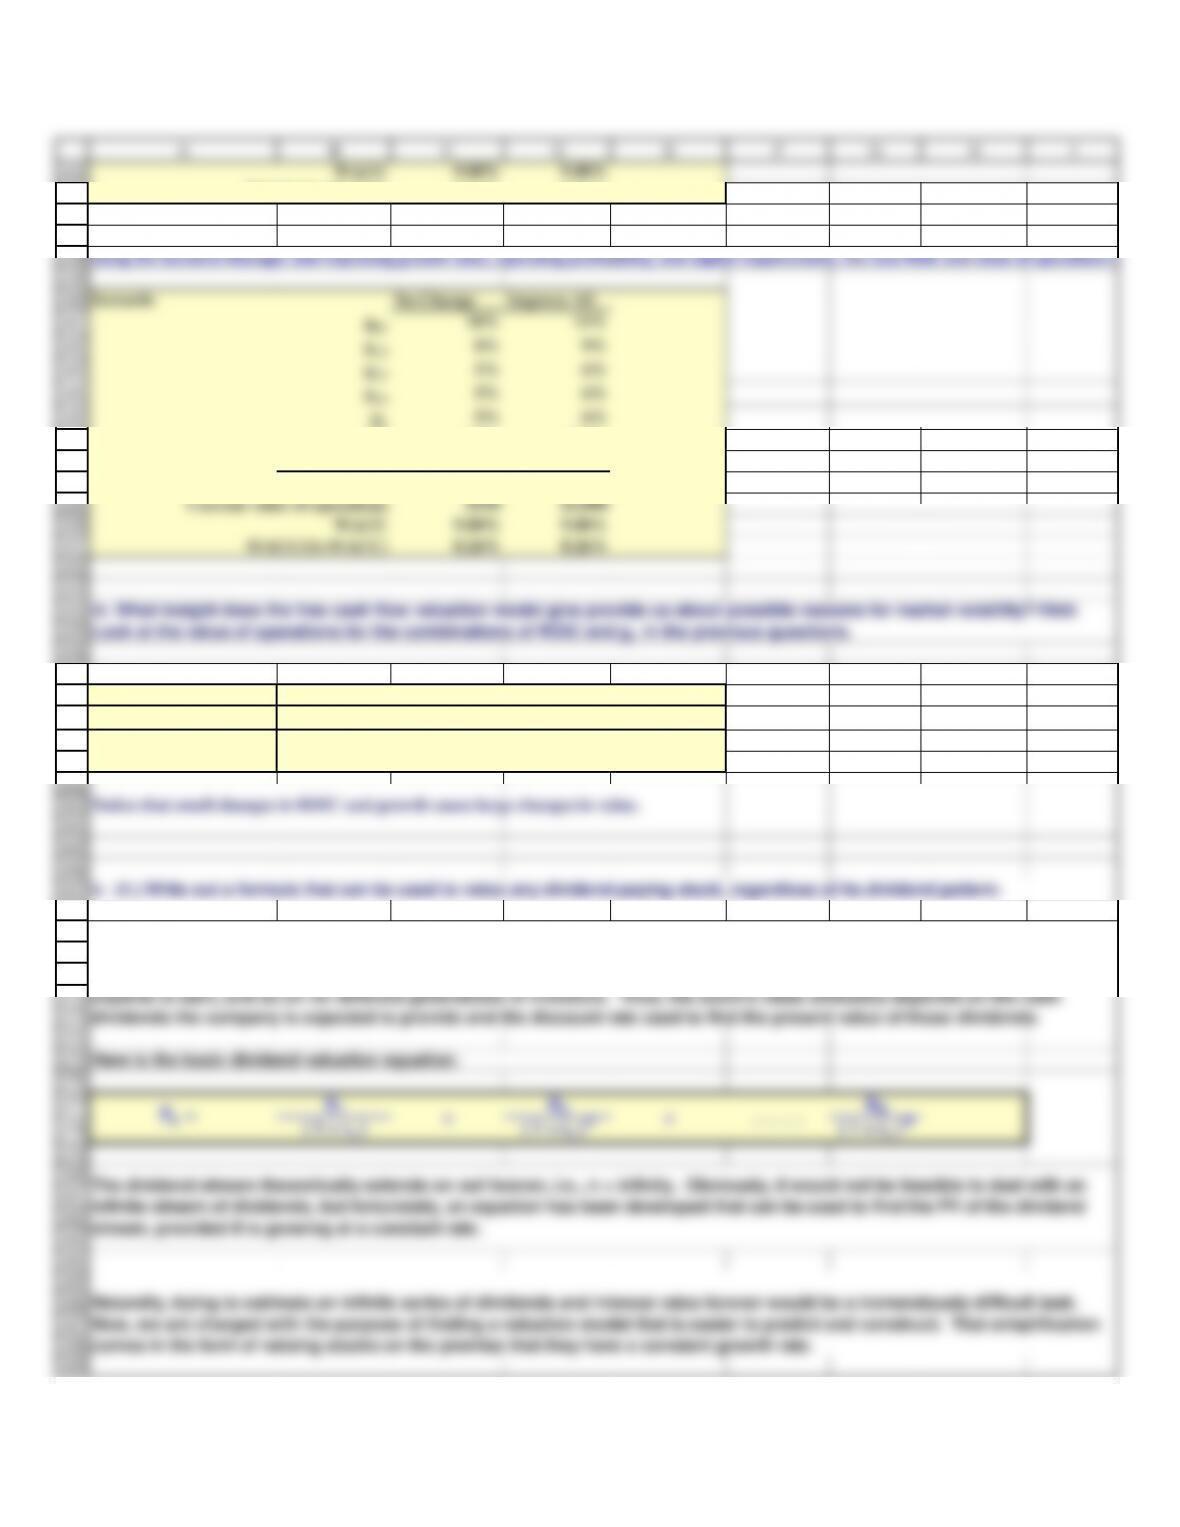
m. What insight does the free cash flow valuation model give provide us about possible reasons for market volatility? Hint:
Look at the value of operations for the combinations of ROIC and gL in the previous questions.
n. (1.) Write out a formula that can be used to value any dividend-paying stock, regardless of its dividend pattern.
Naturally, trying to estimate an infinite series of dividends and interest rates forever would be a tremendously difficult task.
Now, we are charged with the purpose of finding a valuation model that is easier to predict and construct. That simplification
comes in the form of valuing stocks on the premise that they have a constant growth rate.
Here is the basic dividend valuation equation:
�=
490
491
492
493
494
495
496
497
498
499
500
501
502
503
504
505
A B C D E F G H I
D1
( rs – gL )
In this equation, the long-run growth rate (g) can be approximated by multiplying the firm’s return on assets by the retention
ratio. Generally speaking, the long-run growth rate of a firm is likely to fall between 5% and 8% a year.
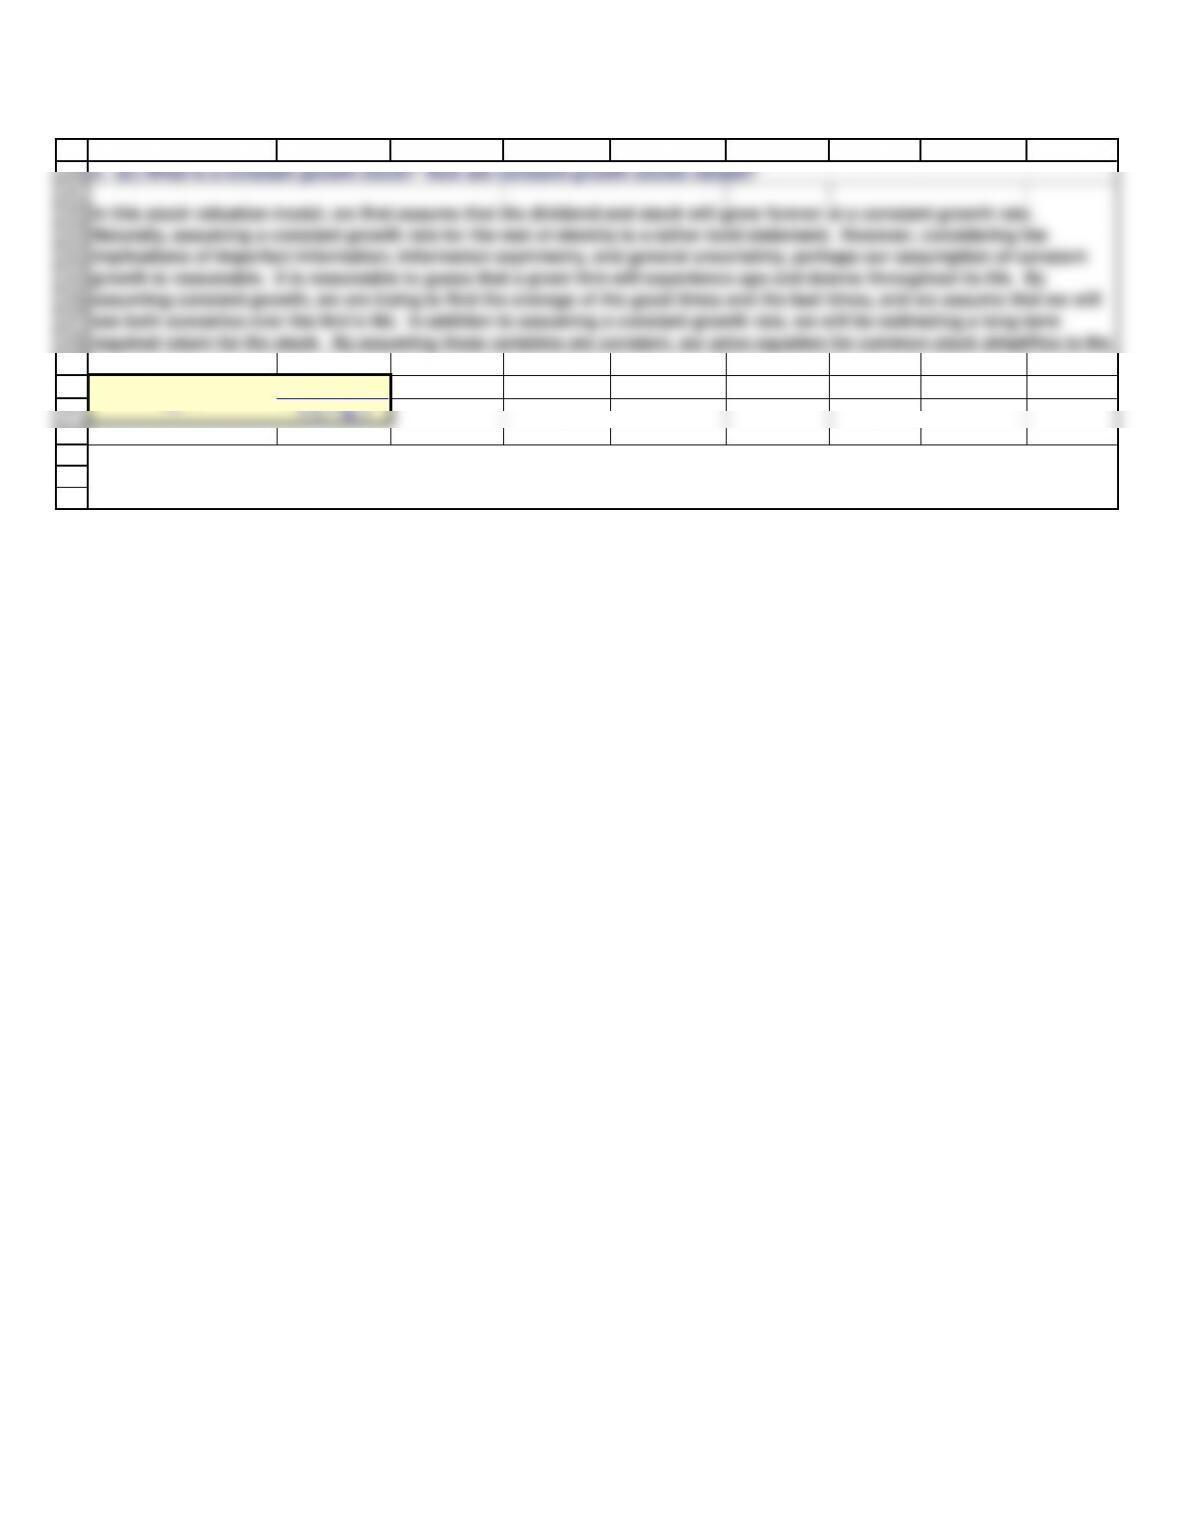
In this stock valuation model, we first assume that the dividend and stock will grow forever at a constant growth rate.
Naturally, assuming a constant growth rate for the rest of eternity is a rather bold statement. However, considering the
implications of imperfect information, information asymmetry, and general uncertainty, perhaps our assumption of constant
growth is reasonable. It is reasonable to guess that a given firm will experience ups and downs throughout its life. By
assuming constant growth, we are trying to find the average of the good times and the bad times, and we assume that we will
see both scenarios over the firm’s life. In addition to assuming a constant growth rate, we will be estimating a long-term
required return for the stock. By assuming these variables are constant, our price equation for common stock simplifies to the
n. (2.) What is a constant growth stock? How are constant growth stocks valued?
�=