
p. Jordan Jones (JJ) and Casey Carter (CC) are portfolio managers at your firm.
Each manages a well-diversified portfolio. Your boss has asked for your opinion
regarding their performance in the past year. JJ’s portfolio has a beta of 0.6 and
had a return of 8.5%; CC’s portfolio has a beta of 1.4 and had a return of 9.5%.
Which manager had better performance? Why?

r. What is the Efficient Markets Hypothesis (EMH) and what are its three forms?
What evidence supports the EMH? What evidence casts doubt on the EMH?
Answer: The EMH is the hypothesis that securities are normally in equilibrium, and are
“priced fairly,” making it impossible to “beat the market.”
Weak-form efficiency says that investors cannot profit from looking at past
analysts can still obtain and process new information fast enough to gain a small
advantage.
Strong-form efficiency says that all information, even inside information, is
embedded in stock prices. This form does not hold—insiders know more, and could
take advantage of that information to make abnormal profits in the markets. Trading
vast majority of portfolio managers do not consistently have returns in excess of
CAPM predictions. There are two possible exceptions that earn excess returns: (1)
small companies and (2) companies with high book-to-market ratios.
In addition, there are times when a market becomes overvalued. This is often
called a bubble. Bubbles are hard to burst because trading strategies expose traders to
or in part.
2. Because of a relative scarcity of such stocks and the beneficial net effect on portfolios
that include it, its “risk premium” is likely to be very low or even negative.
Theoretically, it should be negative.
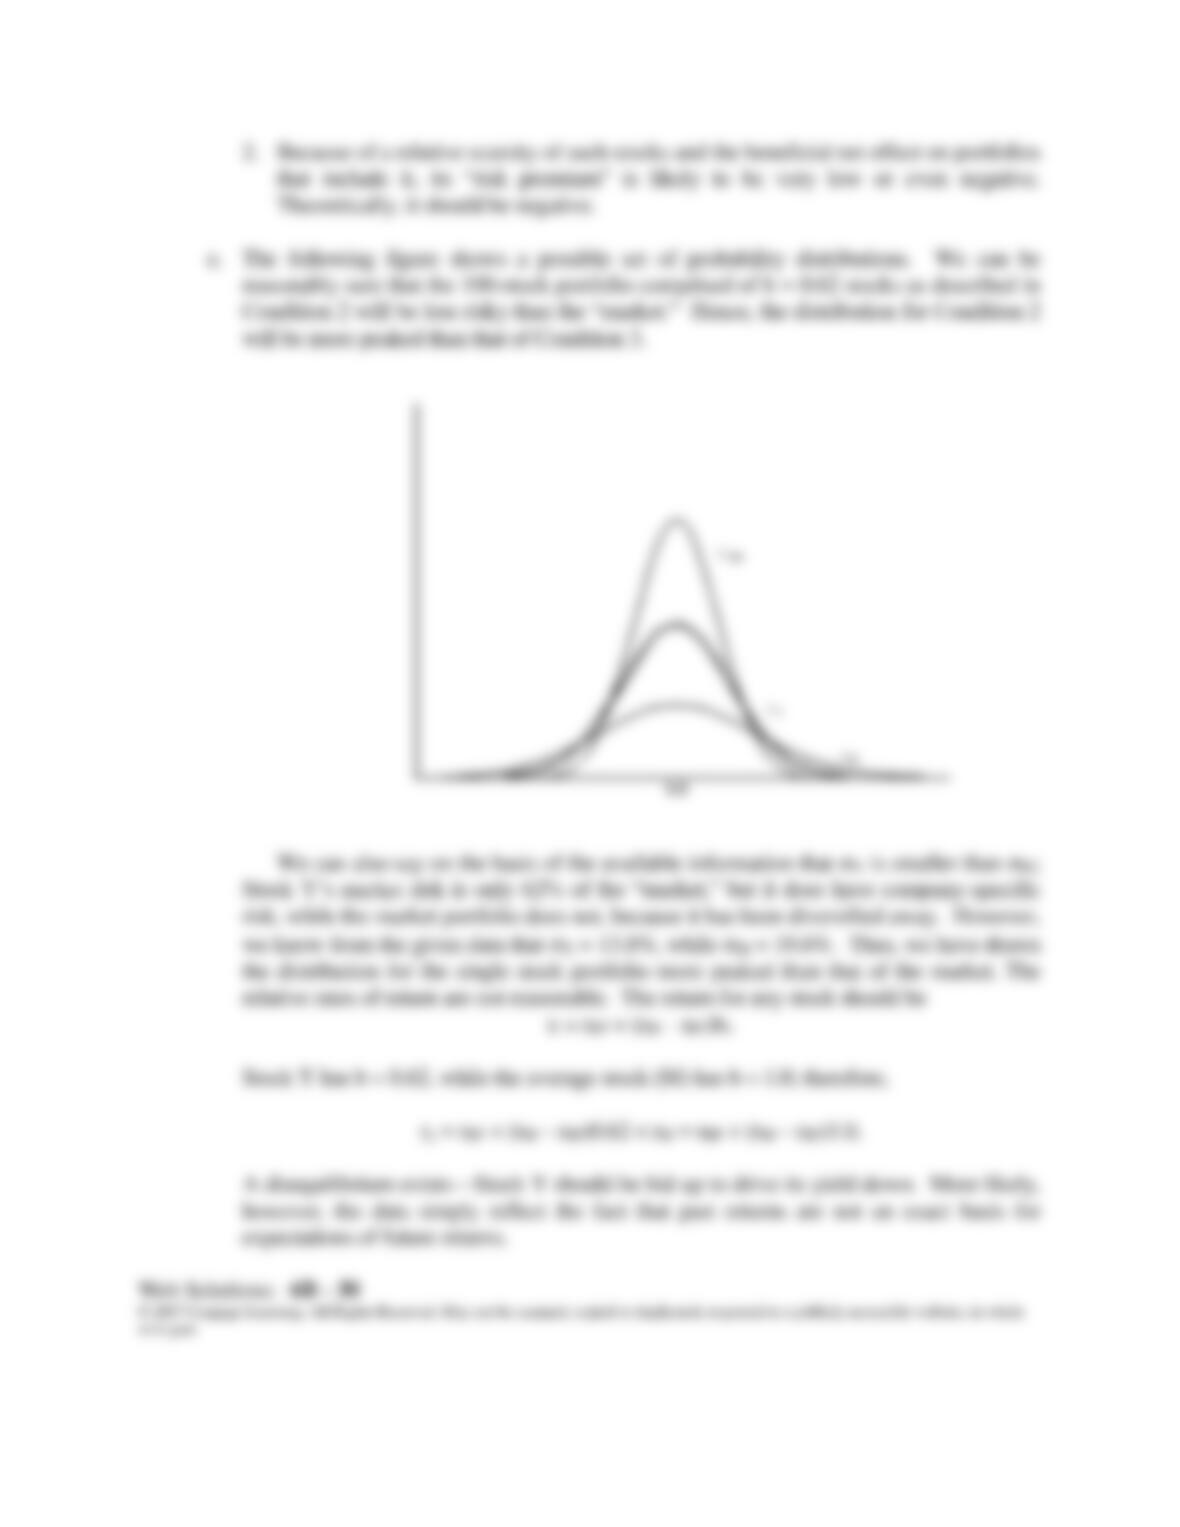
e. The following figure shows a possible set of probability distributions. We can be
reasonably sure that the 100-stock portfolio comprised of b = 0.62 stocks as described in
We can also say on the basis of the available information that Y is smaller than M;
Stock Y’s market risk is only 62% of the “market,” but it does have company–specific
risk, while the market portfolio does not, because it has been diversified away. However,
we know from the given data that Y = 13.8%, while M = 19.6%. Thus, we have drawn
the distribution for the single stock portfolio more peaked than that of the market. The
expectations of future returns.
Web Solutions: 6B – 32
© 2017 Cengage Learning. All Rights Reserved. May not be scanned, copied or duplicated, or posted to a publicly accessible website, in whole
or in part.
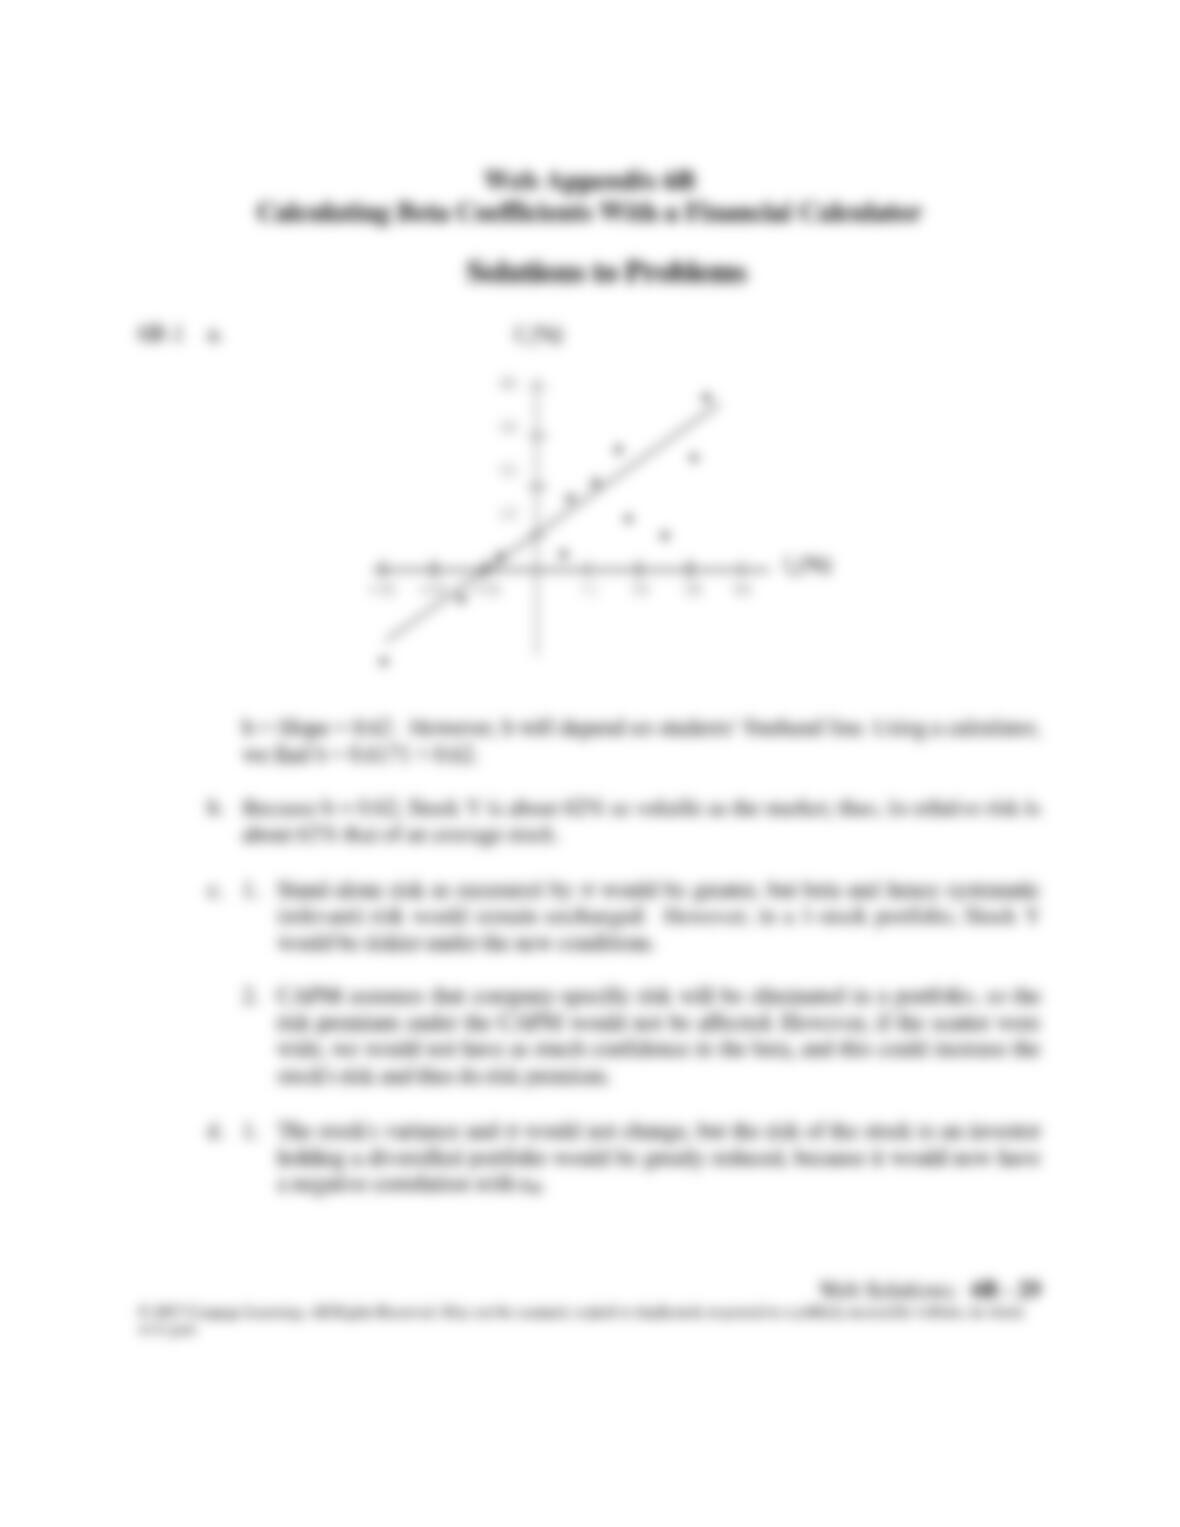
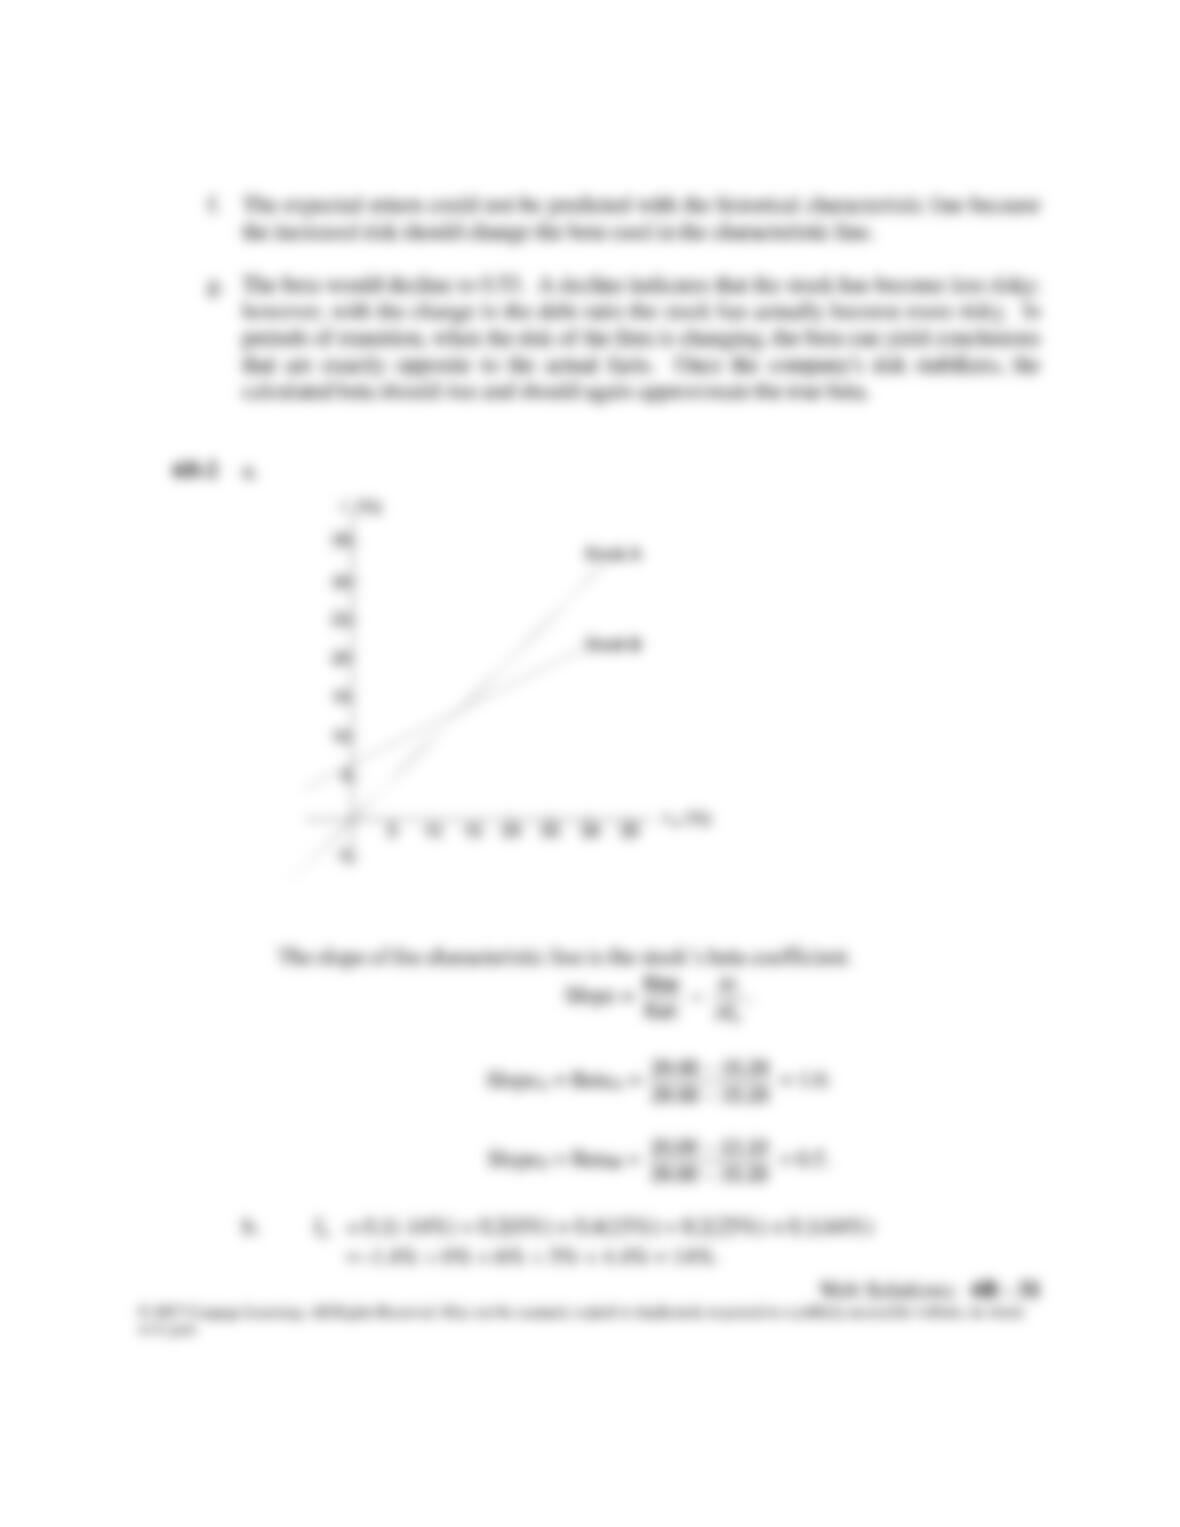
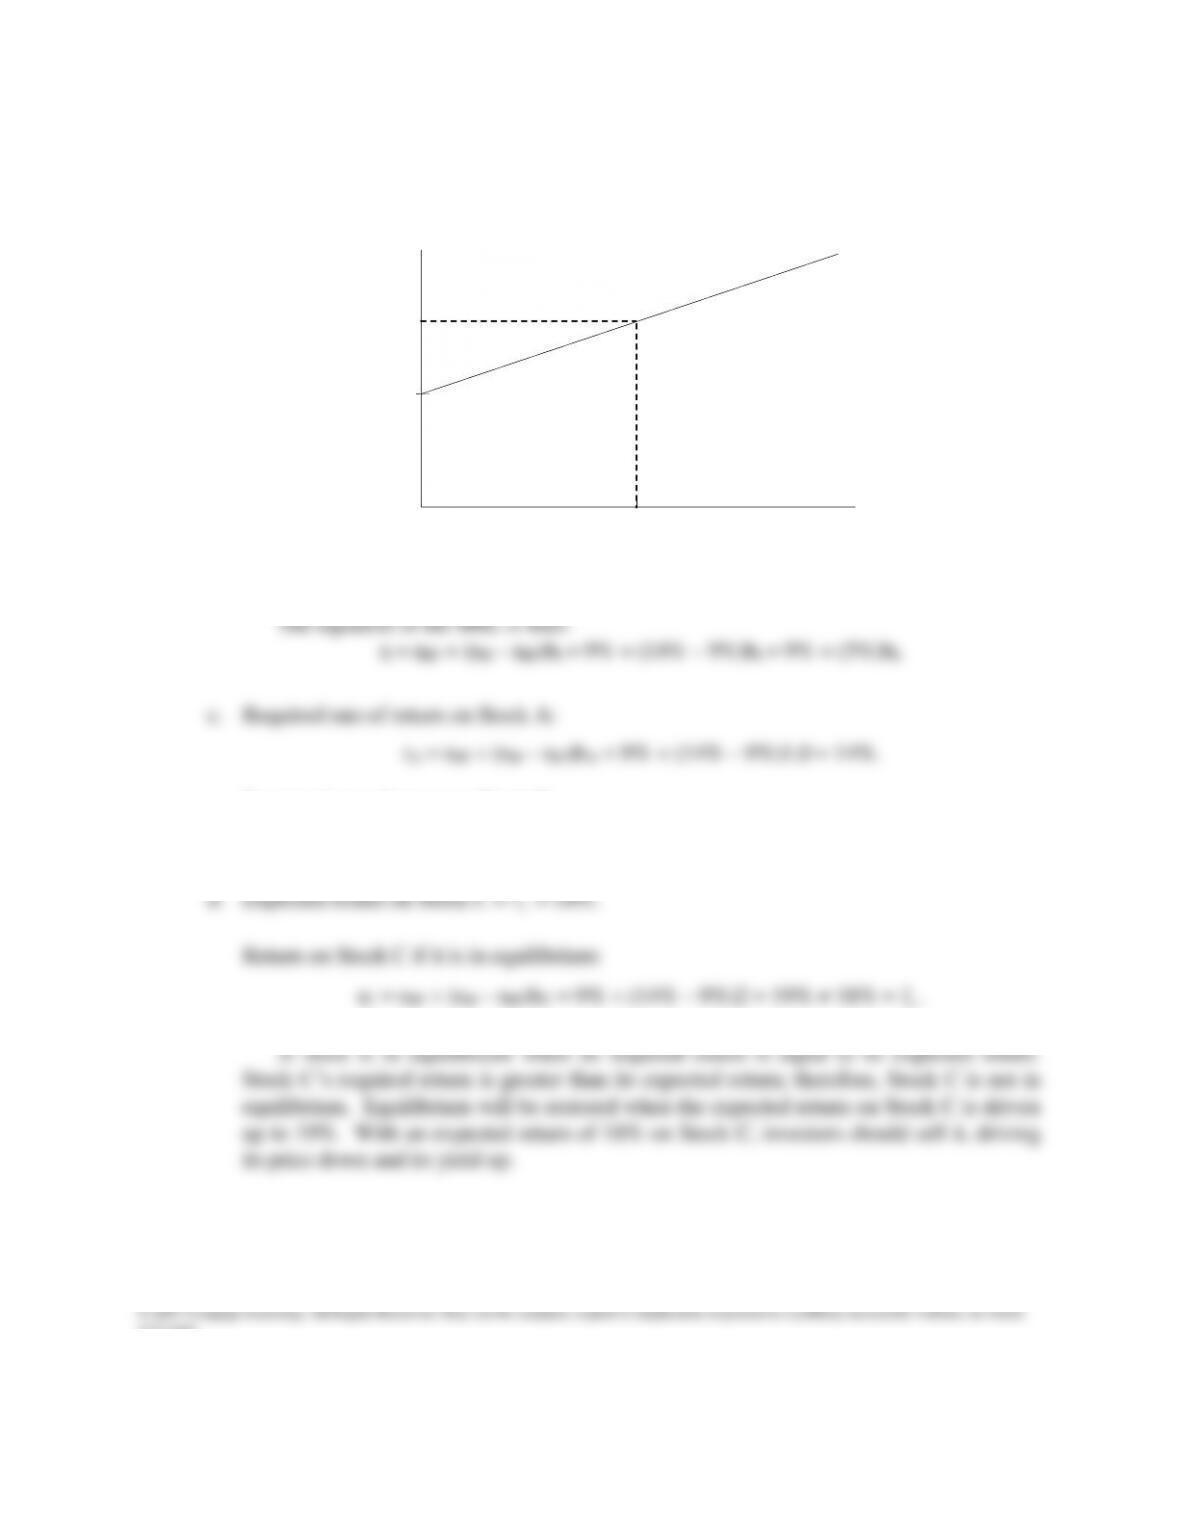
The graph of the SML is as follows:
Required rate of return on Stock B:
rB = 9% + (14% – 9%)0.5 = 11.50%.
d. Expected return on Stock C =
C
r
ˆ
= 18%.
Return on Stock C if it is in equilibrium:
rC = rRF + (rM – rRF)bC = 9% + (14% – 9%)2 = 19% 18% =
C
r
ˆ
.
SML
ri
rRF = 9%
E(r M) = 14%
b
1.0
SML
ri
rRF = 9%
E(r M) = 14%
b
1.0
SML
ri
rRF = 9%
E(r M) = 14%E(r M) = 14%
b
1.0