Mini Case: 6 – 21
or in part.
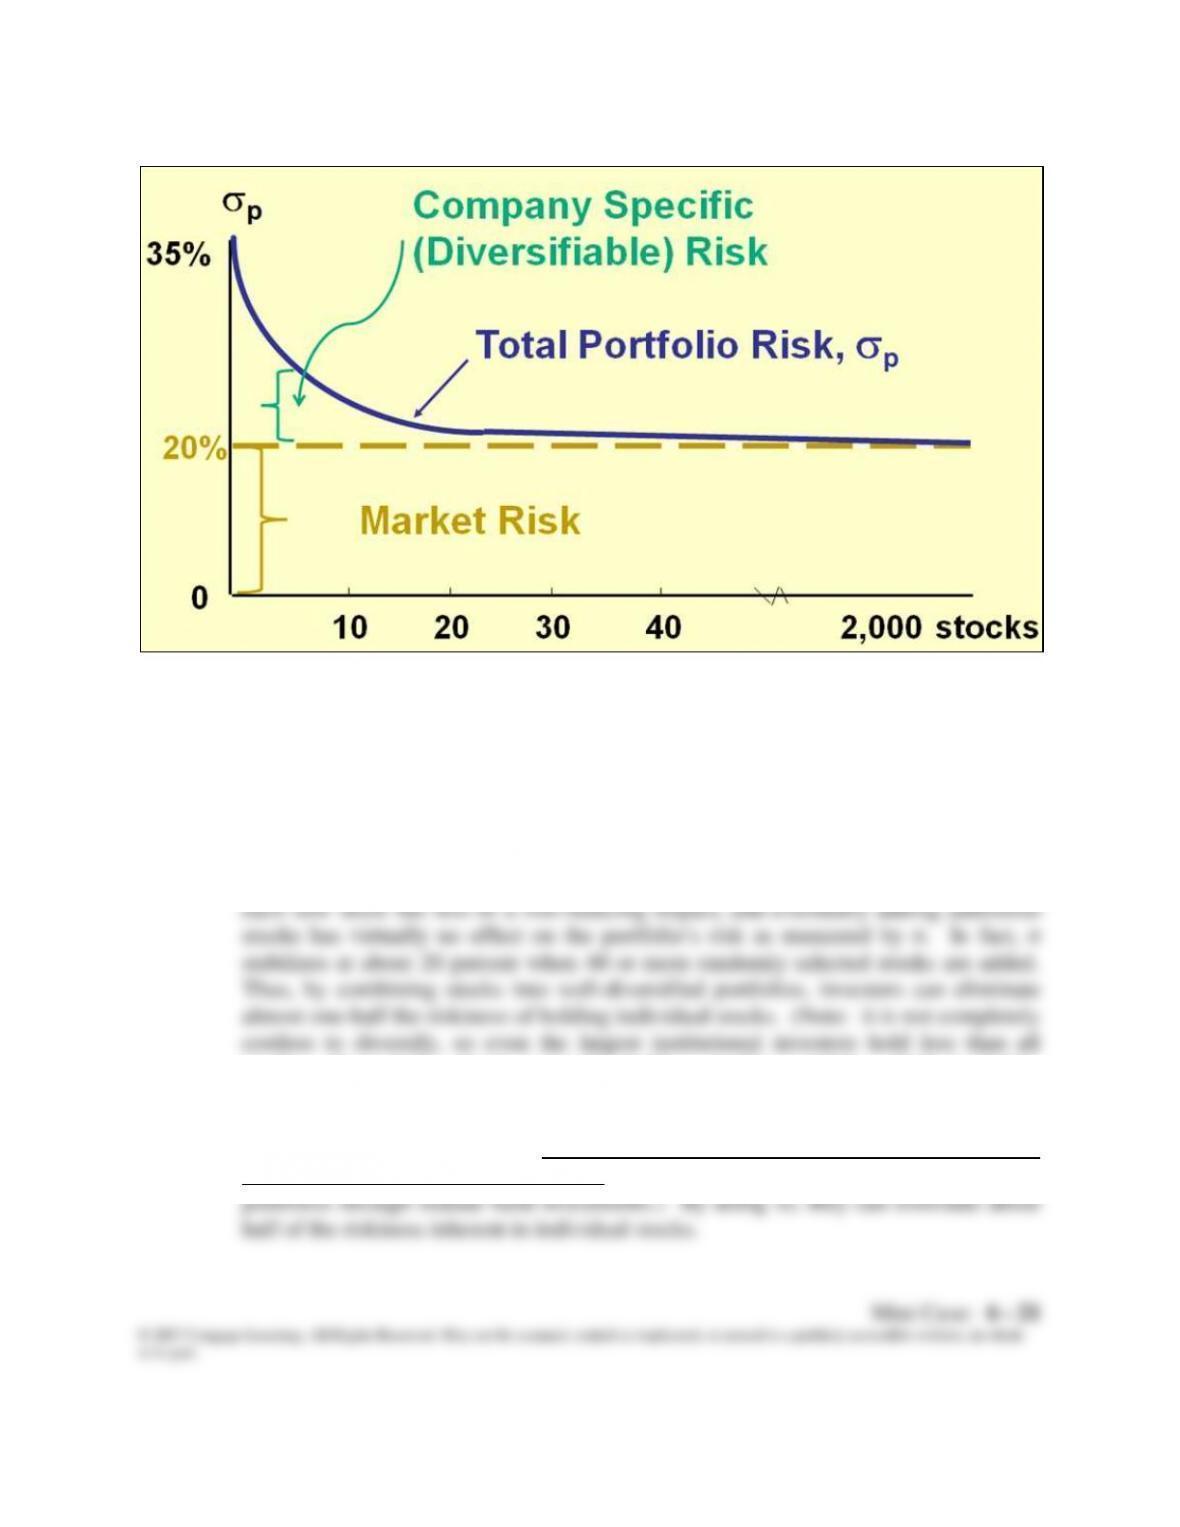
In the real world, stocks are positively correlated with one another—if the
economy does well, so do stocks in general, and vice versa. Correlation coefficients
between stocks generally range from +0.5 to +0.7. The average correlation between
stocks is about 0.35. A single stock selected at random would on average have a
standard deviation of about 35 percent. As additional stocks are added to the
portfolio, the portfolio’s standard deviation decreases because the added stocks are
not perfectly positively correlated. However, as more and more stocks are added,
stocks. Even index funds generally hold a smaller portfolio which is highly
correlated with an index such as the S&P 500 rather than hold all the stocks in the
index.)
The implication is clear: investors should hold well-diversified portfolios of
stocks rather than individual stocks. (In fact, individuals can hold diversified
i. 1. Should portfolio effects influence how investors think about the risk of
individual stocks?
risk that remains is called market risk because it is present even when the entire
market portfolio is held.
i. 2. If you decided to hold a one-stock portfolio and consequently were exposed to
more risk than diversified investors, could you expect to be compensated for all
of your risk; that is, could you earn a risk premium on that part of your risk
that you could have eliminated by diversifying?
j. According to the Capital Asset Pricing Model, what measures the amount of risk
that an individual stock contributes to a well-diversified portfolio? Define this
measurement.
bi =
iM
M
i
A stock’s beta can also be estimated by running a regression with the stock’s
returns on the y axis and the market portfolio’s returns on the x axis. The slope of the
regression line gives the same result as the formula shown above.
k. What is the Security Market Line (SML)? How is beta related to a stock’s
required rate of return?
l. Calculate the correlation coefficient between Blandy and the market. Use this
and the previously calculated (or given) standard deviations of Blandy and the
market to estimate Blandy’s beta. Does Blandy contribute more or less risk to a
well-diversified portfolio than does the average stock? Use the SML to estimate
Blandy’s required return.
252.0
i
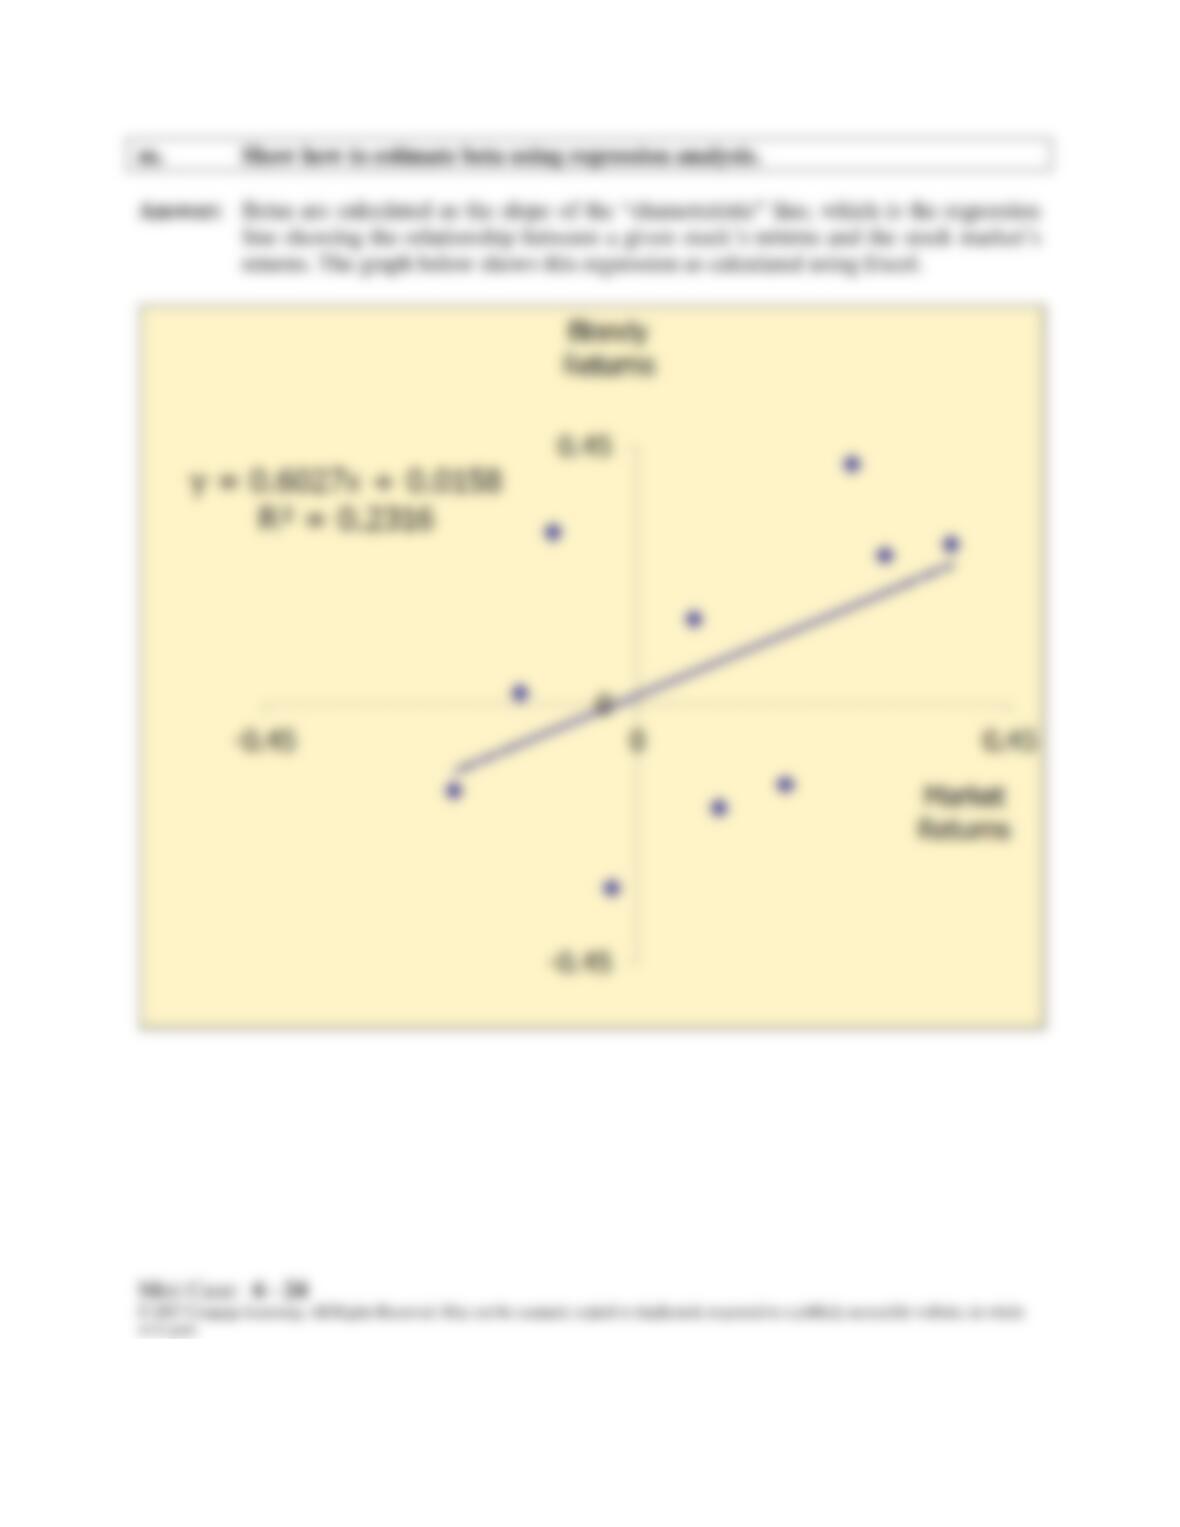
m. Show how to estimate beta using regression analysis.
Answer: Betas are calculated as the slope of the “characteristic” line, which is the regression
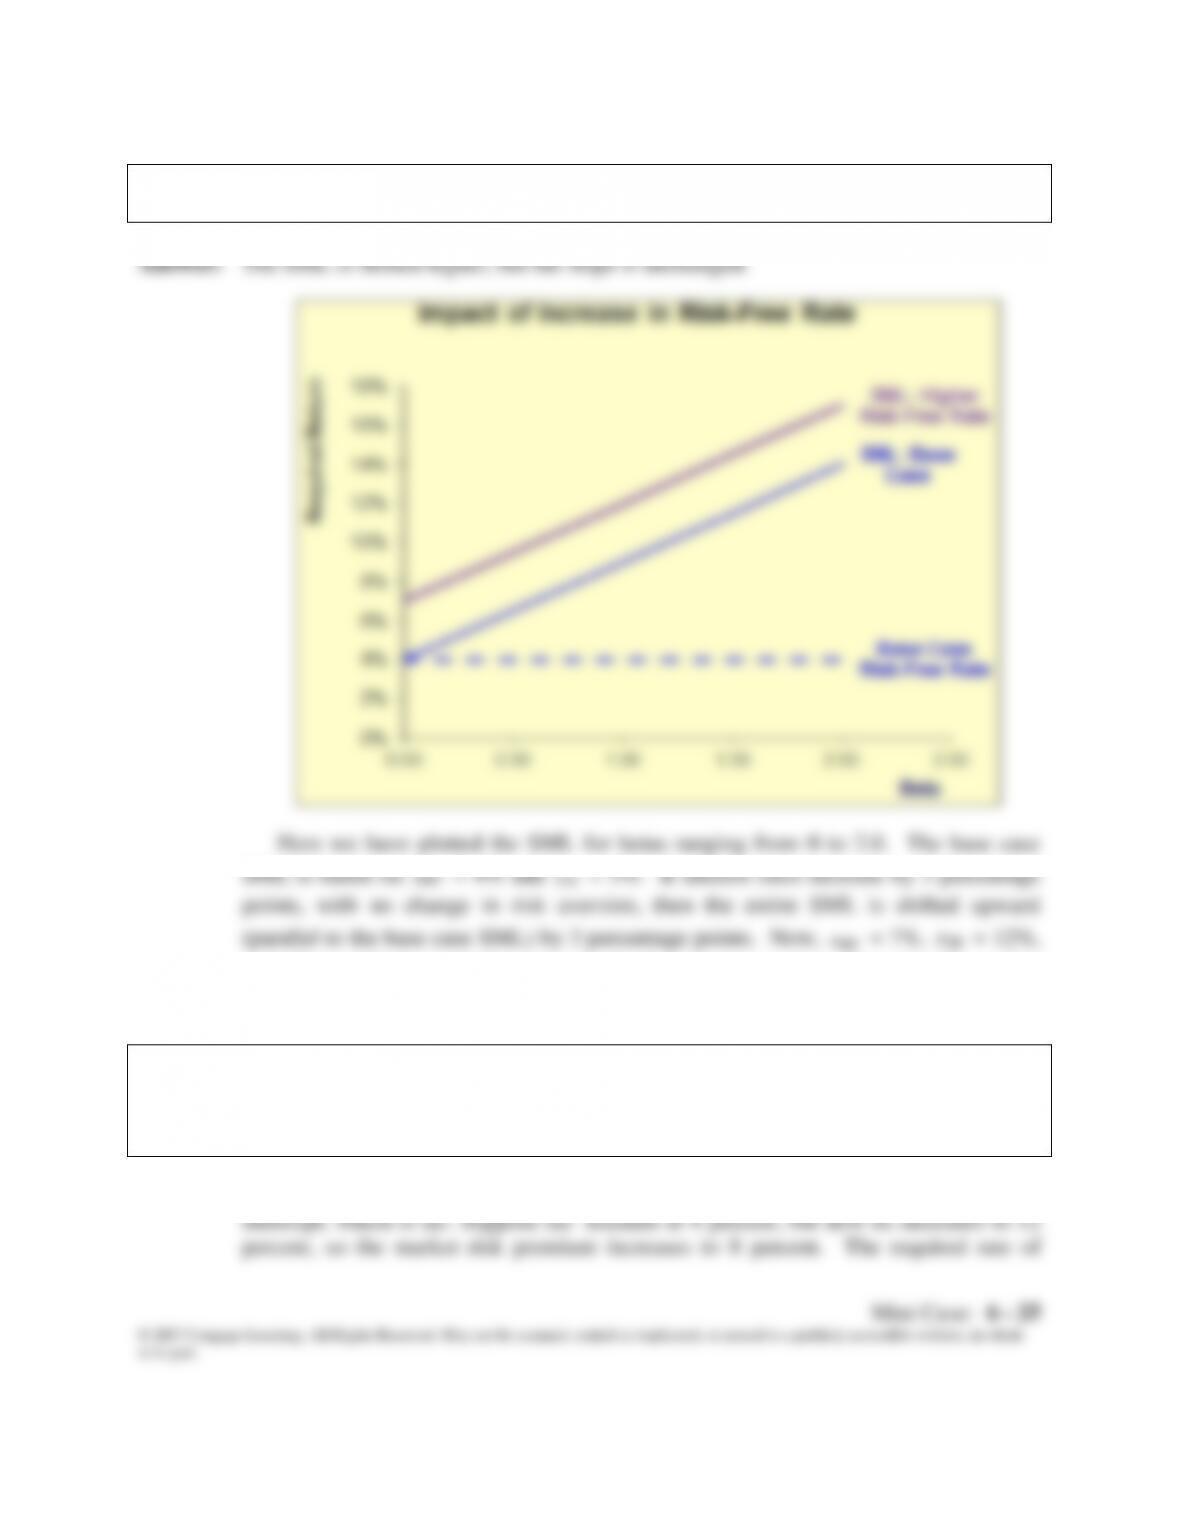
n. 1. Suppose the risk-free rate goes up to 7%. What effect would higher interest rates have
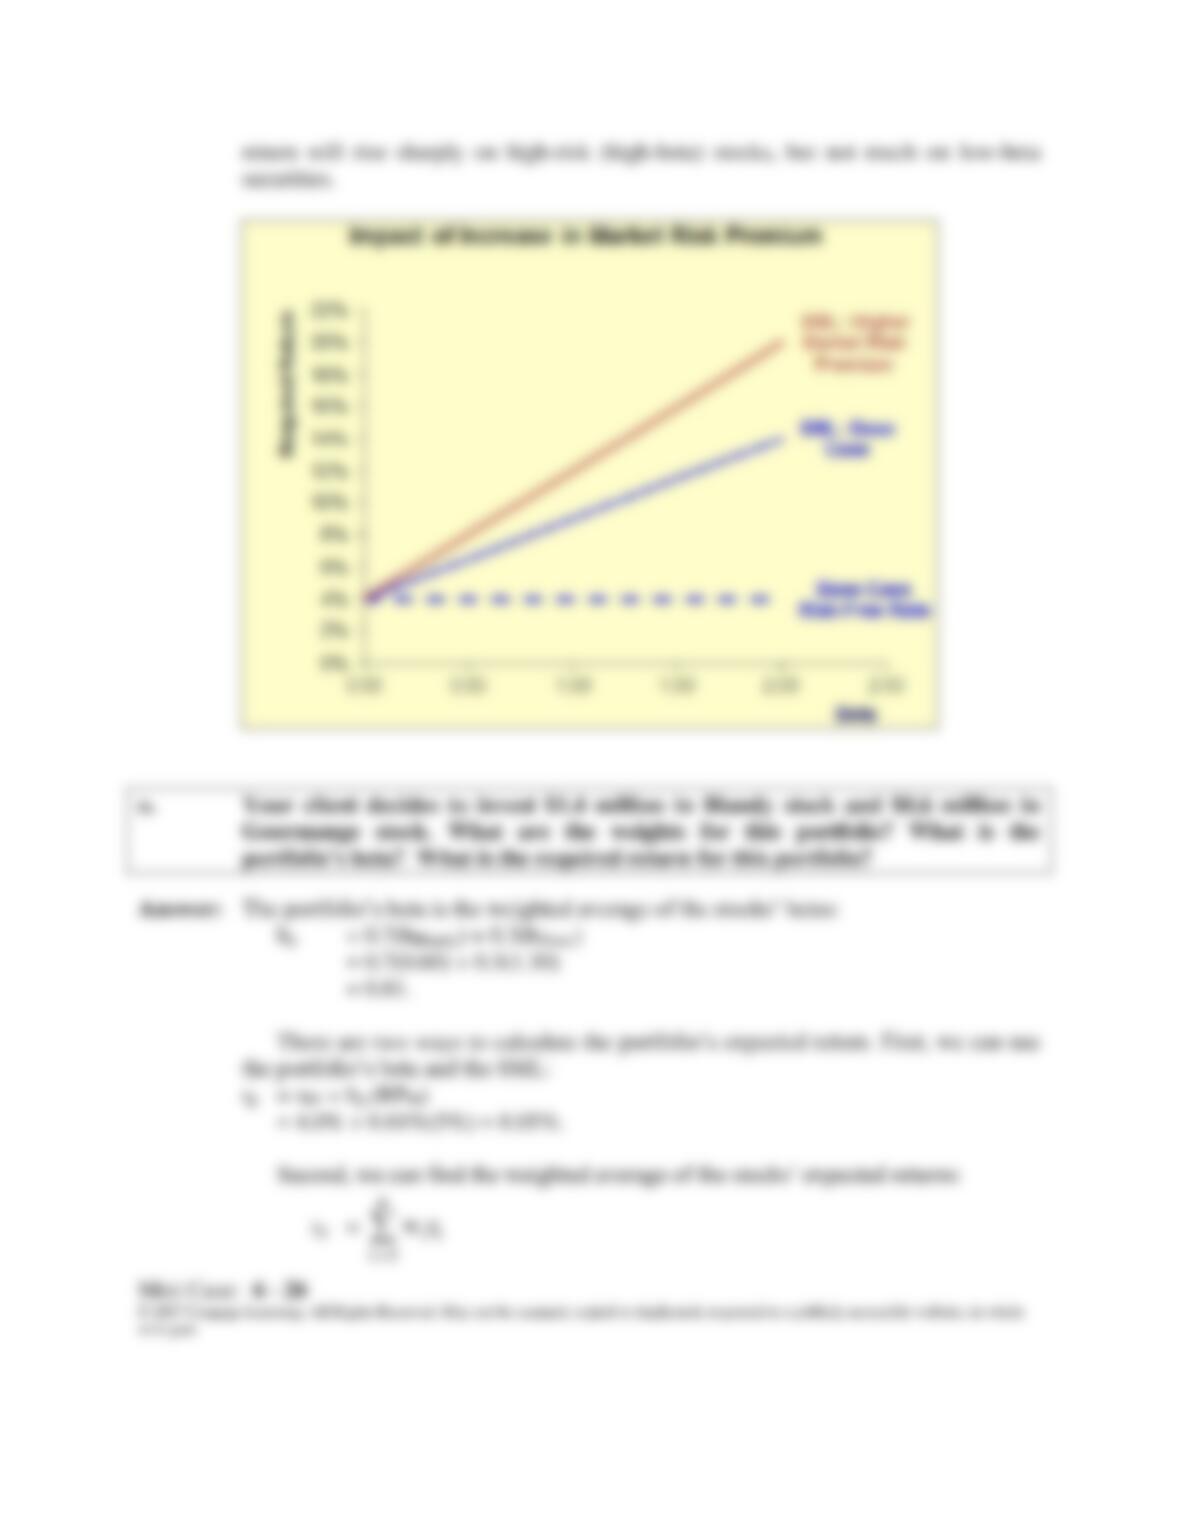
on the SML and on the returns required on high-risk and low-risk securities?
o. Your client decides to invest $1.4 million in Blandy stock and $0.6 million in
Gourmange stock. What are the weights for this portfolio? What is the
portfolio’s beta? What is the required return for this portfolio?
Answer: The portfolio’s beta is the weighted average of the stocks’ betas:
There are two ways to calculate the portfolio’s expected return. First, we can use
the portfolio’s beta and the SML: